RHOMBOHEDRAL IRON TRIFLUORIDE WITH A HIERARCHIZED
MACROPOROUS/MESOPOROUS TEXTURE FROM GASEOUS FLUORINATION OF
IRON DISILICIDE
Diane Delbègue (1)(2), Katia Guérin (1)(2), Barbara Laik (3), Jean-Pierre Pereira-Ramos (3), Moulay-Tahar
Sougrati (4), Céline Cénac-Morthe (5) (1)
Université Clermont Auvergne, Université Blaise Pascal, Institut de Chimie de Clermont-Ferrand, BP 10448, F-63000 CLERMONT-FERRAND, France, Diane.Delbegue@univ-bpclermont.fr
(2)CNRS, UMR 6296, ICCF, F-63171 Aubière, France (3)
Université Paris Est Créteil, Institut de Chimie et des Matériaux Paris-Est, UMR CNRS 7182 Thiais, France
(4)
Université Montpellier II, Institut Charles Gerhardt de Montpellier, UMR CNRS 5253 Montpellier, France
(5)
Centre National d’Etudes Spatiales, Toulouse, France, Celine.Cenac-Morthe@cnes.fr ABSTRACT
Stable low temperature rhombohedral iron trifluoride has been obtained by the fluorination under the pure fluorine gas of iron disilicide. The combination of both unusual fluorination process and precursor avoids to get unhydrated crystalline FeF3 particles and allows the
formation of hierarchized channels of mesoporous/macroporous texture favorable for lithium diffusion. The fluorination mechanism proceeds by temperature steps from the formation, for a fluorination temperature below 200 °C, of an amorphous phase and an intermediate iron difluoride identified mainly by 57Fe Mössbauer spectroscopy before getting, as soon as a fluorination temperature of 260 °C is reached, the rhombohedral FeF3. Both amorphous and crystallized
samples display good ability for electrochemical process when used as cathode in lithium-ion battery. The low diameter of rhombohedral structure channels is balanced by an appropriate mesoporous texture and a capacity of 225 mAh.g-1 after 5 cycles for a discharge cut-off of 2.5 V vs. Li+/Li at a current density of C/20 has been obtained and stabilized at 95 mAh.g-1 after 116 cycles. 1. INTRODUCTION
Recently, Li-storage batteries have drawn tremendous attention due to their large potential market for electric vehicles and electronic consumables and devices. To realize satisfactory power and energy densities, new cathode materials must be explored [1-3]. Conversion reactions which imply the full reduction by lithium of a compound containing a metal at a high oxidation state into metal are promising reactions for designing high energy density batteries because of the large electron exchange during the electrochemical process. In order to insure high output voltage, only metal halides, for which the ionicity of the bonding is important, are good candidates and among the metal halides, only the metal fluorides do not dissolve into the electrolyte [4, 5]. Most of the researches on metal fluorides/Li batteries were devoted to surpass the insulator behavior of fluorides. Many attempts have been then dedicated to decreasing the particle size of such materials and to increase their
conductivity by high energy ball-milling them with conductive carbon [6] or focusing on hydrated phases, because of the presence of water favoring the ionic conductivity [7].
Iron trifluoride has attracted substantial interest due to its electromotive force value of 3.2 V and a large theoretical capacity of 711 mAh.g-1 for a redox process of three exchanged electrons [8], [9]. This capacity value is larger from the practical capacity obtained for the operational cathode materials of secondary batteries made of LiFePO4 or LiCoO2. Three electron process of
metal fluorides results from two types of redox mechanism: a first one which proceeds at high potential and is due to an insertion mechanism, the second one which proceeds at lower potential and is due to a conversion mechanism. Looking at the only insertion mechanism into iron trifluorides leads to a theoretical capacity of 237 mAh.g-1 larger than the practical 170 mAh.g-1 of today’s cathode materials.
Iron trifluoride crystallizes into three anhydrous polymorphs and two amorphous phases [10]. The three polymorphs known are the rhombohedral form which is the stable high temperature phase denoted r-FeF3, the
orthorhombic hexagonal tungsten bronze phase HTB-FeF3 and the cubic pyrochlore structure Pyr-FeF3 [11].
Many hydrated phases also exist, such as HTB-FeF30.33H2O and tetragonal FeF33H2O [12],[13]. Most
of the electrochemical properties in lithium batteries of FeF3 have been obtained for such hydrated phases
because iron fluorides are mainly synthesized through aqueous solution-based methods [14-17]. For dehydrated phase, the highest performance reported thus far has been obtained by Myung et al. [18] with a capacity as high as 224 mAh.g-1 (1.5-4.5V) at C/10 rate with capacity retention of 71 % after 100 cycles for a r-FeF3 obtained via the evaporation method at 400°C
under argon of FeF33H2O. In spite of their better
performances, dehydrated phases are little studied, maybe because of the high temperature needed to get them. Indeed, for example, to obtain rhombohedral phase, temperatures higher than 400°C are needed [19] and lead to huge particle sizes not favorable for electrochemical purpose.
In this work, the fluorination under pure gaseous fluorine at low temperature has been applied on FeSi2. The resulting materials have been
characterized depending on their structure by X-ray diffraction, Raman and 57Fe Mössbauer spectroscopies and their texture by Scanning Electron Microscopy SEM and nitrogen adsorption isotherms. Finally, a preliminary electrochemical study has been performed in lithium batteries. 2. RESULTS
FeSi2 has been fluorinated under a flux of pure
gaseous fluorine at various temperatures up to 350 °C. FeSi2 present two phases: α-FeSi2 and β-FeSi2.
X-ray diffraction, Raman and 57Fe Mössbauer spectroscopies show that the synthesis involves three steps for the formation of r-FeF3. For a
fluorination temperature of 150 °C, α-FeSi2 is
preserved and β-FeSi2 is converted into FeF2. At
200 °C, α-FeSi2 and FeF2 are totally converted into
amorphous FeF3. Finally for a temperature higher
than 260 °C, this amorphous FeF3 turns into r-FeF3.
The Fe-F bonding and their structural organization are key points for electrochemical purpose, but the texture is another strategic point which is often not clearly characterized. We have chosen to characterize in depth the texture evolution upon increase of the fluorination temperature. Indeed, morphology and texture as well as physical-chemical properties including the surface behavior of crystalline FeF3 can be assumed to be different
from that of amorphous FeF3 obtained from the low
temperature fluorination.
According to IUPAC classifications, the nitrogen adsorption/desorption measurements show type IV isotherms, indicating mesoporous morphology of fluoride compounds with the presence of a hysteresis loop. The shape of the hysteresis loop and the steep desorption branch classify it as of the H2 type for the lowest fluorination temperatures.
This occurs for assemblies of tubular capillaries open at both ends [20].The dimensions responsible for the adsorption branch of the isotherm are heterogeneously distributed and the dimensions responsible for desorption are of equal size. For a fluorination temperature of 350 °C, H2 type turns
into an H3 type with an adsorption branch steeper at
saturation pressure. This occurs for assemblies of capillaries with slit shapes or with very wide bodies and a narrow, short neck. It can be surmised that tubular capillaries have been closed at one end with increasing fluorination temperature.
The SSA, calculated by the standard BET method, increases with fluorination temperature up to about 48 m2.g-1 for the amorphous compound (Tab. 1). It then decreases for a fluorination temperature of 350 °C. Such high value of SSA is unusual for fluoride
compounds (SSA of crystalline FeF3 lower than 7
m2.g-1 [21]) and is only obtained by solution nanostructuration [7]. The origin of the value of SSA is then totally different in our case. Here, SSA is due to pore formation into a micrometric texture, whereas for classical nanostructured fluorides, SSA is due to surface development of dense nanoparticles. Such differences on texture should act on lithium diffusion process during electrochemistry. In the case of nanostructures materials, lithium will act directly with each nanoparticle surface, whereas with porous micrometric particles, lithium will have to diffuse into the porosity.
Pore size distribution is the highest at about 3.5 nm for the compound fluorinated at 150 °C. The size is practically the same for the sample synthesized at 200 °C but the mesoporous porous volume is twice as much. Two mesopore size distributions are present for the sample fluorinated at 350 °C: the one centered at 3.5 nm and other larger centered at 15 nm which consequently increases the pore mesopore volume up to 0.106 cm3.g-1. The mesoporous texture is connected to a macroporous texture of lower pore volume. The macropore volume increases with the fluorination temperature because of the pore collapse with improvement of crystallization.
It is to note that the acetylene black –fluorinated sample mixture, ground for electrochemical purpose has also been analyzed by nitrogen adsorption isotherm. The SSA obtained is the weighted average of the SSA of each component of the mixture. The conditions applied for grinding can be concluded not to modify the texture of the sample and only favor a good dispersion of conductive carbon into insulating fluoride. Fluorination temperature 150 °C 200 °C 300 °C SSA (m2.g-1) 13.3 48.0 32.1 Vmicro (cm 3 .g-1) 0.000 0.002 0.001 Vmeso (cm 3 .g-1) 0.030 0.060 0.106 Vmacro (cm 3 .g-1) 0.009 0.014 0.032
Medium pore size (nm) 3.5 3.5 3.5 & 15 Table 1. Adsorptive properties of FeSi2 fluorinated at
different temperatures.
Fig. 1 shows the SEM micrograph of the raw material which appears as a dense material. At low fluorination temperature of 150°C, this material is recovered by a foam. With fluorination temperature increase, some numerous well-defined slit pores are
formed. SEM micrograph of the amorphous material presents a porous material with a high total pore volume in agreement with its unusually high SSA of 48 m2.g-1. During the reaction, the formation and escape of a gas (SiF4) from the precursor
enlarged the surface area of FeF3. The pore size
determined by SEM is in between 150 and 200 nm, i.e. in the macropore range. This pore size does not clearly evolve as soon as fluoride is formed for temperature fluorination of 200 °C. Macroporosity identified by SEM must be connected to a deeper mesoporosity characterized only by nitrogen isotherms, not visible by SEM because of the resolution of such a technique. This texture leads to predict a favorable lithium diffusion process.
Figure 1. SEM micrographs of FeSi2, fluorinated at
150°C, 200°C and 350°C
The r-FeF3 phase used as cathode in secondary
lithium batteries stands out from the other trifluoride iron phases by both its high and flat operating voltage [6]. Our electrochemical measurements confirm these facts. During the first discharge, a long flat plateau at 3.35 V is clearly observed, followed by an ill-defined process centered at about 3.0 V. The electrochemical properties were measured by using galvanostatic discharge-charge experiments. To get the best electrochemical fingerprint both in terms of capacity and working potential, galvanostatic experiments were performed at 50 and 60 °C in order to facilitate conduction and diffusion processes. This implies to use an electrolyte stable at such high temperature of cycling in our operating conditions. LiClO4 PC 1M appears as a suitable
electrolyte. The profiles of galvanostatic discharge-charge were then measured in the range of 2.5-4.3 V. As in this voltage range carbon has no contribution in the specific capacity), the observed charge/discharge capacities can be directly and solely assigned to the electroactive iron fluoride. [22]
The specific capacity was about 250 mAh.g-1, very close to the theoretical value of | 240 mAh.g-1
when considering the transfer of one electron as specified in eq. 1:
FeF3 + e- + Li+t LiFeF3 Eq. 1
Besides, each of the two contributions involved roughly 0.5 electron. This behavior is in agreement with a transformation reported in literature operating initially through a two-phase region related with the 3.35 V voltage plateau up to Li0.5FeF3 and then through a solid-solution reaction
centered at 3 V that involves insertion of lithium in Li0.5+xFeF3 up to LiFeF3 [9],[23]. The reverse scan
depicts a dissymmetric charge curve with two main electrochemical steps and leads to a coulombic efficiency of 88 %. Subsequent cycles kept the same shape even if a decrease of the capacity is observed. The step at higher potential is more impacted in particular during the first ten cycles, while the second one remained quite stable. From cycle 10 to cycle 20, a stabilization of the capacity is achieved and interesting capacities about 100 mAh.g-1 are still available.
Fig. 2 and Fig. 3 evidenced the influence of the temperature on the electrochemical behavior of the r-FeF3 material. Presented cycles are recorded at 60
°C. The first discharge kept the same previous profile observed at 50 °C with the well-marked two-step insertion process. The major difference appears at lower potentials. Indeed, instead of a rapid potential decrease, characteristic of the end of the insertion step, a third process begins below 2.7 V highlighting the involvement of a partial conversion according to equation 2:
LiFeF3 + 2e- + 2Li+t Fe + 3 LiF Eq. 2
The restored capacity of 317 mAh.g-1 confirmed this statement as about 80 mAh.g-1 more were obtained with respect to the expected theoretical capacity for a Li uptake of 1 Li per mole of FeF3.
The temperature increase seems to favor conversion that happens at higher potential while no effect on insertion has been noticed.
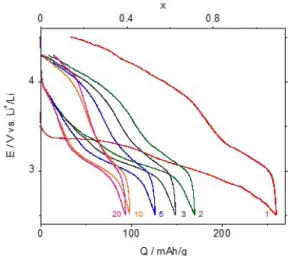
Electrochemical cycling was performed on crystallized FeF3 over 100 cycles. Fig. 2 shows the
voltage versus the capacity for selected 100 cycles. After 100 cycles, r-FeF3 shows 70 % capacity loss
and the discharge capacity was still as large as 95 mAh.g-1. There are few examples of electrochemical cycling in a short operating voltage (2.5 -4.3 V) in the literature on r-FeF3, but for
example, recently J. H. Tan et al. have shown a first discharge capacity of about 115 mAh.g-1 and after 100 cycles a capacity of 70 mAh.g-1 [24]. The loss of capacity is higher in our case, but for the first discharge and for the 100th cycle, the delivered capacity were obviously higher. This large difference of capacity on a same compound can be explained by the difference in the porosity, induced by the liberation of SiF4 during fluorination, which
recent works have studied the impac surface area of FeF3 on its
properties. For example, R. Ma embedded a r-FeF3 of specific surf
m2.g-1 into a carbon replica and surface area of 204.7 m2.g-1 of th increase of more than 90 % of both charge capacities were registered. It as a buffering effect of the carbon plays an important role in interconn particles as well as accommodatin change during the electrochemical These experimental data together wi indicate that the high specific surfa porous structure contribute to facili insertion and improve the properties.
Figure 2. Charge/discharge cycles of a FeF3 cell obtained at 60
Figure 3. Charge/discharge cycles of a FeF3 cell obtained at 50
3. CONCLUSION
Whereas most of the studies on FeF3 as cathode materia
lithium battery focus on HTB hydra
ct of the specific electrochemical a et al. have face area of 6.9 a consecutive he mixture: an h discharge and t was explained n matrix which necting the FeF3
ng the volume l reaction [21]. ith ours seem to
ce area and the tate the lithium electrochemical Li/crystallized r-°C Li/crystallized r-°C electrochemical al in secondary
ated phase, this
work focuses on the rhombohedral phase. The k of this phase result from synthesis, which leads to hu particles. A new synthe developed in order to form at low temperature, i.e. fro pure fluorine gas on iron has also been chosen fluorination of SiF4 which
gas. In this way, a mesopo 3.5 nm connected with a m 150 nm is formed as so process starts. Rhombohe ability as cathode material lower hysteresis and a lo cycle for amorphous phase rhombohedral one. This work opens the way t precursors usable under p other pore size distributi carbon (graphene for e mecanochemistry can also improve the electrochemic present materials.
4. REFERENCES
1. Tarascon, J.M., & Arm Better Batteries. Nature 2. Bruce, P.G., Scrosati, B. Nanomaterials for Recha Angewandte Chemie Int 2930-2946.
3. Goodenough, J.B. & Ki for rechargeable Li bat 587-603.
4. Arai, H., Okada, S., Sa (1997). Cathode per estimation of metal trih 68(2), 716-719.
5. Bervas, M., Mansour, Sharab, J.F., Badway, L.C. & Amatucci, G.G the Lithiation and Mechanisms of Nanocomposites. J. Ele A799-A808. 6. Badway, F., Pereira, Amatucci, G.G. (2003 Nanocomposites: Struct potentiality of the known low performances m its high temperature
uge crystalline insulating esis process has been
the rhombohedral phase om 260 °C by applying disilicide. Iron disilicide for its release during is a known pore-forming orous texture centered at macroporous one nearby oon as the fluorination edral phases have good in lithium battery with a ower capacity loss upon
and a higher capacity for to the use of many other pure fluorine gas to get
ion. The nature of the example) used during o be tuned in order to cal performances of the
mand, M. (2008). Building 451, 652-657.
. & Tarascon, J.-M. (2008). argeable Lithium Batteries. ternational Edition 47(16),
im., Y. (2010). Challenges tteries. Chem. Mater. 22
akurai, Y. & Yamaki, J.-i. rformance and voltage halides. J. Power Sources
A.N., Yoon, W.-S., Al-F., Cosandey, Al-F., Klein, G. (2006). Investigation of Delithiation Conversion Bismuth Fluoride ectrochem. Soc. 153(4), N., Cosandey, F. & ). Carbon-Metal Fluoride ture and Electrochemistry
of FeF 3 : C. J. Electrochem. Soc. 150(9), A1209-A1218.
7. Li, C., Gu, L., Tong, J., Tsukimoto, S. & Maier, J. (2011). A Mesoporous Iron-Based Fluoride Cathode of Tunnel Structure for Rechargeable Lithium Batteries. Adv. Functional Mater. 21(8), 1391-1397.
8. Doe, R.E., Persson, K.A., Meng, Y.S .& Ceder, G. (2008). First-Principles Investigation of the Li−Fe−F Phase Diagram and Equilibrium and Nonequilibrium Conversion Reactions of Iron Fluorides with Lithium. Chem. Mater. 20(16), 5274-5283.
9. Conte, D. & Pinna, N. (2014). A review on the application of iron(III) fluorides as positive electrodes for secondary cells. Mater. Renew. Sustain. Energy 3(4), 1-22.
10. Ferey, G., Leblanc, M., De Pape, R. & Pannetier, J., (1985). Competing Spin Interactions and Frustration Effects in Fluorides, in Inorganic Solid Fluorides, P. Hagenmuller, Editor Academic Press, pp 395-414.
11. Louvain, N., Fakhry, A., Bonnet, P., El-Ghozzi, M., Guerin, K., Sougrati, M.-T., Jumas, J.-C. & Willmann, P. (2013). One-shot versus stepwise gas-solid synthesis of iron trifluoride: investigation of pure molecular F2 fluorination of chloride
precursors. Cryst. Eng. Comm. 15(18), 3664-3671.
12. Leblanc, M., Ferey, G., Chevallier, P., Calage, Y. & De Pape, R. (1983). Hexagonal tungsten bronze-type FeIII fluoride: (H2O)0.33FeF3; crystal
structure, magnetic properties, dehydration to a new form of iron trifluoride. J. Solid State Chem. 47(1), 53-58.
13. Ferey, G., Leblanc, M., De Pape, R., Passaret, M. & Bothorel-Razazi, M.P. (1975). Cristallisation par voie hydrothermale des fluorures FeF3; FeF3,
H2O; FeF3, 3H2O; et NH4FeF4. J. Crystal Growth
29(2), 209-211.
14. Kim, S.-W., Seo, D.-H., Gwon, H., Kim, J. & Kang, K. (2010). Fabrication of FeF3 Nanoflowers
on CNT Branches and Their Application to High Power Lithium Rechargeable Batteries. Adv. Mater. 22(46), 5260-5264.
15. Li, C., Gu, L., Tong, J. & Maier, J. (2011). Carbon Nanotube Wiring of Electrodes for High-Rate Lithium Batteries Using an Imidazolium-Based Ionic Liquid Precursor as Dispersant and Binder:
A Case Study on Iron Fluoride Nanoparticles. ACS Nano 5(4), 2930-2938.
16. Li, C., Yin, C., Mu, X. & Maier, J. (2013). Top-Down Synthesis of Open Framework Fluoride for Lithium and Sodium Batteries. Chem. Mater. 25(6), 962-969.
17. Tan, J., Liu, L., Hu, H., Yang, Z., Guo, H., Wei, Q., Yi, X., Yan, Z., Zhou, Q., Huang, Z., Shu, H., Yang, X. & Wang, X. (2014). Iron fluoride with excellent cycle performance synthesized by solvothermal method as cathodes for lithium ion batteries. J. Power Sources 251, 75-84.
18. Myung, S.-T., Sakurada, S., Yashiro, H. & Sun, Y.-K. (2013). Iron trifluoride synthesized via evaporation method and its application to rechargeable lithium batteries. J. Power Sources 223, 1-8.
19. Greneche, J.M., Varret, F., Leblanc, M. & Ferey, G. (1987). Mössbauer spectroscopy study of crystallization of amorphous iron (III) fluorides: Influence of experimental conditions. Solid State Comm. 61(12), 813-816.
20. Leofanti, G., Padovan, M., Tozzola, G. & Venturelli, B. (1998). Surface area and pore texture of catalysts. Catalysis Today 41, 207-219. 21. Ma, R., Wang, M., Tao, P., Wang, Y., Cao, C.,
Shan, G., Yang, S., Xi, L., Chung, J.C.Y. & Lu, Z. (2013). Fabrication of FeF3 nanocrystals dispersed
into a porous carbon matrix as a high performance cathode material for lithium ion batteries. J. Mater. Chem. A 1(47), 15060-15067.
22. Collins, J., Gourdin, G., Foster, M. & Qu, D. (2015). Carbon surface functionalities and SEI formation during Li intercalation. Carbon 92, 193-244.
23. Yamakawa, N., Jiang, M., Key, B. & Grey, C.P. (2009). Identifying the Local Structures Formed during Lithiation of the Conversion Material, Iron Fluoride, in a Li Ion Battery: A Solid-State NMR, X-ray Diffraction, and Pair Distribution Function Analysis Study. J. Am. Chem. Soc. 131(30), 10525-10536.
24. Tan, H.J., Smith, H.L., Kim, L., Harding, T.K., Jones, S.C. & Fultz, B. (2014). Electrochemical Cycling and Lithium Insertion in Nanostructured FeF3 Cathodes. J. Electrochem. Soc. 161(3),