Supplementary Information
Systematic analysis of synergistic proteome modulations in a drug
combination of cisplatin and MLN4924
Dominik Andre Megger,*a,b Shadi Abou-Eid,a,c Birgit Zülcha and Barbara Sitek a
a Medizinisches Proteom-Center, Ruhr Universität Bochum, Bochum, Germany
b Institute for Virology, University Hospital Essen, University Duisburg-Essen, Essen, Germany c Department of Biology, University of Fribourg, Switzerland
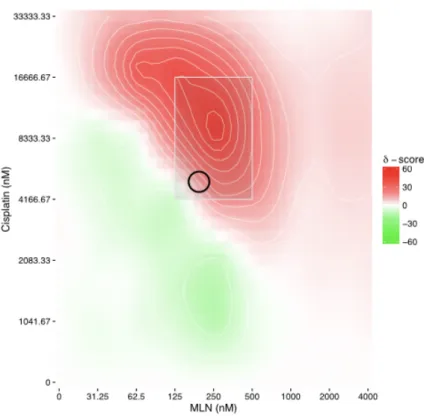
Figure S1. Synergy analysis using SynergyFinder application (https://synergyfinder.fimm.fi).
The heat map shows synergistic scores (ZIP scoring) depending on concentrations of MLN4924 and Cisplatin. Red color indicates synergistic interaction, whereas green color indicates antagonistic effects. The light grey rectangle highlights the region of highest synergy in the respective combination. The conditions used in the proteomics experiment (Cisplatin: 5 µM, MLN4924: 0.2 µM) is indicated by a black circle, which lies in the region of highest synergy.