HAL Id: hal-03107402
https://hal-amu.archives-ouvertes.fr/hal-03107402
Submitted on 12 Jan 2021
HAL is a multi-disciplinary open access
archive for the deposit and dissemination of
sci-entific research documents, whether they are
pub-lished or not. The documents may come from
teaching and research institutions in France or
abroad, or from public or private research centers.
L’archive ouverte pluridisciplinaire HAL, est
destinée au dépôt et à la diffusion de documents
scientifiques de niveau recherche, publiés ou non,
émanant des établissements d’enseignement et de
recherche français ou étrangers, des laboratoires
publics ou privés.
Distributed under a Creative Commons Attribution| 4.0 International License
The dynamic modular fingerprints of the human brain
at rest
Aya Kabbara, Veronique Paban, Mahmoud Hassan
To cite this version:
Aya Kabbara, Veronique Paban, Mahmoud Hassan. The dynamic modular fingerprints of the human
brain at rest. NeuroImage, Elsevier, 2021, 227, pp.117674. �10.1016/j.neuroimage.2020.117674�.
�hal-03107402�
NeuroImage227(2021)117674
ContentslistsavailableatScienceDirect
NeuroImage
journalhomepage:www.elsevier.com/locate/neuroimage
The
dynamic
modular
fingerprints
of
the
human
brain
at
rest
A.
Kabbara
a,
V.
Paban
b,
M.
Hassan
a,c,∗a Univ Rennes, LTSI - U1099, Rennes F-35000, France b Aix Marseille University, CNRS, LNSC, Marseille, France c NeuroKyma, Rennes F-35000, France
a
b
s
t
r
a
c
t
The human brain is a dynamic modular network that can be decomposed into a set of modules, and its activity changes continually over time. At rest, several brain networks, known as Resting-State Networks (RSNs), emerge and cross-communicate even at sub-second temporal scale. Here, we seek to decipher the fast reshaping in spontaneous brain modularity and its relationships with RSNs. We use Electro/Magneto-Encephalography (EEG/MEG) to track the dynamics of modular brain networks, in three independent datasets ( N= 568) of healthy subjects at rest. We show the presence of strikingly consistent RSNs, and a splitting phenomenon of some of these networks, especially the default mode network, visual, temporal and dorsal attentional networks. We also demonstrate that between-subjects variability in mental imagery is associated with the temporal characteristics of specific modules, particularly the visual network. Taken together, our findings show that large-scale electrophysiological networks have modularity-dependent dynamic fingerprints at rest.
1. Introduction
Spontaneous brain activity changes continuously, over multiple temporalscalesrangingfrom sub-secondtoyears.Thosefluctuations involve a set of networks known as resting-state networks (RSNs) (Damoiseaux et al., 2012; Raichle et al., 2001) . To decipher the ultra-fast dynamic reconfiguration of these RSNs and their cross-communications,severalfunctionalstudieshavebeenconducted.Some studieshavedescribedthedynamictopologicalchangesoffunctional networks using graphtheoreticalanalysis (dePasqualeet al., 2015; Jiaoetal., 2018;Kabbaraetal.,2017).Othersfocused ondetecting ‘brainnetworkstates’fluctuatingover time(E.A.Allenet al., 2014; Bakeretal.,2014).Themainideaisthatspontaneousbrainactivitycan beexplainedbyasetofspatiotemporalnetworkpatterns.Moststudies havebeenperformedincombinationwithdimensionalityreduction al-gorithms(suchasK-meansclustering(E.A.Allenetal.,2014),principal componentanalysis(PretiandVanDeVille,2016;Leonardietal.,2013), orthogonal connectivity factorization (Hyvärinen et al., 2016)), or model-basedapproaches,suchasHiddenMarkovModels(Bakeretal., 2014).Features derivedfrom these fast-dynamicanalyses were also shownaspotentialneuromarkersforsomebraindiseases(Filippietal., 2019;AKabbaraetal.,2018;Liuetal.,2019)andbehavioral charac-teristics(Kenettetal.,2020;Tompsonetal.,2018).
Emergingevidenceshowsthatthehumanbrainisamodularnetwork partitionedinto‘modules’)alsocalledcommunitiesorclusters) denot-ingbrainregionsthatarehighlyintra-connectedandweaklyconnected withothers(BassettandSporns,2017).Themodularorganizationof thehumanbrainnetworkanditsdynamicswereshowntobe associ-atedwithaging(Meunieretal., 2009)andseveraltask-relatedbrain
∗ Corresponding author.
E-mailaddress:mahmoud.hassan@univ-rennes1.fr(M. Hassan).
functionssuchaslearning(Bassettetal.,2011) andcognitiveefforts (Kitzbichleretal.,2011).Whileseveralresting-statefunctional mag-neticresonanceimaging(fMRI)studieshavebeenconductedto investi-gatethetime-dependenceofbrainmodularnetworks(E.A.Allenetal., 2014;Jonesetal.,2012;Zaleskyetal.,2014),theevidenceforrapid reshapinginspontaneousmodularbrainnetworksandtheir relation-ships withRSNs at timescales associated withfast cognitionis very limited. To precisely track network dynamics, we need a modality thatcanmatchtherapidtimescalesoftheunderlyingbrainfunctions. Inthiscontext,electro/magneto-encephalography(EEG/MEG)canbe used to describe those fast (sub-millisecond) modularity-dependent fluctuations.
Here,wehypothesizedthatthedynamicmodularreorganizationof thehumanbrainatrestischaracterizedbyacontinuousprocessof sep-arationandmergingwithinandacrossdifferentRSNsovertime.To de-tect“modularbrainstates”,weusearecentlydevelopedframeworkthat allowstopreciselyquantifythefluctuationsofthetime-varying‘states’ (A.Kabbaraetal.,2019).Unlikeotherclusteringalgorithms,this frame-workdetectsthefast-transientchangesinthebrainmodularstructure andwasshowntooutperformotherexisting clusteringalgorithmsin termsofspatiotemporalprecision.Wetestedourhypothesisonthree independentEEG/MEGdatasets(N=568)forhealthysubjectsatrest, source-reconstructedto68 regions acrosstheentirecortex.Dynamic brainnetworkswerereconstructedusingtheEEG/MEGsource connec-tivitytechniqueusingbothpower-andphase-couplings(Hassanand Wendling,2018),combinedwithaslidingwindowapproachandan al-gorithmtodetectmodularstates(Fig.1).Notably,ourresultsrevealed thepresenceofconsistentnetworkpatternsformostparticipantsand asplittingphenomenonofsomeofthesenetworks,suchasthedefault
https://doi.org/10.1016/j.neuroimage.2020.117674
Received 23 May 2020; Received in revised form 8 December 2020; Accepted 17 December 2020
1053-8119/© 2020 The Authors. Published by Elsevier Inc. This is an open access article under the CC BY-NC-ND license ( http://creativecommons.org/licenses/by-nc-nd/4.0/)
A. Kabbara, V. Paban and M. Hassan NeuroImage 227 (2021) 117674
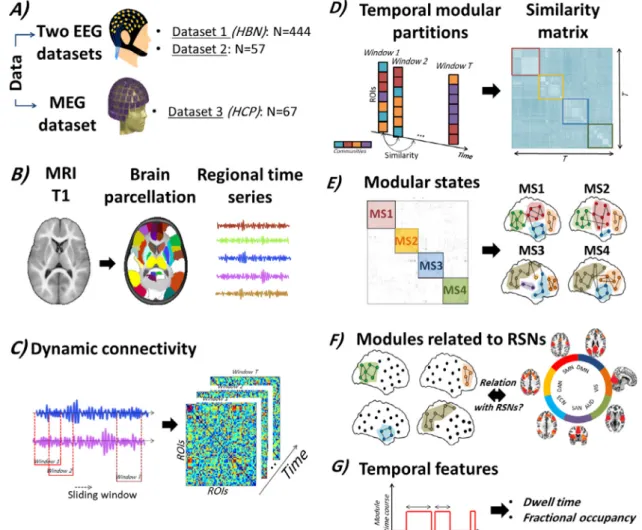
Fig.1. Study pipeline. (A) Three datasets were analyzed: 1) Resting-state EEG data provided from the healthy brain network biobank including 444 subjects; 2) Resting-state EEG data acquired from 56 healthy subjects; and 3) Resting-state MEG data provided from the human connectome project including 61 subjects. (B) The template MRI was segmented into regions of interest (ROIs) by the means of an anatomical atlas ( Desikanetal.,2006). Then, the regional time series of each subject were reconstructed using the weighted minimum norm estimate inverse solution (WMNE) for Datasets 1 and 2, and beamforming for Dataset 3. (C) Using a sliding window technique, the dynamic brain networks were computed. (D) The first step in the modularity-based algorithm was to parcellate each temporal network into communities. Then, the similarity between the temporal modular structures was assessed. (E) The similarity matrix was segmented into different communities where each one represents a modular state of specific spatial topology combining different time windows. (F) Following this, all the modules derived from the different MSs were extracted for each subject. Among them, we only retained those that presented strong association with RSNs (more than 80% of nodal overlap). Please see Supplementary materials for the definition of RSNs. (G) The mean dwell time and fractional occupancies were calculated for the main modules related to RSNs. (For interpretation of the references to color in this figure legend, the reader is referred to the web version of this article.)
mode,visual,temporalanddorsalattentionalnetworks.Wespeculate thattrackingthefastmodulararchitectureofongoingneuronalactivity providesnewinsightsintothedynamicsofthelarge-scale electrophys-iologicalnetworkorganizationofthehumanbrain.
2. Results
We performed our analysis on three independent datasets: 1) Resting-state EEG data provided from the Healthy brain network biobankcomprising444subjects; 2)Resting-stateEEGdataacquired from 56 healthy subjects; and3) Resting state MEG data provided fromthe HumanConnectomeProjectincluding61 subjects. The dy-namic functionalconnectivity networks wereassessed for each sub-ject using the EEG/MEG source connectivity method (Hassan and Wendling, 2018). For EEG datasets (datasets 1 and 2), we used the weightedMinimum NormEstimate (wMNE) followed by phase-couplingsasrecommendedbypreviousEEGstudies(Hassanetal.,2016; M.2014).FortheMEGdataset(dataset3),weusedthebeamforming approachfollowedbyenvelope-couplings,asrecommendedinprevious MEGstudies(O’Neilletal.,2017a;Tijmsetal.,2013),withcorrection
forspatialleakagetoreducevolumeconductioneffects.Then,a slid-ingwindowtechniquewasappliedformingacontinuousseriesof snap-shotscharacterizingtheevolutionofeachindividual’sfunctionalbrain network(seeMaterialsandMethodsfordetailsabouttheconstruction of EEG/MEGfunctionalnetworks).Then,weappliedthe modularity-basedalgorithmthatusesasaninputthetensorofdynamicnetworks andproducemodularstates(MSs)fluctuatingovertime,whereeach MSrepresentsaunique modulartopology.Briefly,thealgorithm de-tects themodularstructures sharingthe sametopology by quantify-ingthesimilaritybetween allthecomputed temporalpartitions.We thenidentifiedtheindividualmodulespresentingastrongassociation withoneorseveralRSNs.Thefullpipelineofthestudyisillustratedin Fig.1.
2.1. 16stateswereidentifiedforthefirstdatabase
Fig.2illustratesthe16modulesderivedfromthe444subjectsinthe alphaband.Italsoreportsthepercentageofsubjectsexhibitingeachof themodules.Onecanrealizethatthreederivedmodulesarerelatedto theDMN:POST-DMNincludingtheposteriorcomponentsoftheDMN
A. Kabbara, V. Paban and M. Hassan NeuroImage 227 (2021) 117674
Fig.2. Results of Dataset 1 obtained in the alpha band: Derived modules associated to RSNs and their corresponding percentage of subjects. system(posteriorcingulate,parahippocampal,precuneus,andinferior
parietallobuleregions),ANT-DMNincludingtheanteriorcomponents oftheDMN(prefrontalregions),andDMNwhichrepresentsthelarge moduleintegratingbothposteriorandanteriorpartsintothesame mod-ule.Also,threetemporalmodularconfigurationsaredepicted:l-TEMP andR-TEMPrepresentingtheleftandrightsuperiorandinferior tem-poralregions,respectively;andTEMPthatcombinesbothleftandright temporalmodules.Inaddition,twomodulesrelatedtothevisual net-workwereobserved:theventral-VIS,includingtheventralregionsofthe visualnetwork;andVISintegratingventralanddorsalvisualregions. Overall,themodulesrankedfromthehighesttothelowestpercentage ofsubjectsare:DMN(presentin96%ofsubjects),POST-DMN(present in88%ofsubjects),VIS-visualnetwork(presentin86%ofsubjects), ANT-DMN(present in86%of subjects),SMN-somatomotornetwork (presentin83%ofsubjects),DAN-dorsalattentionalnetwork(present in80%ofsubjects),l-TEMP(presentin76%ofsubjects),TEMP(present in63%ofsubjects),SAN-saliencenetwork(presentin63%ofsubjects), AUD+VIS-(amodulethatcombinesbothauditoryandvisualnetworks, presentin61%ofsubjects),DMN+FPN– (amodulethatcombinesboth defaultmodeandfrontoparietalnetworks,presentin58%ofsubjects), DAN+VIS-(amodulethatcombinesDANandVIS,presentin53%of subjects),R-TEMP(presentin45%ofsubjects),FPN(presentin43%
ofsubjects),AUD+VIS+DAN-(amodulecombiningAUD,VISandDAN networks;presentin35%ofsubjects)andtheventral-VISincluding lin-gualandfusiformvisualregions(presentin25%ofsubjects).Results wereconsistentamongseveralthresholdvaluesoffunctional connec-tivitymatrices(seeTableS1)andalsowithinthebetafrequencyband (seeTableS4).
2.2. 12stateswereidentifiedfortheseconddatabase
Accordingtotheseconddataset(Fig.3),12modulesareextracted fromthe57subjectsinthealphafrequencyband.Thesemodulesare: POST-DMN(presentin98%ofsubjects),VIS(presentin94%of sub-jects),DAN(presentin91%ofsubjects),DMN(presentin84%of sub-jects),L-TEMP(presentin82%ofsubjects),ANT-DMN(presentin81% of subjects),SMN (presentin73%ofsubjects),AUD+VIS(presentin 68%ofsubjects),DAN+VIS(presentin60%ofsubjects),TEMP(present in45%ofsubjects),DMN+CCN(amodulethatcombinesDMNwith cog-nitivecontrolcomponents,presentin32%ofsubjects)andSAN(present in22%ofsubjects).Resultswerealsoconsistentamongseveral thresh-oldvaluesoffunctionalconnectivitymatrices(seeTableS2)andwithin thebetafrequencyband(seeTableS5).
A. Kabbara, V. Paban and M. Hassan NeuroImage 227 (2021) 117674
Fig.3. Results of Dataset 2 obtained in the alpha band: Derived modules associated to RSNs and their corresponding percentage of subjects.
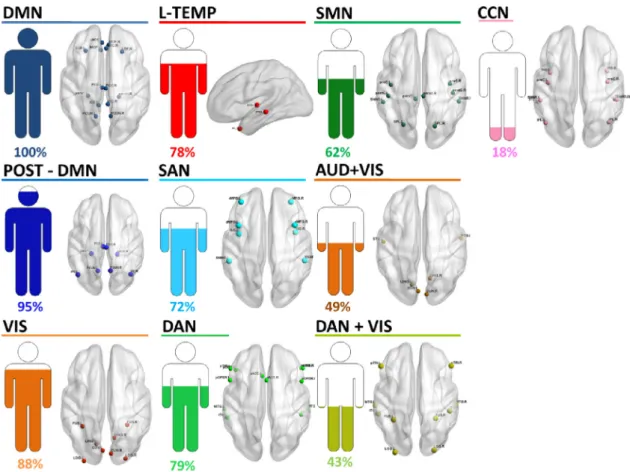
2.3. 10stateswereidentifiedforthethirddatabase
InFig.4,weillustratetheresultsobtainedinthealphabandforthe thirddatasetshowing10modulesderivedfromthe61subjects:DMN (presentin100%ofsubjects),POST-DMN(presentin95%ofsubjects), VIS(presentin88%ofsubjects),L-TEMP(presentin78%ofsubjects), SAN(presentin72%ofsubjects),DAN(presentin79%ofsubjects), SMN(presentin62%ofsubjects),AUD+VIS(presentin49%of sub-jects),DAN+VIS(presentin43%ofsubjects)andCCN(presentin18% ofsubjects).Resultswereconsistentamongseveralthresholdvaluesof functionalconnectivitymatrices(seeTableS3)andwithinthebeta fre-quencyband(seeTableS6).
Insummary,resultsobtained forthethree datasetsrevealed fluc-tuatingmodulesconcordantwiththewell-knownRSNs.Inparticular, thedefaultmodenetworkwasthemostconsistentnetworkamong sub-jectsinalldatasets(reflectedbythehighestpercentageofpresenceover subjects).ResultsalsoshowedthatsomeRSNspresentvariousmodular topologiesovertimesuchasDMN,temporalandthevisualnetworks. In addition, modules that combine several RSNs are observed over time,reflectingcross-networkinteractions,asdiscussedbelowinmore details.
Fig.5presentsastep-by-stepexampleofresultsobtainedforatypical subject,where8MSsarederived.Thesimilaritiesbetweenthe30 mod-ulesextractedfromallMSsandRSNstemplatesareassessed(Fig.5.C). Amongthe30modules,18moduleshavesurvivedthe80%thresholdon thenodaloverlap.These18modulesareassociatedto11RSNs:DMN, SAN,SMN,VIS,LTEMP,DAN+VIS,AUD+VIS,POST-DMN,DMN+FPN, FPN,ANT-DMN.VisualinspectionofthesimilaritymatrixofFig.5.C revealsthatDMN,SMN,VIS, ANT-DMN,AUD+VISandLTEMPwere representativeoftwoormoremoduleswhileSAN,DAN+VISand POST-DMNwereassociatedtoasinglemodule.Fig.5.Dpresentsthedynamic fluctuationsofthemodulesidentified,whereeachmoduleiscolor-coded accordingtoitscorrespondingRSN.
2.4. Dwelltimeandthefractionaloccupancy
Inorder toquantifythetemporalcharacteristicsof eachmodule, two metricswerecomputed:dwell time(DT),i.e. theaverage num-berofconsecutivewindowsspentinamodule;andthefractional oc-cupancy (FO),reflecting the proportionof time spent in each mod-ule.Asanexample,themodulesobtainedinFig.5 orderedinterms of FO are: DMN (FO=56%),VIS (FO= 43%),DAN+VIS(FO= 43%), SMN(FO=31%),SAN(FO=19%),LTEMP(FO=14%),AUD+VIS(FO= 10%),ANT-DMN(FO=4%),POSTDMN(FO=3%),DMN+FPN(FO=3%), FPN(FO=3%).IntermsofDT,themodulesareorderedasfollow:DMN (DT=16%),VIS(DT=10%),DAN+VIS(DT=7%),SMN(DT=7%),AUD +VIS(DT=7%),SAN(DT=6%),POSTDMN(DT=6%),LTEMP(DT=6%), FPN(DT=5%),DMN+FPN(DT=5%).
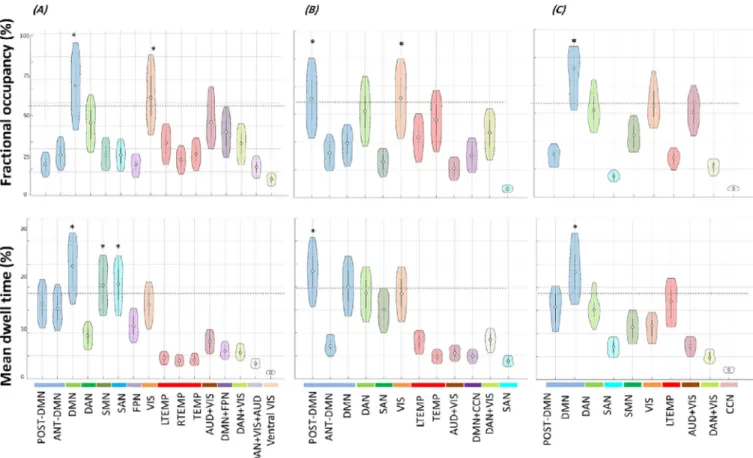
Fig.6reportstheFOsandthemeanDTsofthemodulesobtainedfor eachdataset.TheDMN(oroneofitsmodularconfigurations)hasclearly thehighestFOandDToveralldatasets.TheVISnetworkisshownas significantintermsofFOindataset2.AccordingtotheDT,SMNand SANaredepictedassignificantlystablemodulesindataset1.
Insummary,resultsobtainedfromalldatasetspointsatthe impor-tance(andstability)ofDMNanditsroleasafunctionalcorenetwork duringrest,asdetailedinDiscussion.
2.5. Correlationbetweenthederivedmodulesandmentalimagery Finally,weseekatunderstandingifthereisanycorrelationbetween thederivedmodulesandthesubjectinternalthoughtsexperienced dur-ingresting-stateacquisitionmeasured bytheResting-State Question-naire(rsQ).Onlysuchdatawasavailablefordataset2.More specif-ically, thefivemainindicesderivedfrom thersQ (i.e.visualmental imagery,innerlanguage,somatosensoryawareness,innermusical ex-perience,andmentalmanipulationof numbers)werecorrelatedwith
A. Kabbara, V. Paban and M. Hassan NeuroImage 227 (2021) 117674
Fig.4. Results of Dataset 3 obtained in the alpha band: Derived modules associated to RSNs and their corresponding percentage of subjects.
thetemporalfeaturesofeachmodule.Nosignificantcorrelationswere obtainedbetweenanyofthersQscoresandtheDTofextractedmodules. Fig.7reportssignificantpositivecorrelationsbetweenvisualmental imagery and the fractional occupancy of VIS (𝑝𝐵𝑜𝑛𝑓𝑒𝑟𝑟𝑜𝑛𝑖𝑐𝑜𝑟𝑟𝑒𝑐𝑡𝑒𝑑=
0.01;𝑅=0.47), DAN (𝑝𝐵𝑜𝑛𝑓𝑒𝑟𝑟𝑜𝑛𝑖𝑐𝑜𝑟𝑟𝑒𝑐𝑡𝑒𝑑=0.006;𝑅=0.491) and AUD+VIS (𝑝𝐵𝑜𝑛𝑓𝑒𝑟𝑟𝑜𝑛𝑖𝑐𝑜𝑟𝑟𝑒𝑐𝑡𝑒𝑑=0.0003;𝑅=0.57) obtained in the
al-phaband.Inthebetaband,resultsshowpositivecorrelationsbetween visual imagery and the FO of AUD+VIS and DAN (see Figure S3). Resultswerealsoconsistentacrossotherthresholdvalues(seeFigure S2).
Insummary,theseresultsshowedthatindividualvariabilityinthe visualimageryexperiencedduringacquisitionwaspositivelyrelatedto theoccupancyofspecificmodules,mainlyVIS,DANandVIS+AUD.
3. Discussion
Here,wehaveshownhowfastchangesinthemodulararchitecture oflarge-scaleelectrophysiologicalnetworksshapespontaneousbrain ac-tivity.Weusedarecentlydevelopedalgorithmthatextractsrepetitive modularbrainstatesalternatingovertime.Asopposedtotraditional ap-proaches,thedistinctivefeatureoftheappliedmethodresidesin track-ingmodularvariationsofbrainnetworks.Theframeworkwasapplied onthreeindependentEEG/MEGdatasets,andrevealedthatRSNs expe-riencecontinuousmodularchangesreflectedbyaprocessofseparation andmergingwithin-andbetween-therestingnetworks.
Inparticular,DMN switchesdynamicallyitsmodulartopology,in linewith many previous studiessuggesting that theDMN can actu-allybedecomposedintosubcomponents,mainlyanteriorandposterior (Andrews-Hannaetal.,2007;Moussaetal.,2011;Wensetal.,2019). Theprocessof associationanddissociationwithinDMN components wasalsorevealedbyAllenetal.(E.A.Allenetal.,2014),wherebrain statesweredescribedusingK-meansclustering.Moreimportantly,
sev-eralstudieshavealsoshowedthatthedynamicstatestransitionleads totheinclusionofsomeFPNregionsintheDMNinsomebrainstates (E.A.Allenetal.,2014;Liuetal.,2019),whichwasalsoobtainedin ourstudy(resultsofdataset1).Similarly,thetemporalnetwork alter-natesitsreconfigurationbetweenleft,rightandcompletemodules.This findingisinlinewithpreviousresultsdepictingtheleftpartofthe tem-poralnetworkasanindependentnetworkstate(Baker etal., 2014). Thedynamicmodularbehavioroftherestingbrainwasalsorevealed bytheoccurrenceofmodulesintegratingdifferentRSNs.Forinstance, the DAN expandsdynamically its networkto includevisual compo-nents.Thedynamicinclusionofthese networksreflectsthepresence ofahighcorrelationbetweenthem,whichwassupportedinprevious studies(E.A.Allenetal.,2014;Liuetal.,2019).
Our findingsagreewithpreviousstudiessuggesting thatdynamic changesinbrainnetworksarepresentduringspontaneousactivity.As an example, (Zalesky et al., 2014) showed that some brain regions aretransmodal(i.e.,connectedtodifferentrestingstatenetworksover time).Theseregionsarehighlydynamicandchangetheirmodular af-filiationover time.Asimilarobservationwasobtained inaprevious studywherehubsdynamicallyalternateitsrolebetweenprovincialand connector(Kabbaraetal.,2017).Thisdynamicprocessofsplittingand mergingthedifferentsub-systemsduringtimeallowsthebrainto bal-ancesegregatedandintegratedneuraldynamics.Totestwhetherthere maybeasortofhierarchyintermsoftheconsistencyofbrainregions, wealsoreported,foreachRSN,theregionsincludedandtheir contribu-tionsacrosssubjectsofalldatasets(in%).Onceamodulewasassociated toaspecificRSN,theoverlappingnodeswereidentifiedtoultimately computetherateoftheirinclusionacrossallsubjectsanddatasets. Fig-ure S1shows thatdespitetheinter-subject variability,some specific brainregionscontributemoreconsistentlytoaspecificRSNthanothers. TheDMN(initsdifferentconfigurations) wasthemost consistent moduleobtainedacrosssubjects,sinceithadthehighestpercentageof
A. Kabbara, V. Paban and M. Hassan NeuroImage 227 (2021) 117674
Fig.5. Results of a typical subject. (A) dynamic fluctuation of the 8 modular states extracted for this specific subject, (B) spatial representation of all modules derived from each MS. (C) similarity matrix between all MSs modules and RSN templates (for simplicity, only RSNs showing an overlap greater than 80% with one of the modules were mentioned), ∗ marks the overlap values higher than 80%. (D) dynamic fluctuations of modules surviving the 80% overlap threshold and associated to RSN templates. These modules are color-coded according to the corresponding RSNs (shown on the right of Fig.5.C).
A. Kabbara, V. Paban and M. Hassan NeuroImage 227 (2021) 117674
Fig.6. Violin plots showing fractional occupancy and mean dwell time of derived modules obtained for (A) Dataset1, (B) Dataset2 and (C) Dataset3. The horizontal dashed line that appears in each plot denotes the mean plus two standard deviations. ∗ mark significant modules (average >mean value + 2 standard deviations).
A. Kabbara, V. Paban and M. Hassan NeuroImage 227 (2021) 117674 presenceoversubjects/datasets,withthehighfractionaloccupancy
val-ues.ThesefindingshighlightthekeyroleofDMNinintegrating infor-mationinspontaneousbrainactivity,inaccordancewiththepresence ofalargeproportionofhubsassociatedtothisnetwork(dePasquale etal.,2015;Kabbaraetal.,2017;vandenHeuvelandSporns,2013). Furthermore,DMNconfigurationshadthegreateststabilityovertime (reflectedbythehighestmeandwellduration).Suchfindingssupport previousstudiesshowingthatfunctionalconnectionswithinthe rich-clubcore(wheremostregions areaffiliatedtotheDMN)exhibitthe greateststabilityovertime.Inthesestudies,thehightemporal stabil-ityofDMNhasbeenassociatedwithhighdependencyonthe under-lyingstructuralbraintopology,sincehighsimilaritywasobtained be-tweenresting-statefunctionalandstructuralnetworkswhenthe sam-ple duration increases. In contrast to this, modules with low dwell timeweretransientandexhibitedgreatestvariabilityduringtime re-flecting the dynamic functionalcoordination. In our study, the de-rivedtransientmodulesdependoneachsubjectanddatabase.Mostly, theybelongtohigh-levelcognitivenetworks,attentionalnetworksand thesensorynetworks.Inalldatabases,thesetransientmodules show-ingsignificantlowerdwelltimesarethoseintegratingmultipleRSNs (DAN+VIS,AUD+VIS…).Onepossibleexplanationis thatindividuals dynamicallyengageinseveralmentalthoughtsduringrestingperiods, whileimageryandmind-wanderingremainthepredominantactivities (Delamillieureetal.,2010;Doucetetal.,2012).Thus,theperspectiveof lookingatthebrainasadynamicsystemwherestableactivityis inter-twinedbytransientfunctionalvariabilitiesissupportedbymanystudies (Honeyetal.,2007;Liuetal.,2019;VanDeVilleetal.,2010).
Inaddition,ourstudyhighlightsthesignificantpresenceofthe vi-sualnetworkshowing ahighoccupancy rateduringtime(resultsof datasets1and2).Suchobservationcanbeassociatedwiththe domi-nanceofthevisualimageryactivityexhibitedbymostsubjectsduring restingstateacquisition(Delamillieureetal.,2010).Moreinterestingly, theindividualvariabilityinthevisualimageryexperiencedduring ac-quisitionwasrevealedtobepositivelycorrelatedtothefractional oc-cupancyofVISnetwork(Fig.7).Similarcorrelationswerereportedby previousstudies(Pipinisetal.,2017;Stoffersetal.,2015).Inaddition, thesignificantrelationshipsassessedbetweenthementalimagerywith AUD,DANandVISmightexplainthecross-interactionsobserved be-tweenthesenetworksformingonelargemoduleovertime(thepresence ofDAN+VIS+AUDobservedintheresultsofdataset1,Fig.2).
Acrossthethreedatasets,ourresultsshowed9commonRSNs:DMN, POST-DMN,VIS,SMN,SAN,LTEMP,VIS+AUD,DAN+VIS.These strik-ingconsistentresultshavebeenobtainedindependentlyfromthe tech-niqueusedtorecordsignals(EEGorMEG),preprocessingsteps (auto-maticindataset1vs.manualin dataset2and3),source reconstruc-tion(wMNEvs.Beamforming),adjacencymatricesthresholdingvalue, EEG/MEGfrequencybands(alphavs.beta),atlasparcellation(68 De-sikanKillianyvs78AAL)andfunctionalconnectivitymeasures(phase vs.envelopecouplings),aswellaseitherwithorwithoutcorrectingthe zero-lagcorrelations.
However,othermodulesarisefromeachdataset(Figs.2,3,4).The inter-subjectvariabilitywasalsorevealedbythepercentageofsubjects showingeachderivedmodule.Amongthesamedataset,these individ-ualdifferencesarethoughttobeassociatedwithvariabilityincognitive andbehavioralfunctions.Thishasbeensupportedbydifferentstudies showingthatthedynamicnetworkcharacteristicssignificantlycorrelate withintelligence,creativityandexecutivefunction(Bassettetal.,2015; Kenettetal.,2020;Tompsonetal.,2018).Here,between-subjects varia-tioninthetemporalcharacteristicsofspecificmodules,mainlyVIS,AUD andDAN,wasassociatedwithself-reportratingofmentalvisualimagery asmeasuredbytheresting-statequestionnaire.Thedependenceof ob-servedbrainactivityontheinnerthoughtsandfeelingexperienced dur-ingrestingacquisitionwasemphasizedbymultiplestudies(Diazetal., 2016;Pipinisetal.,2017;Stoffersetal.,2015).
Despite the overall consistency of our findings, results over the three datasets were not perfectly the same. Forinstance, the DMN
were present 96%,98% and 100% over dataset 1, 2and 3 respec-tivelywhiletheVISnetworkwaspresent86%,94%and88%.Also re-sultsshowedtheabsenceoftheANT-DMNindataset3,theabsenceof FPNindataset2and3andtheabsenceofCCNindataset1.The dis-crepancyofresultsobtainedfromdifferentdatasetsmayberelatedto some differencesin thedatasets suchasthesamplesize,ageof sub-jectsandtheconditionsofexperiments(i.e.eyesclosed/eyesopened). Infact,whileRSNshavebeensuccessfullyextractedinbotheyes-opened (E.A.Allenetal.,2014;Bakeretal.,2014;dePasqualeetal.,2018) andeyes-closedconditions(Bernasetal.,2018;Kabbaraetal.,2017; Owenetal.,2013),manystudieshavebeenconductedtoinvestigate the functionalconnectivity differences in RSNs between eyesclosed andeyesopenedconditions(Agcaogluetal.,2019;Patriatetal.,2013; VanDijketal.,2010;Yanetal.,2009).Ourresultsondataset3 (ac-quiredineyesopenedcondition)showingthehighestDMNoccurrence (100%)amongotherdatasets(acquired ineyesclosedcondition)can be relatedwiththestudiesrevealinghigherDMN functional connec-tivity in the eyes opened as compared tothe eyesclosed condition (VanDijketal.,2010;Yanetal.,2009).Anadditionalcauseforthe discrepancyofresultsbetweendatasetsistheuseofdifferent modali-ties(MEG/EEG).Moreprecisely,MEG/EEGdifferencesprovedtoarise particularlywheninvestigatingtransientresting-statefunctional con-nectivitypatterns(Coqueletetal.,2020).
Therelevanceof thealphatobetafrequencyrange(8–30Hz)in drivingspontaneouslarge-scaleneuronalinteractionswasrevealedby multiple EEG/MEGstudies(Brookesetal., 2011; dePasqualeetal., 2015; Hipp et al., 2012; Kabbara et al., 2017; Liu et al., 2010). Since correlation patterns dependon the underlying oscillation fre-quency(Brookesetal.,2011;Hippetal.,2012;Vidaurreetal.,2018), we have verifiedthereproducibilityof theobtained results in these two frequency bands. Themainconclusions of thestudyremain in-tact (see Table S4, Table S5, Table S6, FigureS3): i) distinct mod-ulesconcordant withthewell-knownRSNsfluctuateduringtime, ii) the default mode networkis detected as themost consistent, dom-inant and stable module which dynamically alternates its modular topology, iii) modules thatcombine several RSNs areobserved dur-ingtime, reflectingcross-networkinteractions suchasDAN-VIS, and iv) significant positive correlation was revealed between the frac-tionaloccurrencesofsomespecificmodulesandthementalimagery. Nevertheless, slight differences were observed in the derived mod-ules and their temporal characteristics between the two frequency bands.
Fromamethodologicalviewpoint,wehaveadoptedineachdataset thepipeline(fromdataprocessingtonetworksconstruction)usedby thepreviousstudiesdealingwiththesamedatasets.Therefore,forEEG datasets,weusedthewMNE/PLVcombinationtoreconstructdynamic networks,sinceitissupportedbyseveralstudiesonrestingEEGand twocomparativestudies(Hassanetal.,2016;M.2014).FortheMEG dataset,beamformingconstructioncombinedwithamplitude correla-tion(andorthogonalization)betweenband-limitedpowerenvelopswas usedbymultiplestudiesusingtheMEGHCPdata(Brookesetal.,2012; Colcloughetal.,2015).Thesuitablewindow widthisacrucialissue inreconstructingdynamicfunctionalnetworks.Ontheonehand,short windowsdonot containsufficientinformationtoaccuratelyestimate connectivity.Ontheotherhand,largewindowsmightfailtocapturethe temporalchangesofbrainnetworks.Hence,theidealistochoosethe shortestwindowthatguaranteesasufficientnumberofdatapointsover whichconnectivityiscomputed.Thisdependsonthefrequencybandof interestthataffectsthedegreeoffreedomintimeseries.Italsodepends onthecorrelationmeasureused.InEEGdatasets,weadoptedthe recom-mendationofLachauxetal.(Lachauxetal.,2000)inselectingthe small-estappropriatewindowlengthoffering6numberof‘cycles’atthegiven frequencyband.Thereproducibilityofrestingstateresultswhilst chang-ingthesizeof thesliding windowwasvalidatedin apreviousstudy (Kabbaraetal.,2017).InMEG,weusedthesamecorrelationmethod withthecorrespondingslidingwindowsize(0.5s)usedinprevious
stud-A. Kabbara, V. Paban and M. Hassan NeuroImage 227 (2021) 117674 iesdealingwiththesamedataset(Colcloughetal.,2016a;O’Neilletal.,
2017b).
WhileEEG/MEGmodalitiespresentakeyadvantagefortracking dy-namicbrainprocessesinthetimeframeinwhichtheseprocessesoccur (namelyinthesub-secondrange),theyarelimitedintermsofspatial coverage.Basically,themaincauseofthispoorspatialresolutionisthe “volumeconduction” problemwhichdistortssignals,inducing,ateach scalpposition,amixtureeffectoftheunderlyingsources.Readersmay referto(SchoffelenandGross,2009)formoredetailsaboutthisissue. AlthoughtheEEG/MEGsourceconnectivitymethodcontributesto en-hancethespatialresolutionbyreducingtheeffectsofthevolume con-ductionproblem,itremainsunabletocompletelyremovesource leak-ageeffects(HassanandWendling,2018).Moreprecisely,itisdifficult topinpointtheactivityoriginatingfrom distinctbutcloselyadjacent sources.Forthis reason,in ourstudy,we avoidedtheuseof ahigh numberofROIs.Thus,weused68anatomicalROIsinEEGdatasets, and78ROIsinMEGdatasetasdoneinpreviousresting-statestudies showedthattheseROIsaresufficientinextractingtheglobal charac-teristicsofthebrainnetworkswithacceptablespatialresolutionwhile minimizingtheproblemof spuriousconnectionsbetween“veryclose sources” (Kabbaraetal.,2017).TheDesikan_Killianyatlas(68ROIs) wasalsousedtoextractusefulinformationfocusingoninvestigatingthe “large-scale” networksderivedfromspontaneousactivityinthecontext ofpersonalitytraits(AyaKabbaraetal.,2019),andbraindisorders(A. Kabbaraetal.,2018).Inaddition,wehavelimitedoursourcespaceto thecortexwithoutincludingsub-corticalstructures.
Inthisstudy,weusedaproportionalthreshold(highest15%ofthe edge’sweights)toremoveweakconnections.Thestabilityof network-basedfeaturesacrossproportionalthresholdswasindeedsupportedby (Garrisonetal.,2015)incontrarytoabsolutethresholds.Inaddition, applyingaproportionalthresholdisimportanttoensureequaldensity betweennetworksderivedfromdifferenttimewindowsandsubjects. Nevertheless,andinordertoensurethattheobtainedresultsarenot sensitivetothethresholdvalue,weperformedouranalysisacrossthree proportionalthresholds:5%,15%,30%.Highagreementamongthe ob-tainedresultswasfound,seeSupplementaryMaterials(TableS1,Table S2,TableS3,FigureS2).
To extract the fast transient modules, we have applied the modularity-basedalgorithmthatextractsthemainmodularbrainstates fluctuatingovertime(A.Kabbaraetal.,2019).Otherstrategiesaiming atidentifyingtheconnectivitystatesexistsuchasK-meansclustering, ICA andPCAfor instance.However,in theseframeworks,statesare identifiedwithout consideringthemodularorganizationofnetworks. Instead,thealgorithmusedinthepresentstudyperformsits segmenta-tionbylookingatthebrainasadynamicmodularnetwork.Ina pre-viousstudy,aquantitativecomparisonusingsimulateddatawas per-formedbetween themodularity-based algorithm, K-means clustering (E.A.Allenetal.,2014),independentcomponentanalysis(O’Neilletal., 2017b)andtheconsensusclustering(Raseroetal.,2017),anditwas shownthattheframeworkusedhereoutperformedtheothertechniques intermsofspatialandtemporalaccuracy.
4. Materialsandmethods 4.1. EEGdatasets
4.1.1. Dataset1(HBN)
4.1.1.1. Participants. As part of the Healthy Brain Network (HBN) Biobankrelease1(Alexanderetal., 2017)http://fcon_1000.projects. nitrc.org/indi/cmi_healthy_brain_network/sharing_neuro.html, resting-state EEG data were collected from 444 healthy subjects (239 fe-male). The release originally included 603 subjects, but data from 159subjectswererejectedafterpre-processingandvisualinspection. Subjects arehealthyandagedbetween 5and21 years old.The Ids of the 444 participants are listed in Table S7 (see Supplementary materials).
4.1.1.2. Dataacquisitionandpre-processing. High-densityEEGdataare recordedinasound-shieldedroomatasamplingrateof500Hzwitha bandpassof0.1to100Hz,usinga128-channelEEGgeodesichydrocel systembyEGI.TherecordingreferenceisatCz(vertexof thehead). Theimpedanceofeachelectrodeischeckedpriortorecording,to en-suregoodcontact,andiskeptbelow40kOhm.EachEEGsession con-sistedof5minrestingperiod(ineyes-closedcondition).Asprovided bytheHBN,EEGsignalswerepreprocessedusingAutomagicMatlab toolbox(Pedronietal.,2019),visualinspectionwasalsodoneonthe dataafterautomaticpreprocessing.Briefly,itconsistsofinterpolating thenoisy,flatoroutlierchannels.TheMultipleArtifactRejection Al-gorithm(MARA)whichautomatizestheprocessofindependent compo-nentanalysis(ICA)wasusedtodetectandrejectartifactssuchasthe eyeblinksandthemovementartifacts(Winkleretal.,2011).Then,four artifact-freeepochs of40-slengthwereselectedforeachparticipant. Thisepochlengthwasusedinapreviousstudy,andwasconsideredas agoodcompromise betweentheneededtemporalresolutionandthe resultsreproducibility(Kabbaraetal.,2017).
4.1.2. Dataset2
4.1.2.1. Participants. Atotalof56healthysubjectswererecruited(29 female).Themeanagewas34.7yearsold(SD=9.1years,range=18– 55).Educationrangedfrom10yearsofschoolingtoaPhDdegree.None ofthevolunteersreportedtakinganymedicationordrugs,norsuffered fromanypastorpresentneurologicalorpsychiatricdisease.Thestudy wasapprovedbythe“Comité deProtectiondesPersonnesSud Méditer-ranée” (agreementn° 10–41).Samedatawereusedinpreviousstudies ((Kabbaraetal.,2020)AyaKabbaraetal.,2019;Pabanetal.,2019). AfterEEGacquisition,allparticipantshavecompletedtheresting-state questionnaire(ReSQ).Thislatterconsistsof62itemsorganizedbyfive maintypesofmentalactivity:visualmentalimagery,innerlanguage, somatosensoryawareness,innermusicalexperience,andmental manip-ulationofnumbers(Delamillieureetal.,2010).Usingascaleranging from0to100%,eachparticipantratedthepercentageoftimespentin eachmentalactivityduringtheresting-stateEEGacquisition,suchthat thetotalscoreforthefivetypesofactivitiesequaled100%.
4.1.2.2. Dataacquisitionandpreprocessing. EachEEGsessionconsisted ina10-minrestingperiodwiththeparticipant’seyesclosed.Participants wereseatedinadimlylitroom,wereinstructedtoclosetheireyes,and thentosimplyrelaxuntiltheywereinformedthattheycouldopentheir eyes.Participantswereinformedthattherestingperiodwouldlast ap-proximately10min.Theeyes-closedrestingEEGrecordingsprotocol waschosentominimizemovementandsensoryinputeffectson electri-calbrainactivity.EEGdatawerecollectedusinga64-channelBiosemi ActiveTwosystem(BiosemiInstruments,Amsterdam,TheNetherlands) positionedaccordingtothestandard10–20systemmontage,one elec-trocardiogram, andtwobilateralelectro-oculogramelectrodes (EOG) for horizontal movements.Nasion-inionandpreauricular anatomical measurementsweremadetolocateeachindividual’svertexsite. Elec-trodeimpedanceswerekeptbelow20kOhm.Thepre-processingwas addressed usingthesamepreprocessingstepsasdescribed inseveral previousstudiesdealingwithEEGresting-statedata(AKabbaraetal., 2018,2017).Briefly,badchannels(signalsthatareeithercompletely flatorcontaminatedbymovementartifacts)wereidentifiedbyvisual in-spection,complementedbythepowerspectraldensity.Thesebad chan-nelswerethenrecoveredusinganinterpolationprocedureimplemented in Brainstormbyusingneighboringelectrodes within a5-cmradius. Epochs withvoltagefluctuationsbetween +80𝜇V and−80𝜇V were kept.Fourartifact-freeepochsof40-slengthwereselectedforeach par-ticipant.
4.1.3. Dynamicbrainnetworksconstruction
For the two EEG datasets, dynamic brain networks were recon-structed using the “EEG source connectivity” method (Hassan and Wendling,2018)combinedwithaslidingwindowapproachasdetailed
A. Kabbara, V. Paban and M. Hassan NeuroImage 227 (2021) 117674 in(A.Kabbaraetal.,2018,2017).“EEGsourceconnectivity” involves
twomain steps: i) solvingthe inverseproblem in order toestimate thecorticalsourcesandreconstructtheirtemporaldynamics,andii) measuringthefunctionalconnectivitybetweenthereconstructed time-series.
Briefly,thestepsperformedwerethefollowing:
1 EEGs and MRI template (ICBM152) were coregistered through the identification of anatomical landmarks by using Brainstorm (Tadeletal.,2011).
2 A realistic head model was built using the OpenMEEG (Gramfortetal.,2010)software.
3 ADesikan-Killianyatlas-basedsegmentationapproachwasusedto parcellatethecorticalsurfaceinto68regions(Desikanetal.,2006). 4 The weighted minimum norm estimate (wMNE) algorithm was used to estimate the regional time series (Hamalainen and Il-moniemi,1994).
5 Thereconstructedregionaltimeserieswerefilteredinalpha8–13Hz andbeta13–30Hzfrequencybands,showntobethemostinvolved frequencybandsatrest.
6 Tocomputethefunctionalconnectivitybetweenthereconstructed regionaltime-series,weusedthephaselockingvalue(PLV)metric (Lachauxetal.,2000)definedbythefollowingequation:
𝑃𝐿𝑉(𝑡)=|||| | 1 𝛿 𝑡+𝛿∕2 ∫ 𝑡−𝛿∕2𝑒𝑥𝑝(𝑗 ( 𝜑𝑦(𝑡)−𝜑𝑥(𝑡))𝑑𝜏|||| | (1)
where𝜑𝑦(𝑡)and𝜑𝑥(𝑡)aretheunwrappedphasesofthesignalsxandy
attimet.TheHilberttransformwasusedtocomputetheinstantaneous phaseofeachsignal.𝛿 denotesthesizeofthewindowinwhichPLV iscalculated.Dynamicfunctionalconnectivitymatriceswerecomputed foreach epochusinga slidingwindow technique(A.Kabbaraetal., 2018,2017).Itconsistsinmovingatimewindowofcertainduration 𝛿 alongthetimedimensionof theepoch,andthenPLViscalculated withineachwindow.Asrecommendedby(Lachauxetal.,2000),the numberofcyclesshouldbesufficienttoestimatePLVinacompromise betweenagoodtemporalresolutionandagoodaccuracy.Thesmallest numberofcyclesrecommendedequalsto6.Forinstance,inthealpha band,wechosethesmallestwindowlengthof571msthatisequalto
6 𝑐𝑒𝑛𝑡𝑟𝑎𝑙𝑓𝑟𝑒𝑞𝑢𝑒𝑛𝑐𝑦.
1 Toensureequalnetworkdensityforallthedynamicnetworks com-putedacrosstime,aproportional(density-based)thresholdwas ap-pliedinawaytokeepthetop15%ofconnectivityvaluesineach network.
4.2. MEGdataset(HCP) 4.2.1. Participants
AspartoftheHCPMEG2release(VanEssenetal.,2012), resting-state MEG recordings were collected from 61 healthy subjects (38 women).Thereleaseincluded67subjects,butsixsubjectswere omit-tedfromtheanalysisastheirrecordingsfailedtopassthequality con-trolchecks(includingtestsforexcessiveSQUIDjumps,sensiblepower spectra,correlationsbetweensensors,andavailabilityofsufficientgood qualityrecordingchannels).Allsubjectsareyoung(22–35yearsofage) andhealthy.
4.2.2. MEGrecordingsandpre-processing
Theacquisitionwas performedusing awhole-headMagnes 3600 scanner(4DNeuroimaging,SanDiego,CA,USA).Restingstate measure-mentsweretakeninthreeconsecutivesessionsof6mineach.During thescanthesubjectisinstructedtorelaxwitheyesopenandmaintain fixationonaprojectedcrosshairpresentedonadarkbackground.Data wereprovidedpre-processed,afterpassingthroughapipelinethat re-movedartefactualsegments,identifiedfaultyrecordingchannels,and regressedoutartefactswhichappearasindependentcomponentsinan ICAdecompositionwithclearartefactualtemporalsignatures(suchas eyeblinksorcardiacinterference).
4.2.3. Dynamicbrainnetworksconstruction
Here,weadoptedthesamepipelineused bytheprevious studies dealingwiththesamedataset(Colcloughetal.,2015).Thus,tosolve theinverseproblem,wehaveappliedalinearlyconstrainedminimum variance beamformer(Van Veen et al., 1997).Pre-computed single-shellsourcemodelsareprovidedbytheHCPandthedatacovariance werecomputedseparatelyinthe1–30Hzand30–48Hz bandsasin (Colcloughetal.,2016b).Datawerebeamformedontoa6mmgrid us-ingnormalizedleadfields.Then,sourceestimateswerenormalizedby thepoweroftheprojectedsensornoise.Sourcespacedatawerefiltered inalpha(8–13Hz)andbetabands(13–30Hz).Afterobtainingthe re-gionaltimeseriesonthebasisoftheAutomatedAnatomicallabeling atlas(AAL)(Tzourio-Mazoyeretal.,2002),asymmetric orthogonaliza-tionprocedure(Colcloughetal.,2015)wasperformedforsignalleakage removal.Toultimatelyestimatethefunctionalconnectivitybetween re-gionaltimeseries,weusedtheamplitudeenvelopecorrelationmeasure (AEC)(Brookesetal.,2012).Thismethodbrieflyconsistsof1) com-putingthepowerenvelopesasthemagnitudeofthesignal,usingthe Hilbert transform,and2)measuringthelinearamplitudecorrelation betweenthelogarithmsofROIpowerenvelopes.Finally,asliding win-dow(length=6s,step=0.5s)wasappliedtoconstructthedynamic connectivitymatrices.Thisslidingwindowhasbeenpreviouslyusedto reconstructthedynamicnetworksderivedfromMEGdata(O’Neilletal., 2017a).Also,matriceswerethresholdedbykeepingthestrongest15% connectionsofeachnetwork.
4.3. Extractingmodularbrainstates
Modularityreferstotheextenttowhichanetworkcanbeseparated intomodulesorcommunitieshighlyintra-connectedandweakly inter-connected(SpornsandBetzel,2016).Totrackthetransientchangesof thebrainmodularnetworksovertime, weusedourrecentproposed algorithm(A.Kabbaraetal.,2019)thataimstoextractthemain modu-larstructures(i.e.modularstates)thatfluctuaterepetitivelyacrosstime. Eachmodularstatereflectsuniquespatialmodularorganization.Briefly, thealgorithmconsistsofapplyingthefollowingsteps:
•Decomposeeachtemporalnetworkintomodules.Asdifferent mod-ularityalgorithmmayleadtodifferentmodules(duetothedegeneracy problem),weaimedtoCombinetheresultsofthecommonlyused mod-ularityalgorithms:Girvan-Newman (GirvanandNewman,2002) and Louvain algorithm(Blondel etal.,2008).Each modularityalgorithm wasalsorepeatedfor200iterations,asweareawarethatthe degener-acyproblemispresentacrossdifferentruns.Thisprocesswillresult,for eachnetwork,in400modularorganizations(200runsx2algorithms). Todefinethefinalmodularorganization,weperformedtheconsensus algorithmproposedby(Bassettetal.,2013)whichconsistsof comput-inganassociationmatrixofNxN(whereNisthenumberofnodes) bycountingthenumberoftimestwonodesareassignedtothesame moduleacrossthe400modularorganizationsobtainedacrossthe200 runsandthetwomodularityalgorithms.Theassociationmatrixisthen comparedtoanullmodelassociationmatrixcomputedfromrandom permutationsoftheoriginalpartitions.Afterthiscomparison,onlythe significantvaluesoftheassociationmatrixwereretained.The thresh-oldedassociationmatrixwasfinallyclusteredusingLouvainalgorithm repeatedfor100iterations.Theconsensusapproachappliedonthe as-sociationmatrixwasrobustacrossmultiplerunsleadingtoaverylow qualityofconsensus.
•Assessthesimilaritybetweenthetemporalmodularstructures us-ingthez-scoreofRandcoefficient,avaluebetween0(totallydifferent structures)and1(identical structures)asproposedby (Traud etal., 2008).ThisstepgeneratedaTxTsimilaritymatrixwhereTisthe num-beroftimewindows.
•Clusterthesimilaritymatrixintomodularstates(MS)using the consensusmodularitymethod.Thisstepassociatescommontemporal modularstructuresintothesamestate.Hence,asinglecommunity struc-turewasderivedfromeachMS.Thiswasdonebyforminganassociation
A. Kabbara, V. Paban and M. Hassan NeuroImage 227 (2021) 117674 matrixfromthetemporalmodularaffiliationscorrespondingtotheMS
followedbyapplyingtheconsensusalgorithmontheobtained associa-tionmatrix.
4.4. ExtractthemodulesassociatedwithRSNs
Ourobjectiveistocharacterizethedynamicbehaviorofspontaneous brainnetworksintermsofmergingandsplittingacrossandwithin rest-ingstatenetworks.Forthisreason,weevaluatedthedegreeof resem-blancebetweeneachmodule(derivedfromalltheMSs)andtheRSNs. Todothat,weformeddifferentmasksortemplates;whereeachmaskis relatedtoaRSN,asubpartofaRSNoracombinationbetweendifferent RSNs.Then,anoverallmatchforeachmodulewitheachtemplate is calculated.Iftheoverlapbetweenthemoduleandatemplateishigher than80%,themoduleisultimatelyassociatedtotheconsidered tem-plate.Thisoverlapiscalculatedusingthefollowingformula:
𝑂𝑣𝑒𝑟𝑙𝑎𝑝𝑚,𝑅𝑆𝑁= 𝑁𝑐𝑜𝑚𝑚𝑜𝑛
2∗𝑁1 +
𝑁𝑐𝑜𝑚𝑚𝑜𝑛
2∗𝑁2 (2)
Where𝑁𝑐𝑜𝑚𝑚𝑜𝑛isthenumberofcommonnodesbetweenthemodule mandtheRSN,𝑁1isthetotalnumberofnodesinthemodulem,𝑁2 isthetotalnumberofnodesintheRSN.
ThedefinitionoftheRSNtemplatesweremainlybasedonaprevious studydescribedbyShireretal.(Shireretal.,2012)inwhichfunctional networkswereidentified:(anterior/posteriorsaliencenetwork,auditory network,dorsal/ventraldefaultmodenetwork,higher/primaryvisual network,languagenetwork,left/rightexecutivecontrolnetwork..).We alsoaddedotherRSNsbasedonpreviousfunctionalresting-state stud-ies:left/righttemporal networks andthedorsal attentional network (Allenetal.,2017;E.A.2014;Bakeretal., 2014; Damoiseauxetal., 2006;FoxandRaichle,2007;Greiciusetal.,2003).SeeTableS8inthe supplementalmaterialfortheRSNsdefinition.
Thisstepaimstostandardizetheextractedcommunitiesas “proto-typenetworks(i.e.RSNs)” whichallowsanalyzingtheconsistencyof thederivedmodulesatthegroup-levelandvalidatesthesinglesubject results.
4.5. Quantification
ForeachmodulerevealedtobeassociatedtoanRSNtemplate,two metricswerecomputed:
1 Thetemporalfractionaloccupancy(FO)whichrepresentsthetotal timespentbyeachmoduleasmeasuredbypercentage.Thus,ahigh valueofFOreflectshightemporaldominanceofthemodule. 2 Themeandwelltime(DT)definedastheaveragenumberof
con-secutivewindowsspentinaspecificmodule.Amodulewithahigh DTisthusconsideredasastableor“steady” module,comparedto moduleswithlowDTthatareconsideredas“transient” modules. 4.6. Statisticaltests
Inordertoinvestigatewhethertheobservedbrainmodulesare re-latedtosubjectiveinternal thoughtsandfeelingsexperiencedduring resting-stateacquisition,wehaveassessedthestatisticalrelationships betweentheoccurrenceof modulesandthephenotypes ofcognition measuredbytheResting-StateQuestionnaire(rsQ).Morespecifically, Pearson’scorrelationbetweenthefivemainindicesderivedfromthe rsQ(i.e.visualmentalimagery,innerlanguage,somatosensory aware-ness,innermusicalexperience,andmentalmanipulationofnumbers) andthefractionaloccupanciesofthederivedmoduleswerecomputed forthe57participantsprovidedbyDataset2.Toconsiderthemultiple comparisonsproblem(betweenthefivetypesofmentalactivity,and the11 modules),p-valueswerecorrectedusingBonferroniprocedure (BlandandAltman,1995)yieldinganadjustedthresholdof𝑝<0.0009.
Codeavailability
Data pre-processing was done using automagic Matlab toolbox https://github.com/methlabUZH/automagic (Pedronietal.,2019)for dataset 1. Brainstorm toolbox (Tadel et al., 2011) was used to pre-processthesignalsofdataset2,andtoreconstructtheregionaltime seriesusingwMNE.Toestimatetheheadmodel,OpenMEEG(Gramfort et al., 2010) software was used. Brain Networks estimation of EEG data(datasets1,2)wasdoneusingMatlab.Beamformingconstruction andnetworksestimationofMEGdata(dataset3)wasperformedusing themegconnectomepipelinepackagehttps://www.humanconnectome. org/software/hcp-meg-pipelines.TheMatlabcodedevelopedtoextract themodularbrainstatesis publiclyavailableathttps://github.com/ librteam/Modularity_algorithm_NN.BrainNetViewer(BNV)(Xiaetal., 2013)https://www.nitrc.org/projects/bnv/ wasusedfornetworks vi-sualization.Otherhomemadecodeswerealsodevelopedforstatistical tests,andquantitativeevaluation.
Dataavailability
Thedatausedhereareallavailable.Thedataset1canbefoundon http://fcon_1000.projects.nitrc.org/indi/cmi_healthy_brain_network/ sharing_neuro.html, the dataset 2 can be available upon a simple requesttothecorrespondentauthorandthedataset3isavailableon https://db.humanconnectome.org/.
Creditauthorstatement
Aya Kabbara: Conceptualization, Methodology, Software, Writ-ing,Originaldraftpreparation.MahmoudHassan:Conceptualization, Methodology, Writing,Supervision, Funding acquisition. Veronique Paban:Datacollection(dataset3),Resources.
Acknowledgments
ThisworkwasfinancedbytheRennesUniversity,theInstituteof ClinicalNeuroscienceofRennes(ProjectnamedEEGCog).Thestudywas alsofundedbytheNationalCouncilforScientificResearch (CNRS)in Lebanon.TheauthorswouldalsoliketothanktheLebaneseAssociation forScientificResearch(LASER)andCampusFrance,ProgrammeHubert CurienCEDRE(ProjectNo.42257YA),forsupportingthisstudy.
Supplementarymaterial
Supplementarymaterialassociatedwiththisarticlecanbefound,in theonlineversion,at10.1016/j.neuroimage.2020.117674.
References
Agcaoglu, O., Wilson, T.W., Wang, Y.P., Stephen, J., Calhoun, V.D., 2019. Resting state connectivity differences in eyes open versus eyes closed conditions. Hum. Brain Mapp. doi: 10.1002/hbm.24539 .
Alexander, L.M., Escalera, J., Ai, L., Andreotti, C., Febre, K., Mangone, A., Vega-Potler, N., Langer, N., Alexander, A., Kovacs, M., Litke, S., O’ Hagan, B., Andersen, J., Bron- stein, B., Bui, A., Bushey, M., Butler, H., Castagna, V., Camacho, N., Chan, E., Cit- era, D., Clucas, J., Cohen, S., Dufek, S., Eaves, M., Fradera, B., Gardner, J., Grant- Villegas, N., Green, G., Gregory, C., Hart, E., Harris, S., Horton, M., Kahn, D., Kabotyanski, K., Karmel, B., Kelly, S.P., Kleinman, K., Koo, B., Kramer, E., Lennon, E., Lord, C., Mantello, G., Margolis, A., Merikangas, K.R., Milham, J., Minniti, G., Neuhaus, R., Levine, A., Osman, Y., Parra, L.C., Pugh, K.R., Racanello, A., Restrepo, A., Saltzman, T., Septimus, B., Tobe, R., Waltz, R., Williams, A., Yeo, A., Castellanos, F.X., Klein, A., Paus, T., Leventhal, B.L., Craddock, R.C., Koplewicz, H.S., Milham, M.P., 2017. Data descriptor: an open resource for transdiagnostic research in pediatric men- tal health and learning disorders. Sci. Data. doi: 10.1038/sdata.2017.181 . Allen, E.A., Damaraju, E., Eichele, T., Wu, L., Calhoun, V.D., 2017. EEG signa-
tures of dynamic functional network connectivity states. Brain Topogr. 1–16. doi: 10.1007/s10548-017-0546-2 .
Allen, E.A., Damaraju, E., Plis, S.M., Erhardt, E.B., Eichele, T., Calhoun, V.D., 2014. Track- ing whole-brain connectivity dynamics in the resting state. Cereb. Cortex 24, 663–676. doi: 10.1093/cercor/bhs352 .
A. Kabbara, V. Paban and M. Hassan NeuroImage 227 (2021) 117674 Andrews-Hanna, J.R., Snyder, A.Z., Vincent, J.L., Lustig, C., Head, D., Raichle, M.E., Buck-
ner, R.L., 2007. Disruption of large-scale brain systems in advanced aging. Neuron doi: 10.1016/j.neuron.2007.10.038 .
Baker, A.P., Brookes, M.J., Rezek, I.A., Smith, S.M., Behrens, T., Smith, P.J.P., Wool- rich, M., 2014. Fast transient networks in spontaneous human brain activity. Elife 2014. doi: 10.7554/eLife.01867 .
Bassett, D.S., Porter, M.A., Wymbs, N.F., Grafton, S.T., Carlson, J.M., Mucha, P.J., 2013. Robust detection of dynamic community structure in networks. Chaos 23. doi: 10.1063/1.4790830 .
Bassett, D.S., Sporns, O., 2017. Network neuroscience. Nat. Neurosci. 20, 353–364. doi: 10.1038/nn.4502 .
Bassett, D.S., Wymbs, N.F., Porter, M.A., Mucha, P.J., Carlson, J.M., Grafton, S.T., 2011. Dynamic reconfiguration of human brain networks during learning. Proc. Natl. Acad. Sci. U. S. A. 108, 7641–7646. doi: 10.1073/pnas.1018985108 .
Bassett, D.S., Yang, M., Wymbs, N.F., Grafton, S.T., 2015. Learning-induced autonomy of sensorimotor systems. Nat. Neurosci. 18, 744–751. doi: 10.1038/nn.3993 . Bernas, A., Barendse, E.M., Aldenkamp, A.P., Backes, W.H., Hofman, P.A.M., Hen-
driks, M.P.H., Kessels, R.P.C., Willems, F.M.J., de With, P.H.N., Zinger, S., Jansen, J.F.A., 2018. Brain resting-state networks in adolescents with high- functioning autism: analysis of spatial connectivity and temporal neurodynamics. Brain Behav. doi: 10.1002/brb3.878 .
Bland, j.M., Altman, D.G., 1995. Multiple significance tests: the Bonferroni method. BMJ doi: 10.1136/bmj.310.6973.170 .
Blondel, V.D., Guillaume, J.-.L., Lambiotte, R., Lefebvre, E., 2008. Fast unfold- ing of communities in large networks. J. Stat. Mech. Theory Exp. 10008, 6. doi: 10.1088/1742-5468/2008/10/P10008 .
Brookes, M.J., Woolrich, M., Luckhoo, H., Price, D., Hale, J.R., Stephenson, M.C., Barnes, G.R., Smith, S.M., Morris, P.G., 2011. Investigating the electrophysiological basis of resting state networks using magnetoencephalography. Proc. Natl. Acad. Sci. U. S. A. 108, 16783–16788. doi: 10.1073/pnas.1112685108 .
Brookes, M.J., Woolrich, M.W., Barnes, G.R., 2012. Measuring functional connectivity in MEG: a multivariate approach insensitive to linear source leakage. Neuroimage 63, 910–920. doi: 10.1016/j.neuroimage.2012.03.048 .
Colclough, G.L., Brookes, M.J., Smith, S.M., Woolrich, M.W., 2015. A symmetric mul- tivariate leakage correction for MEG connectomes. Neuroimage 117, 439–448. doi: 10.1016/j.neuroimage.2015.03.071 .
Colclough, G.L., Woolrich, M.W., Tewarie, P.K., Brookes, M.J., Quinn, A.J., Smith, S.M., 2016a. How reliable are MEG resting-state connectivity metrics? Neuroimage 138, 284–293. doi: 10.1016/j.neuroimage.2016.05.070 .
Colclough, G.L., Woolrich, M.W., Tewarie, P.K., Brookes, M.J., Quinn, A.J., Smith, S.M., 2016b. How reliable are MEG resting-state connectivity metrics? Neuroimage 138, 284–293. doi: 10.1016/j.neuroimage.2016.05.070 .
Coquelet, N., De Tiège, X., Destoky, F., Roshchupkina, L., Bourguignon, M., Goldman, S., Peigneux, P., Wens, V., 2020. Comparing MEG and high- density EEG for intrinsic functional connectivity mapping. Neuroimage, 116556 doi: 10.1016/J.NEUROIMAGE.2020.116556 .
Damoiseaux, J.S., Prater, K.E., Miller, B.L., Greicius, M.D., 2012. Functional connec- tivity tracks clinical deterioration in Alzheimer’s disease. Neurobiol. Aging 33. doi: 10.1016/j.neurobiolaging.2011.06.024 .
Damoiseaux, J.S., Rombouts, S.A.R.B., Barkhof, F., Scheltens, P., Stam, C.J., Smith, S.M., Beckmann, C.F., 2006. Consistent resting-state networks across healthy subjects. Proc. Natl. Acad. Sci. U. S. A. 103, 13848–13853. doi: 10.1073/pnas.0601417103 . de Pasquale, F., Corbetta, M., Betti, V., Della Penna, S., 2018. Cortical cores in network
dynamics. Neuroimage doi: 10.1016/j.neuroimage.2017.09.063 .
de Pasquale, F., Penna, S.Della, Sporns, O., Romani, G.L., Corbetta, M., 2015. A dynamic core network and global efficiency in the resting human brain. Cereb. Cortex bhv185. 10.1093/cercor/bhv185.
Delamillieure, P., Doucet, G., Mazoyer, B., Turbelin, M.R., Delcroix, N., Mellet, E., Zago, L., Crivello, F., Petit, L., Tzourio-Mazoyer, N., Joliot, M., 2010. The resting state ques- tionnaire: an introspective questionnaire for evaluation of inner experience during the conscious resting state. Brain Res. Bull. doi: 10.1016/j.brainresbull.2009.11.014 . Desikan, R.S., Sugonne, F., Fischl, B., Quinn, B.T., Dickerson, B.C., Blacker, D., Buck-
ner, R.L., Dale, A.M., Maguire, R.P., Hyman, B.T., Albert, M.S., Killiany, R.J., 2006. An automated labeling system for subdividing the human cerebral cor- tex on MRI scans into gyral based regions of interest. Neuroimage 31, 968–980. doi: 10.1016/j.neuroimage.2006.01.021 .
Diaz, B.A., Hardstone, R., Mansvelder, H.D., Van Someren, E.J.W., Linkenkaer-Hansen, K., 2016. Resting-state subjective experience and EEG biomarkers are associated with sleep-onset latency. Front. Psychol. doi: 10.3389/fpsyg.2016.00492 .
Doucet, G., Naveau, M., Petit, L., Zago, L., Crivello, F., Jobard, G., Delcroix, N., Mellet, E., Tzourio-Mazoyer, N., Mazoyer, B., Joliot, M., 2012. Patterns of hemodynamic low- frequency oscillations in the brain are modulated by the nature of free thought during rest. Neuroimage doi: 10.1016/j.neuroimage.2011.11.059 .
Filippi, M., Spinelli, E.G., Cividini, C., Agosta, F., 2019. Resting state dynamic functional connectivity in neurodegenerative conditions: a review of magnetic resonance imag- ing findings. Front. Neurosci. doi: 10.3389/fnins.2019.00657 .
Fox, M.D. , Raichle, M.E. , 2007. Spontaneous fluctuations in brain activity observed with functional magnetic resonance imaging. Nat. Rev. Neurosci. 8, 700–711 nrn2201 [pii]\n10.1038/nrn2201 .
Garrison, K.A., Scheinost, D., Finn, E.S., Shen, X., Constable, R.T., 2015. The (in)stability of functional brain network measures across thresholds. Neuroimage 118, 651–661. doi: 10.1016/j.neuroimage.2015.05.046 .
Girvan, M., Newman, M.E.J., 2002. Community structure in social and biological net- works. Proc. Natl. Acad. Sci. U. S. A. 99, 7821–7826. doi: 10.1073/pnas.122653799 .
Gramfort, A., Papadopoulo, T., Olivi, E., Clerc, M., 2010. OpenMEEG: open- source software for quasistatic bioelectromagnetics. Biomed. Eng. Online 9. doi: 10.1186/1475-925X-8-1 .
Greicius, M.D., Krasnow, B., Reiss, A.L., Menon, V., 2003. Functional connectivity in the resting brain: a network analysis of the default mode hypothesis. Proc. Natl. Acad. Sci. U. S. A. 100, 253–258. doi: 10.1073/pnas.0135058100 .
Hamalainen, M.S., Ilmoniemi, R.J., 1994. Interpreting magnetic fields of the brain: mini- mum norm estimates. Med. Biol. Eng. Comput. 32, 35–42. doi: 10.1007/BF02512476 . Hassan, M., Dufor, O., Merlet, I., Berrou, C., Wendling, F., 2014. EEG source con- nectivity analysis: from dense array recordings to brain networks. PLoS ONE 9. doi: 10.1371/journal.pone.0105041 .
Hassan, M., Merlet, I., Mheich, A., Kabbara, A., Biraben, A., Nica, A., Wendling, F., 2016. Identification of interictal epileptic networks from dense-EEG. Brain Topogr 1–17. doi: 10.1007/s10548-016-0517-z .
Hassan, Mahmoud, Wendling, F., 2018. Electroencephalography source connectivity: aim- ing for high resolution of brain networks in time and space. IEEE Signal Process. Mag. 35, 81–96. doi: 10.1109/MSP.2017.2777518 .
Hipp, J.F., Hawellek, D.J., Corbetta, M., Siegel, M., Engel, A.K., 2012. Large-scale cortical correlation structure of spontaneous oscillatory activity. Nat. Neurosci. 15, 884–890. doi: 10.1038/nn.3101 .
Honey, C.J., Kötter, R., Breakspear, M., Sporns, O., 2007. Network structure of cerebral cortex shapes functional connectivity on multiple time scales. Proc. Natl. Acad. Sci. U. S. A. doi: 10.1073/pnas.0701519104 .
Hyvärinen, A., Hirayama, J.I., Kiviniemi, V., Kawanabe, M., 2016. Orthogonal connectiv- ity factorization: interpretable decomposition of variability in correlation matrices. Neural Comput. doi: 10.1162/NECO_a_00810 .
Jiao, Z., Wang, H., Cai, M., Cao, Y., Zou, L., Wang, S., 2018. Rich club characteris- tics of dynamic brain functional networks in resting state. Multimed. Tools Appl. doi: 10.1007/s11042-018-6424-4 .
Jones, D.T., Vemuri, P., Murphy, M.C., Gunter, J.L., Senjem, M.L., Machulda, M.M., Przy- belski, S.A., Gregg, B.E., Kantarci, K., Knopman, D.S., Boeve, B.F., Petersen, R.C., Jack, C.R., 2012. Non-stationarity in the “resting brain’s ” modular architecture. PLoS ONE doi: 10.1371/journal.pone.0039731 .
Kabbara, A., Eid, H., El Falou, W., Khalil, M., Wendling, F., Hassan, M., 2018. Reduced integration and improved segregation of functional brain networks in Alzheimer’s disease. J. Neural Eng. 15. doi: 10.1088/1741-2552/aaaa76 .
Kabbara, A. , Falou, W.E.L. , Khalil, M. , Wendling, F. , Hassan, M. , 2017. The dynamic func- tional core network of the human brain at rest. Sci. Rep. 7, 2936 .
Kabbara, A., Khalil, M., O’Neill, G., Dujardin, K., El Traboulsi, Y., Wendling, F., Has- san, M., 2019. Detecting modular brain states in rest and task. Netw. Neurosci. doi: 10.1162/netn_a_00090 .
Kabbara, A., Paban, V., Weill, A., Modolo, J., Hassan, M., 2020. Brain network dynamics correlate with personality traits. Brain Connect doi: 10.1089/brain.2019.0723 . Kenett, Y.N., Betzel, R.F., Beaty, R.E., 2020. Community structure of the creative brain at
rest. Neuroimage 210, 116578. doi: 10.1016/J.NEUROIMAGE.2020.116578 . Kitzbichler, M.G., Henson, R.N.A., Smith, M.L., Nathan, P.J., Bullmore, E.T., 2011. Cog-
nitive effort drives workspace configuration of human brain functional networks. J. Neurosci. doi: 10.1523/JNEUROSCI.0440-11.2011 .
Lachaux, J.-.P., Rodriguez, E., Le van Quyen, M., Lutz, A., Martinerie, J., Varela, F.J., 2000. Studying single-trials of phase synchronous activity in the brain. Int. J. Bifurc. Chaos 10, 2429–2439. doi: 10.1142/S0218127400001560 .
Leonardi, N., Richiardi, J., Gschwind, M., Simioni, S., Annoni, J.M., Schluep, M., Vuilleu- mier, P., Van De Ville, D., 2013. Principal components of functional connectiv- ity: a new approach to study dynamic brain connectivity during rest. Neuroimage doi: 10.1016/j.neuroimage.2013.07.019 .
Liu, C., Xue, J., Cheng, X., Zhan, W., Xiong, X., Wang, B., 2019. Tracking the brain state transition process of dynamic function connectivity based on resting state fmri. Com- put. Intell. Neurosci. doi: 10.1155/2019/9027803 .
Liu, Z., Fukunaga, M., de Zwart, J.A., Duyn, J.H., 2010. Large-scale spontaneous fluctua- tions and correlations in brain electrical activity observed with magnetoencephalog- raphy. Neuroimage 51, 102–111. doi: 10.1016/j.neuroimage.2010.01.092 . Meunier, D., Achard, S., Morcom, A., Bullmore, E., 2009. Age-related changes in mod-
ular organization of human brain functional networks. Neuroimage 44, 715–723. doi: 10.1016/j.neuroimage.2008.09.062 .
Moussa, M.N., Vechlekar, C.D., Burdette, J.H., Steen, M.R., Hugenschmidt, C.E., Lauri- enti, P.J., 2011. Changes in cognitive state alter human functional brain networks. Front. Hum. Neurosci. 5, 1–15. doi: 10.3389/fnhum.2011.00083 .
O’Neill, G.C., Tewarie, P., Vidaurre, D., Liuzzi, L., Woolrich, M.W., Brookes, M.J., 2017a. Dynamics of large-scale electrophysiological networks: a technical review. Neuroim- age doi: 10.1016/j.neuroimage.2017.10.003 .
O’Neill, G.C., Tewarie, P.K., Colclough, G.L., Gascoyne, L.E., Hunt, B.A.E., Mor- ris, P.G., Woolrich, M.W., Brookes, M.J., 2017b. Measurement of dynamic task related functional networks using MEG. Neuroimage 146, 667–678. doi: 10.1016/j.neuroimage.2016.08.061 .
Owen, J.P., Li, Y.O., Yang, F.G., Shetty, C., Bukshpun, P., Vora, S., Wakahiro, M., Hink- ley, L.B.N., Nagarajan, S.S., Sherr, E.H., Mukherjee, P., 2013. Resting-state networks and the functional connectome of the human brain in agenesis of the corpus callosum. Brain Connect doi: 10.1089/brain.2013.0175 .
Paban, V., Modolo, J., Mheich, A., Hassan, M., 2019. Psychological resilience correlates with EEG source-space brain network flexibility. Netw. Neurosci. doi: 10.1162/netn_a_00079 .
Patriat, R., Molloy, E.K., Meier, T.B., Kirk, G.R., Nair, V.A., Meyerand, M.E., Prab- hakaran, V., Birn, R.M., 2013. The effect of resting condition on resting-state fMRI
A. Kabbara, V. Paban and M. Hassan NeuroImage 227 (2021) 117674 reliability and consistency: a comparison between resting with eyes open, closed, and
fixated. Neuroimage doi: 10.1016/j.neuroimage.2013.04.013 .
Pedroni, A., Bahreini, A., Langer, N., 2019. Automagic: standardized preprocessing of big EEG data. Neuroimage doi: 10.1016/j.neuroimage.2019.06.046 .
Pipinis, E., Melynyte, S., Koenig, T., Jarutyte, L., Linkenkaer-Hansen, K., Ruk- senas, O., Griskova-Bulanova, I., 2017. Association between resting-state mi- crostates and ratings on the amsterdam resting-state questionnaire. Brain Topogr. doi: 10.1007/s10548-016-0522-2 .
Preti, M.G., Van De Ville, D., 2016. Eigenmaps of dynamic functional connectivity: voxel- level dominant patterns through eigenvector centrality. In: Proceedings - International Symposium on Biomedical Imaging doi: 10.1109/ISBI.2016.7493431 .
Raichle, M.E., MacLeod, A.M., Snyder, A.Z., Powers, W.J., Gusnard, D.A., Shulman, G.L., 2001. A default mode of brain function. Proc. Natl. Acad. Sci. U. S. A. 98, 676–682. doi: 10.1073/pnas.98.2.676 .
Rasero, J., Pellicoro, M., Angelini, L., Cortes, J.M., Marinazzo, D., Stramaglia, S., 2017. Consensus clustering approach to group brain connectivity matrices. Netw. Neurosci. 1, 242–253. doi: 10.1162/NETN_a_00017 .
Schoffelen, J.M., Gross, J., 2009. Source connectivity analysis with MEG and EEG. Hum. Brain Mapp. doi: 10.1002/hbm.20745 .
Shirer, W.R., Ryali, S., Rykhlevskaia, E., Menon, V., Greicius, M.D., 2012. Decoding subject-driven cognitive states with whole-brain connectivity patterns. Cereb. Cortex 22, 158–165. doi: 10.1093/cercor/bhr099 .
Sporns, O., Betzel, R.F., 2016. Modular brain networks. Annu. Rev. Psychol. 67, 613–640. doi: 10.1146/annurev-psych-122414-033634 .
Stoffers, D., Diaz, B.A., Chen, G., Den Braber, A., Van’t Ent, D., Boomsma, D.I., Mansvelder, H.D., De Geus, E., Van Someren, E.J.W., Linkenkaer-Hansen, K., 2015. Resting-state fMRI functional connectivity is associated with sleepiness, imagery, and discontinuity of mind. PLoS ONE doi: 10.1371/journal.pone.0142014 .
Tadel, F., Baillet, S., Mosher, J.C., Pantazis, D., Leahy, R.M., 2011. Brainstorm: a user-friendly application for MEG/EEG analysis. Comput. Intell. Neurosci. 2011. doi: 10.1155/2011/879716 .
Tijms, B.M., Wink, A.M., de Haan, W., van der Flier, W.M., Stam, C.J., Scheltens, P., Barkhof, F., 2013. Alzheimer’s disease: connecting find- ings from graph theoretical studies of brain networks. Neurobiol. Aging. doi: 10.1016/j.neurobiolaging.2013.02.020 .
Tompson, S.H., Falk, E.B., Vettel, J.M., Bassett, D.S., 2018. Network approaches to un- derstand individual differences in brain connectivity: opportunities for personality neuroscience. Personal. Neurosci. doi: 10.1017/pen.2018.4 .
Traud, A.L., Kelsic, E.D., Mucha, P.J., Porter, M.A., 2008. Comparing community structure to characteristics in online collegiate social networks 53, 526–543. doi: 10.1137/080734315 .
Tzourio-Mazoyer, N., Landeau, B., Papathanassiou, D., Crivello, F., Etard, O., Delcroix, N., Mazoyer, B., Joliot, M., 2002. Automated anatomical labeling of activations in SPM using a macroscopic anatomical parcellation of the MNI MRI single-subject brain. Neuroimage doi: 10.1006/nimg.2001.0978 .
Van De Ville, D., Britz, J., Michel, C.M., 2010. EEG microstate sequences in healthy humans at rest reveal scale-free dynamics. Proc. Natl. Acad. Sci. U. S. A. doi: 10.1073/pnas.1007841107 .
van den Heuvel, M.P., Sporns, O., 2013. Network hubs in the human brain. Trends Cogn. Sci. doi: 10.1016/j.tics.2013.09.012 .
Van Dijk, K.R.A., Hedden, T., Venkataraman, A., Evans, K.C., Lazar, S.W., Buckner, R.L., 2010. Intrinsic functional connectivity as a tool for human connectomics: theory, properties, and optimization. J. Neurophysiol. doi: 10.1152/jn.00783.2009 . Van Essen, D.C., Ugurbil, K., Auerbach, E., Barch, D., Behrens, T.E.J., Bucholz, R.,
Chang, A., Chen, L., Corbetta, M., Curtiss, S.W., Della Penna, S., Feinberg, D., Glasser, M.F., Harel, N., Heath, A.C., Larson-Prior, L., Marcus, D., Michalareas, G., Moeller, S., Oostenveld, R., Petersen, S.E., Prior, F., Schlaggar, B.L., Smith, S.M., Sny- der, A.Z., Xu, J., Yacoub, E., 2012. The human connectome project: a data acquisition perspective. Neuroimage doi: 10.1016/j.neuroimage.2012.02.018 .
Van Veen, B.D., Van Drongelen, W., Yuchtman, M., Suzuki, A., 1997. Localization of brain electrical activity via linearly constrained minimum variance spatial filtering. IEEE Trans. Biomed. Eng. doi: 10.1109/10.623056 .
Vidaurre, D., Hunt, L.T., Quinn, A.J., Hunt, B.A.E., Brookes, M.J., Nobre, A.C., Wool- rich, M.W., 2018. Spontaneous cortical activity transiently organises into frequency specific phase-coupling networks. Nat. Commun. doi: 10.1038/s41467-018-05316-z . Wens, V., Bourguignon, M., Vander Ghinst, M., Mary, A., Marty, B., Co-
quelet, N., Naeije, G., Peigneux, P., Goldman, S., De Tiège, X., 2019. Syn- chrony, metastability, dynamic integration, and competition in the sponta- neous functional connectivity of the human brain. Neuroimage 199, 313–324. doi: 10.1016/J.NEUROIMAGE.2019.05.081 .
Winkler, I., Haufe, S., Tangermann, M., 2011. Automatic classification of artifac- tual ICA-components for artifact removal in EEG signals. Behav. Brain Funct. doi: 10.1186/1744-9081-7-30 .
Xia, M., Wang, J., He, Y., 2013. BrainNet viewer: a network visualization tool for human brain connectomics. PLoS ONE 8. doi: 10.1371/journal.pone.0068910 .
Yan, C., Liu, D., He, Y., Zou, Q., Zhu, C., Zuo, X., Long, X., Zang, Y., 2009. Spontaneous brain activity in the default mode network is sensitive to different resting-state con- ditions with limited cognitive load. PLoS ONE doi: 10.1371/journal.pone.0005743 . Zalesky, A., Fornito, A., Cocchi, L., Gollo, L.L., Breakspear, M., 2014. Time-
resolved resting-state brain networks. Proc. Natl. Acad. Sci. U. S. A. doi: 10.1073/pnas.1400181111 .