MassachusettsInstitute ofTechnology
Alfred P Sloan SchoolofManagement
50 Memorial Drive
Cambridge. Massachusetts, 02139
The Mythical Man-Month Revisited Peter G. W. Keen Thomas J. Gambino May 1980 CISR No. 57 Sloan WP No. 1132-80
to appear as a chapter in Building Decision Support Systems, edited
-2-TABLE OF CONTENTS
1. Introduction 4
1. Overview 4
1.2 The Mythical Man-Month 5
2. School Finance Policy Issues 8
3. ISSPA Design Features 12
3.1 Introduction 12
3.2 Program Structure 19
4. The Development Process 21
4.1 Introduction 21
4.2 Phase 1: The First Meeting 26
4.3 Initial Commands 27
4.4 Version 30
4.5 Phase 2: Bringing in the Users 31
4.6 Phase 3: Building a System Product 37
4.7 Conclusion 44
5. Principles of Adaptive Design 46
5.1 Introduction 46
5.2 The Cognitive Loop 47
5.3 The Implementation Loop 48
5.4 The Evolution Loop 50
5.5 Adaptive Design in ISSPA 51
6. Command-Based DSS and User Verbs 56
7. APL and the Mythical Man-Month 66
8. Conclusion: Guidelines for Building DSS 78
3-FIGURES
1. Brook's Assessment of Relative Prograinining Effort . . 6
2. CHOOSing Variables in ISSPA 17
3. ISSPA Program Structure 20
4. Identifying Variables in ISSPA 22,23
5. EQUITY Command 25
6. EDA Commands 38,39,40
7. Rules of Thumb for Building a DSS 45 8. An Adaptive Design Framework for DSS 48
9. IMPS (Interactive Modeling and Planning System) . . . 59,60,61
10. Task Representation in Adaptive Design 64
11. Sample Dialog from APL-Based System 74
TABLE
-4-1. Introduction
1.1 Overview
This paper describes the development of a Decision Support System,
from its beginning as part of a research project through to the
implementation of it as a commercial product used by six state
agencies and public sector consulting groups. The system was designed
by individuals with a long-standing involvement with DSS. As such,
it provided an excellent opportunity to test the conventional wisdom
on principles and techniques for DSS design.
We had clear expectations as to what would be easy and what would
be hard to implement. We wanted to see if the DSS field is at a stage where one can give builders reliable rules of thumb
—
not a cookbook, but the sort of pragmatic advice that would be welcomed by a capable systems analyst, consultant or programmer setting out for the firsttime to deliver an interactive computer system to support decision
makers in a complex task.
ISSPA (Interactive Support System for Policy Analysts) is a DSS,
written in APL, that supports administrators, analysts and researchers
concerned with public policy issues at the state and local level. The
initial application which this paper discusses is in the area of school
finance: the funding of public education in individual states.
How-ever, ISSPA is of general relevance to planning and policy making in
both the public and private sectors.
The development strategy was based on principles of adaptive
design, derived from the recommendations of several researchers and
These principles assume that the "final" system must evolve
through usage and learning. Rather than focus on functional
specifi-cations, the designer relies on a prototype to:
(1) Find out quickly what is important to the user as
opposed to what the designer thinks ought to be
important;
(2) provide something concrete for the user to react to
and experiment with; and
(3) define a clear architecture for the DSS, so that it
can easily be modified and evolved.
The prototype is a real system, not a mock-up or experiment.
It provides the base for learning-by-using.
As well as prototypes, adaptive design emphasizes:
(1) Careful attention to the user-DSS dialog, and thus to
the design of the software interface;
(2) the importance of user learning, in terms of the
evolution of the system and the need for flexibility
in the DSS and responsive service by the system builders;
(3) getting started, rather than getting finished; and
(4) a command-based structure; ISSPA is built up of APL
functions that directly correspond to the action words
or the "verbs" users employ in their own problem-solving.
A verb is a statement "do this", such as "give me
descrip-tive statistics", which ISSPA performs with a DESCRIBE function.
1. 2 The Mythical Man-Month
-6-APL, reflect a hypothesis that is the main topic of this chapter:
Adaptive design resolves the problem of the
mythical man-month.
2
The mythical man-month is F.P. Brooks' summary of the discrepancy
be-between the expected and actual effort required to develop software
products. Designers estimate the time for completion in terms of
man-months; their projections almost invariably turn out to be badly wrong
and the system often does not work.
Brooks identifies a number of explanations for the widespread
problems in planning for and delivering software systems. Assessments
of man-months are often based on the number of lines of code, However,
program coding is only 10% of the total effort. Moreover, if X is the
effort required to write and test a program, 3X is needed to make it
into a program product and 9X to integrate it into a system product (Figure 1)
FIGURE I: Brook's Assessment of Relative Programming Effort
System System Product
3X * 9X
Making a program into a product involves documentation, additional testing to ensure "robustness" (i.e., it should be able to handle inputs
and uses outside the range of the initial special-purpose program) ,
-7-substantial testing of linkages, and often additional code must be
written to ensure consistency.
Brooks reconunends several techniques to solve the problem of the mythical
man-month. Ho emphaslzos the Importanii.' of u clear design arrhlti-cturo, the
use of "sharp tools" (including APL) , and systematic testing procedures.
We were particularly concerned about the mythical man-month since we
wished to make ISSPA into a system product and had an extremely limited
budj^et. In essence, we started with a set of hypotheses about DSS
develop-ment, in terms of adaptive design, system architecture, APL, and the
mythical man-month. The rest of this chapter describes our experiences,
focussing on the surprises. We found that:
(1) The principles of adaptive design, which are unique to
the DSS faith and stand in sharp contrast to the methods
of the systems development life cycle, hold up well.
Given APL as a tool, we have been able to evolve a complex system out of simple components and respond quickly to
our users' changing needs.
(2) We underestimated the importance of having skilled users;
much of the testing process relies on them.
(3) While APL immensely speeds up the development process, it
has some hidden costs. It is extremely difficult, even
for expert programmers, to estimate the relative efficiency
of the source code. ISSPA is expensive to run and we
found that rewritting some sections of the code reduced
the processing cost by a factor of 20. We suspect that
many super-high-level languages share with APL a
charac-teristic we term opaqueness: the surface (the source code)
(4) Brook's estimate of 9X seems to hold. Even with APL,
adaptive design and a highly skilled programmer, the
initial development effort has to be supplemented by
continuous attention to improving the usability of the
DSS. Of course, since APL reduces X, it also makes
the total effort
—
9X—
acceptable. 2. School Financial Policy IssuesSince the early 1970's, the funding of public schools has been
a major legislative and judicial issue in at least half the states 3
in the country. The Serrano case in California (1973) established
that a child's opportunity for education
—
expressed in terms ofexpenditures per pupil in each school district in the state
—
shouldnot be determined by his or her parents' and neighbors' wealth.
Towns with high wealth and property values can raise large revenues
for less effort than poor ones. Since local property taxes are the
major component of school revenues, this has resulted in huge
dis-parities between neighboring districts. To resolve this inequity,
the state must both limit rich districts' expenditures and provide
substantial aid to poor ones.
The main result of school finance reform has been to place
responsibility on the state legislature and executive to determine
the "formula", the set of precise equations on which each district's
state aid is based. This requires fundamental rather than incremental
analysis. A school district can base next year's plans on a budgeting procedure which largely examines cost increases (especially in teachers'
salaries). The voters in the town will approve
—
or, increasingly inrecent years, reject
—
the budget. Similarly, in states where school finance is not a major issue, the legislature can adjust last year's
-9-This incremental process, which has worked reasonably well for
a century, breaks down when a judge declares the state's existing
system unconstitutional or when school finance becomes a "hot" issue
because of taxpayer revolts or when inflation affects the ability of
local districts to raise adequate revenues. There must then be
funda-mental, not incremental analysis of policy choices.
Unfortunately, the professional staff responsible for such
analysis can rarely provide it. The whole aim of ISSPA is to break
through the technical constraints they face, but many organizational
ones remain. The key problem is that the whole system has always
relied on incrementalism. There is no policy focus. Even when a
court decision forces rethinking, legislators are mainly concerned
with the "bottom line", the exact impact of a proposed formula on each of their constituent districts. This "costing out" of the
formula leads to a narrow focus; the planning horizon is next year
and longer-term qualitative issues are ignored.
The key issues in school finance concern data. It is a "numbers" game with lengthy arguments about who has the right figures. The
state aid formula is generally based on a variety of data: attendance
by grade, enrollment (which is not necessarily even close to attendance),
local tax rates and revenues, transportation expenditures, special
and vocational education information, etc., etc. School finance is
a morass of numbers. In New York, for example, every local school superintendent must supply the state with up to 1,200 pages of data
a year.
Control over this data is the major source of influence for the
department of education, which is generally a poor step-child in
and reporting procedures, but on the whole, the data management process
is clumsy and inefficient. There is a shortage of programmers. Low salaries and lack of hardware, management and training mean the policy
analysts' major problem is access to high quality information.
These analysts are mainly legislative staff or professionals
working for executive fiscal and budget agencies. Their
responsibili-ties vary; they are partly watchdogs who monitor other parts of
govern-ment (legislative or executive). They may initiate policy alternatives.
Above all, they evaluate information on the current state aid system
and on competing proposals for change. In general, the only
computer-based aids available to them are SPSS (the standard Statistical Package
for the Social Sciences) and limited batch "simulations" which do little
more than calculate what each school district would have received last
year had a proposed formula been used. Only a few states have more
advanced tools. These tend to be expensive but highly valued by their
users.
While legislative debates on school finance are limited to
incremental analysis and the bottom line, the policy issues are complex.
There is a rich research literature on measures of equity and alterna-tive structures for a formula (foundation, guaranteed yield and pupil weighting), and the field has an esoteric jargon
—
recaptures, save harmless, mills, and caps. The gap between the research concepts andthe practice of policy analysts is huge.
ISSPA is intended to bridge the gap, to provide analysts with a "portable technology" that can help them add a real policy focus to
school finance. Since access to information is the key to effective
analysis, and even more, to influencing the legislative debate, ISSPA
-11-information. It is a DSS for policy analysts not for policy analysis. The state department of education often has a monopoly on data
and data processing. It is also difficult for analysts to get
appro-priations for computer resources
—
the centralized data processing unit can generally thwart local efforts to use other services. ISSPAhad to be "portable". A portable technology is one that can be easily
transferred and maintained. Portability includes:
(1) low cost; even $10,000 may be too expensive to
justify, regardless of potential payoff
—
if itinvolves a capital investment proposal and
legislative approval;
(2) installation; given the frequent organizational
isolation of analysts and the hostility of the
data processing unit, it must be easy to build
and update the ISSPA database and to bring up
the DSS;
(3) ease of use and elimination of the need for
training; the analysts have little experience with
computers; it was important to make ISSPA
self-explanatory;
(4) evolution; one long-term aim is to use ISSPA as
a means of translating research concepts into
analytic techniques. This means ongoing
develop-ment; it is essential that users be able to get
access to
—
and contribute to—
the results. Portability is as much a political as a technical concept.ISSPA Design Features
3. 1 Introduction
ISSPA is a command-driven system. There are five categories
of command:
(1) data management (2) data manipulation
(3) data display and reporting (4) statistical analysis
(5) user-system linkages (e.g., 'help' commands)
Conceptually, the database is a matrix in the form:
4 planning units (rows x variables (columns))
There is no fixed limit on either the rows or columns; ISSPA fills up
the workspace with variables (via the CHOOSE command) until it is full.
Labels for rows and columns may be of any length; users are not
con-strained to or muddled by uncommunicative mnemonics. In a typical
school finance application, the database contains 500-600 variables
for each of 500-750 planning units (school districts).
We deliberately chose a simple data structure and approach to
data management for ISSPA. Our assumption was that policy analysis
largely involves exploring and manipulating a small amount of high
quality data, and that analysts think of the data as a simple table
of values.
Commands in ISSPA are simple and kept as close to the users'
vocabulary as possible. Almost all DSS claim to be English-like, and
easy to learn and use. The evidence that ISSPA is indeed so is that
users have been able to operate the system, drav/lng on most of its
-13-a one-hour demonstration. There are currently almost 50 commands;
the initial system, put into use seven months ago, contained 22.
Table 1 lists the commands, with brief comments on how they evolved. Considerable effort was put into the design of the
user-system interface. Conventions were kept to a minimum. Most commands involve typing a single word, which is generally self-explanatory, such as LIST, PLOT, REGRESS, DEFINE or COUNTIF. A structured dialog
is used within the more complex commands; ISSPA prompts the user, in
a fixed sequence: "DO YOU WANT A OR B?"
The only conventions which take time to learn and use concern
CHOOSing variables and variable identifiers. Since the database may
be of any size, only a part of it can be in the workspace at any time.
Users are told to view the DSS as a scratchpad. The commands operate
on whatever is in the scratchpad. The user CHOOSEs which variables
to bring in from disk (see Figure 2) . We assumed that this would not
be constrictive since users will rarely want, or be able, to deal with
more than 10-20 variables at the same time (see also Morton, Carlson
and Sutton)
.
Labels and mnemonics for variables are cumbersome to use and
hard to remember, especially since an ISSPA database often contains
over 600 variables. The convention used in ISSPA is that 'variables
are referenced by either a permanent identifier Vxxx, set up when the
database is created, or by a temporary number Axx, showing the variable's
location in the workspace ('A'xx = active variable number xx)
.
While analysts found their convention reasonably easy to accept,
they still wished to define their own labels at least for those variables
they used frequently. We added a SYNONYM facility so that now variables
can be referred to by their V-number, A-number or a one-word user-supplied
-15-2. Added when Version made available to users
(I) (2) (3) (4) ADD/DROP DATABASE CLEAR ^ FORMAT GROUPIF/UNGROUP x PARTIAL CORK x
RANGE, MIN, MAX, MEAN,
MEDIAN, TOTAL
SCALE/RESCALE x
WAVERAGE
3. Added at user request
COMMAND COST/SESSION COST x
CONTINUE X X
DISPLAY FOR UNITS x
SELECT UNITS x SYNONYM VARS X x WHAT IS . X YEARS ' * SAMPLE
4. User-defined (1) (2) (3) (A) OHIO
WTILES X
5. "Evolved" commands added by designers BOXPLOT CONDENSE EQUITY STEMLEAF 6. Extended Capability IMPS
(1) library? = taken from APL public library?
(2) modify dialog? = were substantial changes made to user-DSS dialog in response to user reactions?
(3) extend/improve? = were extensions or improvements made to the
command, in terms of function not dialog?
(4) system command? = is this a general system command rather than
-17-FIGURE 2 - CHOOSING ISSPA VARIABLES
(User responses are underlined)
COH^AMD: DIFFrrOKT
THE AVAILABLE D/c'icneCOHIESASti
1 FURnLLMEMT
2 FFVFHUE
3 EXPENDITURES
I* STAFF
5 TAX RASE AMD TAX RATE
6 DISTRICT CHARACTERISTICS
EXPLORE ANY CROUP {'HO')? ENROL LMEHT /lOl TOTAL ADM 79 "
fl02 TOTAL ADM 79
f103 SPECIAL EDUCATIOH ADM 79 /lOH SPECIAL EDUCATIOH ADM 78 EXPLORE ARr CROUP (.•RO')r 2
V701 TOTAL REVERUE 79
l'?02 TOTAL REVENUE 78
^203 LOCAL REVENUE 79
l'20^ LOCAL REVENUE 78
l'20S STATE BASIC AID 79
V706 STATE BASIC AID 78 VJOl SPECIAL EDUCATION AID 79
1'208 SPECIAL ErUCATION AID 78
V209 OTrlER REVENUE 79 V210 OTHER REVENUE 78 (1) (2) DIRECTORY permanent lists variable database groups in the
VlOl is permanent numeric identifier number, and TOTAL ADM 79 its permanent discriptor
(3) Group 2, REVENUE, has 10 variables
COMMAMDl VAHS
* » 'to ACTIVE VAKIABLSS* • •
CCSMARD: CROOSS GROUPOR ITEMT~' CROUP
CPOLT NAME (STOP)?' ~ERROLLMEKT
GROUP HAMS IST0P)T STOP
CURRENT RUNBES OP ACTIVEVARIABLES: »
COMMAHD: VARS_
TEE ACTIVE VARIABLES ARgt Al VlOl TOTADKl'i
A7 CI02 T0TADM16 A3 CI 03 SPECEDADM79 Al ClOH SPECEDADMlt
(4) the workspace is currently empty
(5) CHOOSing the ENROLLMENT group results in four active variables
TOTAL ADM 79 TOTAL ADM 78
SPECIAL EDUCATIONADM 79 SPECIAL EDUCATION ADM It
(6) an active variable may be referenced by its
A-number, V-number or synonym (user-supplied)
to, (e.g., Al, VlOl or TOTADM79) may be
used interchangeably with any command
COMHARD: CROOSS CROUPOR ITEM? '
ITEM
ESTER VARIABLE (C) NUMBER (•STOP'):? ESTER VARIABLE (V) NUMBER ('STOP'):? ERTER VARIABLE (V) NUMBER ('STOP'):?
y20\C201 (7) CHOOSE individual variables rather than a group
l'301
yrar
-19-We allowed variable names to be of any length, to ensure that
reports would be meaningful and clear. If users
—
or the legislator or public interest groups for whom they prepare analysis—
think of a variable as "GUARANTEED YIELD, GOVERNOR'S PROPOSAL", then that iswhat must appear on reports, not "GY, GVR". Obviously, by providing
maximum flexibility on variable labels, we had to find a compact and
efficient (from the user's perspective) mode of reference.
3. 2 Program Structure
The program structure of ISSPA is relatively simple in concept.
There are three separate components (See Figure 3)
:
(1) User-system interface;
(2) commands ("LIST", "REGRESS", etc.); and (3) data management routines, transparent to
the user.
Most of the initial effort went to defining the interface, which
handles the dialog between the users and the system and thus strongly
determines if they will view the DSS as friendly and easy to use. Once
the initial system was released for use, significant effort was needed
for the data management routines. Many of the commands use APL functions
from public libraries (see Section 6) , especially those for statistical
analysis.
Brooks draws attention to the "architecture" of a system. The
command-based structure we used for ISSPA meets many of his recommendations;
(1) It reflects a top-down approach and the dialog-manager is
independent of the commands and data management routines:
(2) each command is fully independent of the other; a new one
can be added to ISSPA with no change to the logic of the
-21-(3) our design methodology is a form of "stepwise refinement". We implemented an initial version of a routine and refined
it on the basis of users' experiences and reactions.
The convention for naming variables illustrates this last point.
We started by deciding that there would be no restrictions on variable
labels for reports. This meant that the label could not be used as
the variable indentifier, since this could mean typing 50 characters or
more. We struggled to defind a compact method and initially tried the
V-number approach. We added A-numbers to deal with variables defined
from other variables (e.g., DEFINE (VlOl + V109) 4- V217) .
The initial system was used for several months before we extended
it. We added (Figure 4):
(1) SYNONYM;
(2) WHAT IS; to allow easy identification of a variable; (3) IDENTIFIER: this lists the full label for any A-number,
V-number or synonym;
(4) VARS; this shows the identifiers for all the variables currently active.
Adaptive design assumes that such extensions will be added as a
direct result of system usage. One cannot predict in advance exactly
what will be needed. The early users of ISSPA in effect taught us
.
4. The Development Process 4.1 Introduction
This section briefly summarizes the sequence of the development
process. Adaptive design is based on rules of thumb. We present the
FIGURE 4: IDENTIFYING VARIABLES IN ISSPA
(User Inputs Underlined)
(1) SYNONYM V404
CURRENT SYNONYM: LOCAL TAX BASE
NEW SYNONYM: LOOT
SYNONYM All
NO CURRENT SYNONYMS
NEW SYNONYM: FEDTAX79
(2) WHAT IS TOTENRL78
Al V102 TOTENRL78 TOTAL ENROLLMENT 78
(3) IDENTIFIER Al
23-(4) VARS
THE ACTIVE VARIABLES
ARE:
Al
K201
T0TREV7S
TOTAL
REVEl^UE 79A2
1^30 1T0T0PEXP79
TOTAL
OPEHATIiW
EXP. 79A3 P'lOl
T0TENRL13
TOTAL
ENROLLMEl^T
7 9The initial system took roughly 70 hours of effort on the part
of the programmer (Gambino) . Keen, in an ongoing research study,
had spent six months studying the design and use of the computer models
and information systems in state government agencies concerned with
school finance policy making. The computer systems available to policy
analysts in most states were cumbersome and very limited in scope.
The analysts complained of their lack of flexibility and of the
unavail-ability of data. Generally, they were unable to get programs written
to produce special reports; the data processing staff were unresponsive,
overworked or incompetent. A few states had useful interactive systems,
but these were expensive ($200,000 - $1,000,000).
The initial design aim for ISSPA was to show that a simple, general, flexible and cheap DSS could be built that would meet the analysts'
needs and also facilitate better and more extensive exploration of
policy issues. Limited funds were available for the initial system.
From the start, however, ISSPA was intended to be a system product
in Brooks' sense of the term; it was expected that there would be
sufficient demand for such a system that funds would be available for
continued development.
The development fell into three distinct phases:
(1) Phase 1: build the initial system. Version 0.
(2) Phase 2: extend it, adding new commands and improving existing ones in response to users' reactions.
(3) Phase 3: create the system product that is portable, stable and documented.
25-FIGURE 5: EQUITY COMMAND
COHHAKD: WHAT IS V101.A31.A3t
Al /lOl T0TADH79 TOTAL ADM 79
A37 RBVPBSPUPIL S REVEKUE PER PUPIL
43« EIPPERPVPIL19 $ SIPEMDITURES PER PUPIL 7 9
COMMAHD: EQUITI A37.A3B BI I'lOl
EHTBS PERCENT FOR 'PERCENT MEAN' CALCULATION:? 50 ENTER 'E' VALUE FOR 'ATKINSON'S INDEX' CALCULATION?
PER PUPIL PER PUPIL
1979 1979
4.2 Phase 1: The First Meeting
At their first meeting. Keen and Gambino began by sketching out
the user-system dialog. Keen, as the analyst, had a clear idea of the initial set of user verbs to be supported. For example, it was obvious that analysts relied heavily on rankings; e.g., they would
create a report listing expenditure figures, with the district with
the largest average revenues per pupil showed first. This became a
command: "RANK BY".
Keen presented the verbs and Gambino suggested the exact dialog.
Keen would respond to the recommendation; generally, it would be
rejected if it was cumbersome or clumsy for a non-technical, inexperienced
user.
The meeting lasted three hours. There was a constant give-and-take
between analyst and technician. A general dialog was agreed on but
not set in concrete. This dialog determined the nature of the data
management routines. We had started by focussing on the representation
of the data; it must appear to the user as a simple table of values. Each command must operate directly on the table, with no specific
pro-cedures needed on the part of the user to get, manipulate or update data.
It is worth noting that our approach was the opposite of standard
systems analysis. We began from the outputs and worked back to the
in-puts, leaving the procedures to be specified later. This reflects our
view that what happens at the terminal determines the "quality" of the
DSS; to the user, the interface i£ the system. Most programmers focus
on defining the input data and then the procedures, leaving the outputs
to last.
This strategy also allowed Gambino,who was completely unfamiliar
-27-users. Many programmers have a naive view of the user. Indeed, the
"user" is often only an abstraction. From the start, all our design effort
emphasized what the user would say and see. The "quality" of the DSS
was defined in terms of ease of use, lucidity and gracefulness. Far
from being an abstraction, the user was a real presence.
This initial phase of the development process reflects a key and reliable rule-of-thumb
:
Rule 1: Design the dialog first. Forget about input files,
functional capabilities, etc.:
R.1(a) : Define what the user says and sees
at the terminal.
R.1(b) : Define the representation of the data*
what does it look like to the user?
4.3 Initial Commands
Keen distinguishes between usefulness and usability in a DSS.
Usefulness relates to the capabilities of the system: models, retrieval
facilities and report routines. Usability refers to the user-system
dialog. Our first rule of thumb stresses usability. Obviously, though
the initial system has to contain something worth using.
The link between users' verbs and DSS commands is a key one for
our design strategy (see Section 6) . Understanding the user involves
identifying his or her verbs. The verbs provide design criteria for
the commands that constitute the useful components of ISSPA. We defined
two types of command:
(1) Those based on generic verbs; and (2) those that are special-purpose•
-28-Generic verbs are the ones common to most problem-solving and
analysis, and that are required in most DSS. For example, any task
involving data analysis needs a LIST, RANK and HISTO (gram) command. We identified a dozen generic commands, most of which could be provided with minimal programming.
Generic commands will already have been implemented in other
systems. We chose to use APL partly because excellent public libraries
are available on several computers. APL is a convenient language for
borrowing routines since integrating them into a program requires very little effort. All the statistical routines in ISSPA come from public
libraries. We have found that 2-8 hours are required to modify, integrate
and test a routine from a library. Since it has already been at least partially, and in most cases entirely, debugged, we save much of the
9X of effort Brooks identifies. The main modifications needed in
adding a function to ISSPA involve the user-system dialog. Many of the designers of APL programs show little sensitivity to the user
(see Section 7)
Most special-purpose commands obviously must be programmed. For
policy analysis in general, we identified well over 20 special-purpose
verbs and for school finance another 10. The general verbs largely
related to statistical techniques and measures and the school finance
ones to measures of equity and approaches to comparing and ranking
school districts.
Examples of the various types of command we identified for
potential inclusion in the initial version are:
(1) generic: LIST, RANK, DESCRIBE (descriptive statistics), HISTO (gram), DEFINE (new variable), FREQUENCIES, ADD (to)
-29-(2) special-purpose:
(a) policy analysis: SELECT UNITS, COUNTIF, BOTTOM, NTILES, GROUP, REGRESS, ANOVA
(b) school finance: EQUITY, (equity measures),
GINI, LORENZ''
We put priorities on the commands. This was done informally
and based on four criteria:
(1) The priority to the user; i.e., the extent to which this
command reflected a verb the analysts rely on or would
immediately find useful;
(2) ease of implementation; HISTO and REGRESS could be taken
directly from an APL public library;
(3) clarity of user-DSS dialog; with REGRESS, we could lay out
in advance a simple complete dialog. We found it hard
to do so for ANOVA (analysis of variance) and thus left
that for a later version; and
(4) likelihood of acceptance; we avoided trying to force
unfamiliar or contentious routines on the user; we could
—
and did
—
add them later.The focus on user verbs and the use of a command-based program structure were an effective and simple technique. Our ability to
extend version from 12 to 50 commands directly resulted from these
rules of thumb:
Identify the users' special-purpose verbs.
Identify generic verbs, relevant to this DSS.
Translate the verbs into commands, and vice versa.
Check public libraries for off-the-shelf routines,
especially for generic verbs.
Rule 6: Set priorities for implementing commands for version 0.
Rule 7: Support first, extend later; aim at giving the user
something he or she will readily accept and add the
less familiar, more complex capability later.
4.4 Version
Q
A working system was available within 40 hours. It contained the
following user commands:
LIST, DESCRIBE, RANK, TOP, BOTTOM,
HISTO, REGRESSION, CORRELATE and NTILES
(e.g., 10 NTILES = deciles, 4 NTILES - quartiles)
The regression, histogram and correlation routines were taken from
a public library. Version included other commands needed to manage
the user-system dialog or improve the usability of the DSS; e.g.,
DIRECTORY, CHOOSE, ENVIRONMENT.
When the preliminary system was ready, we spent substantial time
(10 hours) improving what the users saw on the terminal. The major
changes that needed to be made concerned the formats of the outputs.
Whereas functional specifications involve laying out a report format
in some detail, adaptive design is similar to the concept of stepwise
refinement. Instead of asking users "What do you want?", we said
"How do you like this?".^
We entirely redesigned the dialog and style of the outputs by
playing with the system, prior to showing it to potential users. After
an additional 20 hours of programming effort, we had an operational
system (70 hours in total), with over 30 commands. This was made
avail-able to a senior policy analyst and his assistant in a large state's education agency. Over the next three months, they worked with the
-31-This first phase of development workedout well. Even at
commercial rates for programming and computer time, we had spent under
$4,000. We demonstrated the system in several states; instead of trying
to sell an idea, we could show a complete working DSS. We kept careful track of the development process up to this stage; we wanted to check
our experience with the general conclusions of Ness, Courbon et al.
,
and Grajew and Tolovi. We agree with Grajew and Tolovi's estimate
that the initial system, which will then evolve through usage, can
be built for under $10,000 in less than 16 weeks.
This is an important point, since:
(a) It reduces the user's risk and encourages experiment; a
DSS becomes more of an R&D effort than a capital invest-ment; and
(b) the lead time between the initial proposal and a usable system is short enough that the users' enthusiasm and
momentum are not dissipated.
Version was simple but not simplistic. The analysts who saw
it were impressed by how easy ISSPA is to use and by its power:
Rule 8: Keep it simple from the start; aim for a few useful
commands for version and evolve a complex DSS
out of simple components.
Rule 9: Deliver version quickly and cheaply.
Rule 10: Make sure version sells itself; it must be easy to
use, the outputs clear and the dialog self-explanatory.
4.5 Phase 2: Bringing in the Users
In a sense, potential users of ISSPA were involved from the start.
interviews with analysts, legislators and administrators in eleven
states. They discussed the idea of ISSPA with Several experienced
analysts, who worked with version and played a major role in the
evolution of ISSPA.
We were extremely selective in looking for potential users.
Since version was intendedly only a start and not the final system,
the skills and creativity of the early users would strongly influence
the quality of the full system. Adaptive design relies on good users.
Our first user was a widely-respected senior analyst in a large
mid-western state. He was impressed with ISSPA and, with the help of
a subordinate who had some knowledge of computers, began using it
after one demonstration. There was no user manual: while this led to 12
occasional problems, ISSPA is largely self-explanatory.
We wanted the initial users to react to ISSPA and to test it.
We did not want them to have to debug it. Debugging means finding
errors; testing, in our sense, means seeing how well the system works,
deciding what needs to be changed or added and, above all, critiquing
the quality of the interface.
Version was not bug-free. We had left the complex issue of data
management till last. We had carefully designed the representation of
the data
—
how it looked to the user. As we built the data management routines, we introduced errors; what worked on Monday bombed for noapparent reason on Tuesday.
In retrospect, we should not have released version until we had
implemented a reasonably complete initial version of these routines.
Some users get very unhappy very quickly with an unstable system.
(However, they are also very tolerant of errors in the first release
-33-As we expected, we learnt a lot from the early users. One episode was instructive. NTILES is a command that identifies the
cutpoints that break the distribution of values into equal groups;
e.g., 5 NTILES REVENUES lists quintiles, 10 NTILES deciles, etc.
This was an obvious command to include in version 0, since in school
finance court cases and legislative reports, a frequent comparison
is made between, say, the top 10% and the bottom 10% of school districts.
We assumed that the NTILES command would be seen by analysts as helpful,
but not unusual.
In fact, NTILES was enough in itself to sell the merits of ISSPA,
In most states, calculations of deciles are done by hand. SPSS, the
standard statistical package analysts use, does not allow observations
to be reordered. In several states, we found instances where COBOL
programs had been written to print the 5%, 10%, 25%, 33%, .... 95%
intervals for a distribution, but only for specified variables. The
idea that such programs could be generalized and on-line access provided
came as a surprise to many analysts.
Once the analysts had access to a general routine like NTILES,
they used it in new ways and developed new ideas from it. For example,
UTILES adds an equity measure to the simple deciles or quantiles NTILES
provides (WTILES stands for Weighted NTILES). It allows the analyst
to answer such questions as "What are the 1978 expenditures for the
bottom 10% and bottom 90% of the students in the state?". The analyst
who defined WTILES used it as the basis for a major report on school finance equity and felt that the analysis could not have been done
previously.
The sequence of events summarized above occurred several other
(1) Data processing had provided a specific solution to a
specific problem;
(2) we identified the general verb relevant to the problem; (3) we provided a flexible command;
(4) use of the command stimulated a distinctive new idea
or approach; and
(5) we added the resulting user-defined command to ISSPA.
We strongly feel that this pattern is a central aspect of DSS
development. Keen studied over 20 published case descriptions of
DSS and concluded that in many instances, the most effective uses of
the systems were both entirely different from the intended ones and
13
could not have been predicted beforehand (see Section 5) .
Learn-ing and evolution of system commands are a natural outcome of adaptive
design.
Such learning requires skilled users. Throughout the second phase
of the development of ISSPA, we found the users' role to be central;
we had not anticipated their importance in testing. At one stage, we
had users in five separate states. One of them was of immense value
to us, one was close to a disaster. We feel sure that the experience provides a general lesson to DSS builders. Adaptive design provides
a working system quickly. The designer realizes that there will be many things wrong with it and gains immensely from the users' reactions. If
the users are not highly skilled in their own job and actively interested
in the DSS, the designer does not get essential feedback.
A "working" system is one that has no obvious bugs. "*I39VW" or
"SYNTAX ERROR" is clearly a bug, but $210 instead of the correct $160
is not. Because a DSS is intendedly a flexible tool, under the user's control, it does not have a set of "correct" inputs, procedures and
-35-outputs. Even in a standard data proces.slng apyillcatlon, it is
impossible to test all combinations. Flexibility, generality, ad hoc
uses, and variety of inputs, commands and outputs compound the problem.
Only a good user can alleviate it. User A (the good one) provided
invaluable feedback. User Z either did not recognize errors or simply complained that "something's wrong"; the credibility of ISSPA suffered
as a result. In several instances, legislators were given incorrect
reports. The errors were subtle and only an expert on school finance
could spot them. User Z was, reasonably enough, very bothered when
errors were revealed but did little to uncover or cure them. User A
sought them out.
What we learned from all this was that a distinguishing aspect
of DSS development is that it is user-dependent:
(1) Adaptive design is an interactive process of learning and feedback between a skilled user and a skilled
technician.
(2) the user tests a DSS;
(3) many DSS bugs are unobtrusive and remain dormant until a user finds them;
(A) the range of functions exercised depends on the user.
Bugs reveal themselves only by use. Only an imaginative,
confident, involved user gives the DSS an adequate
work out.
Rule 11: Pick a good user; look for someone who:
(a) has substantial knowledge of the task the
DSS supports;
(c) will take the initiative in testing and in
evolving version 0; and 14 (d) enjoys being an innovator.
During this second phase of development, ISSPA grew in scope and
sophistication. Very few commands were left unchanged; many of the
improvements were minor enhancements in formatting or ease of use. New
commands were added that were specific to school finance (i.e., not
based on generic verbs). For example, EQUITY (see Figure 5) provides 12 measures of the equity of an existing or proposed state aid plan.
It is derived from a research paper by Berne which has had substantial
influence on school finance policy research but little on policy making.
Whereas the initial commands supported analysts' existing processes,
EQUITY was specifically intended to add something new.
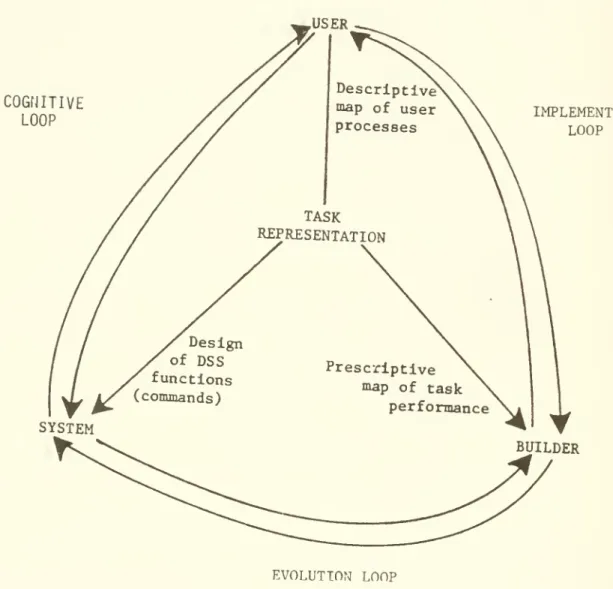
Gerrity introduced the cpncept of descriptive and prescriptive
mapping of a decision process in DSS development. The descriptive map
identifies how the task is currently handled; our focus on user verbs
is one approach to doing so. The prescriptive map provides a long-term
direction for improving the process. It reflects a normative concept, often derived from theory and research.
Keen and Clark had identified as major shortcomings in existing
policy analysisa lack of any real focus on strategic issues, long-term forecasting and conceptual models. Berne's research on equity measures
was too far from most analysts' experience and interests for them to
apply it. By embedding the easy-to-use EQUITY command in ISSPA, we could
encourage them to adopt a broader approach to policy issues. We
explicitly viewed ISSPA as a way of bringing policy research to policy making.
-M-We did not force analysts to use EQUITY. It is one of many
resources available in the DSS. Since it involves typing a single
phrase, there is minimal effort involved in trying it out. Keen argues
1Q
that a DSS is often a way of making useful models usable. We took Berne's 12 measures
—
the useful component—
and made them accessible. Once we had a complete and stable system, more and more of our effortwent into commands like EQUITY which extend rather than support the
user. Figure 6 shows three commands, BOXPLOT, STEM and LEAF and CONDENSE,
19
taken from Tukey's Exploratory Data Analysis (EDA). They required
20
very little programming effort and some of our users are unaware they
exist; they are an unobtrusive method for stimulating learning. Rule 7
stated: support first, extend later. For a DSS to be more than a convenience, it obviously must go beyond LIST, RANK, DESCRIBE, etc. At
the same time, unfamiliar concepts and routines must be presented in a simple way. We did not define an EQUITY model or an EDA package. The
verb-based architecture provided an easy bridge between usefulness and
usability.
4.6 Phase 3: Building a System Product
Phase 3 involved converting ISSPA from a system to a product. Users were now buying a DSS. We had to provide technical support,
documentation and training. Increasingly, we were concerned with costs.
APL programs are not inexpensive to run. We had expected ISSPA to cost
$50 an hour on the excellent system we were using. The actual figure
was closer to $200 an hour. We found that APL penalizes careless
pro-gramming very heavily indeed. Unfortunately, however, whenever we improved
the efficiency of the programs, users were able to do more work in a
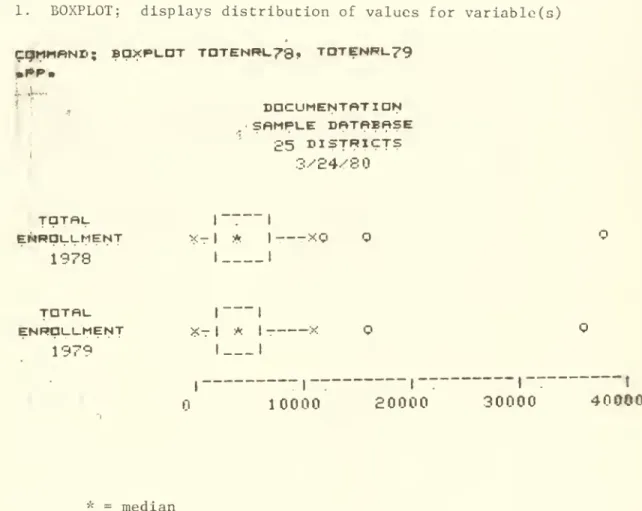
FIGURE 6: EDA COMMANDS
1. BOXPLOT; displays distribution of values for variable(s)
^qtMHftNr«;
BaxPCDT
TaTE:Nm.73, TaTCN«i.79t-t-
DDCUMENTftT
1DN
SflHPUE DRTREftSE25
DISTRICTS
3.'--24/80TDTRL
I IENROLLMENT
X-
I * I—
XQ
1978
I I TDTflL I 1ENROLLMENT
>«;-| # | X1979
I I—
-I—
I~
I~
t10000
20000
30000
40(^80 * = medianbox shows lower and upper quartiles
= interquartile distance
X = lowest and highest data values falling within line
which is same length as the interquartile distance extended from lower and upper quartiles
= values outside the above range
* = values falling more than 1.5 interquartile distances from lower and upper quartiles
-39-STEMLEAF: stem-and-leaf plot
(1) divides range of data into intervals of fixed length (a scale factor may be specified)
(2) stem is vertical line, with interval boundary
(0-3) shown to left
(3) leaf is second significant digit of data value
e.g., enrollment of 13,000 has stem of 1 and
leaf of 3, 2,000 has stem of and leaf of 2
(4) leaves are sorted and shown in ascending order
CaMt"»«NI>; STEML-EftF TDTEN«l-73
SCfH_e FrtCTDRs £ TOT'=»'- ENFfDLI-MHiNT
78
00101111
ooiaaeeasj
001445
0016667
00138
01 II 01 13 Oil 01 16 Oil 021 G2I 021 82 » 021 031 031 031 0310319
PP.
t/«»i»ir) cftSES:25
HJSSIJMSCBSES;
(3) CONDENSE: summarizes distribution of values
CDMMrtND;
CONDENSE
TnTENR»_79, TaTef««-79STATISTICS
('«I_U' , !STDP
'
) -^ ftl_U
PF-
-41-experts who were sure they could halve the cost per hour. They were
unable to do so. From this, we could conclude that with APL, the code
gives little idea of the run time.
Efforts to use desk tops and minicomputers to reduce cost were
amusing but ineffectual. With an IBM 5100, run time went from seconds
to hours. Even with an HP-3000, we reduced costs by a factor of five
and increased response time by twenty. Every improvement in the cost
effectiveness of hardware improves DSS capability. However, current
technology is still inadequate in providing fast and cheap and easily
developed and flexible systems.
Whereas in Phase 1 we were concerned with the process of developing
a DSS, in Phase 3 we had to shift our attention to the system product. The transition is expensive. Over a four month period, we added few
new user commands but spent almost 800 hours on programming. The effort
went into:
(1) improved data management routines; (2) overlaying functions to reduce cost; (3) user-system commands, such as:
(a) SESSION COST: How much have I spent so far? (b) WHAT IS Vxxx: What is the label for V? (4) new commands demanded and often defined by users;
it is worth noting that in most cases, the commands
represented new ideas and approaches stimulated by
ISSPA; and
(5) user documentation, including a comprehensive manual.
As we expected, data and data management became a key issue.
Policy analysis generally involves both operational data, such as
planning data, which is often not available from routine sources.
We deliberately limited the data management capabilities in ISSPA and
required users to provide us with a single tape containing "clean" data.
This in effect provided a barrier to entry; if a state lacks capability
in data collection or if reliable, current historical data are not
available, it makes no sense to provide an interactive DSS to process
bad data more quickly and in more detail. McCoubrey and Sulg provided
us with a useful decision rule: "Assume the data do not exist, no
matter what Data Processing tells you.".
Creating an ISSPA database is technically very simple. Even so,
we encountered a variety of irritating minor problems, many procedural. Even with operational data pulled directly off computer tapes, there
is some manual link needed. We had to provide a variety of facilities
for error checking, and for updating, correcting and adding to the
database. Obviously, a generalized database management system would have helped, especially by reducing the manual work required. However,
it was, and still is, an infeasible option. DBMS requires a maturation
in the use of computers, financial investment and level of technical
competence that state governments (and, in our experience, many
mid-sized private businesses) lack.
We found that most of the complicated programming for ISSPA went
into minor functions for data management. Moreover, we were unable to
provide the same responsive service to users in this area that we boasted
of in anything involving ISSPA commands. If a user wanted a special analytic routine, we could provide it overnight. Whenever there were
problems with a command, the difficulty was invariably easy to resolve, since it was localized. A disadvantage of having data management be
-43-idea what was going on
—
and at times, neither did we. (Transparent means that users are kept unaware of the dynamics or complexity of thesystem operations; everything "happens" without effort on their part.)
The error often affected several user commands.
We found no guidance in the DSS literature, which provides little
discussion of data management. None of our problems were complex or
hard to resolve, but we found, increasingly:
(a) Programming effort was diverted from user commands
to system functions;
(b) processing time and inefficiencies increased as we tackled data management issues; for example, we often
had several duplicate copies of matrices to keep
track of in the workspace; and
(c) our simple data structure in matrix form (from the
user's view) and vector form (the physical structure)
was still the best solution. The dilemma for DSS
design is that since uses are varied and unpredictable
(Section 5), there is no optimal physical or logical
structure. Complex data management procedures greatly
add to system overhead.
The whole issue of data management in DSS is a complex one, and we could find little help that translated into reliable rules of thumb.
Carlsen describes a methodology for data extraction that is powerful
21
but expensive. In general, techniques for ad hoc modeling are far
ahead of those for ad hoc data management, especially with large data
bases. In Gerrity's PMS and GADS, a DSS developed at the IBM Research
22
Laboratory, most of the programming effort and computing resource was
the relatively small subset of variables needed for a given user command. We could not have afforded such overhead; the price we paid was an
imbalance between the responsiveness, low cost and flexibility of our
analytic commands and the limited, slightly cumbersome nature of our
data management routines.
Rule 12: Recognize that data management, not commands
(or models) are binding constraint on DSS
develop-ment:
(a) choose as simple a representation as possible
(e.g., a matrix); and
(b) avoid complex data extraction and manipulation.
4.7 Conclusion
ISSPA is now (early 1980) a commercial product. It has to compete
in a market that is very cost conscious. Users also expect instant service. V-Thereas at the end of Phase 1, we were ready to write a paper
on the mythical man-month defeated, now we are not so sure. APL, and
the middle-out strategy and a command-driven architecture provide
immensely powerful techniques for developing a DSS. However, extending
a working system to a system product is a complex process, with many hidden costs. For example, there is no quick or cheap way to produce
a good user manual. In Phase 1, we were able to "sell" the system through explanation and hands-on experiment, because we were personally
credible with our users. By Phase 3, the manual was needed to establish
the credibility of ISSPA.
.1^'^.
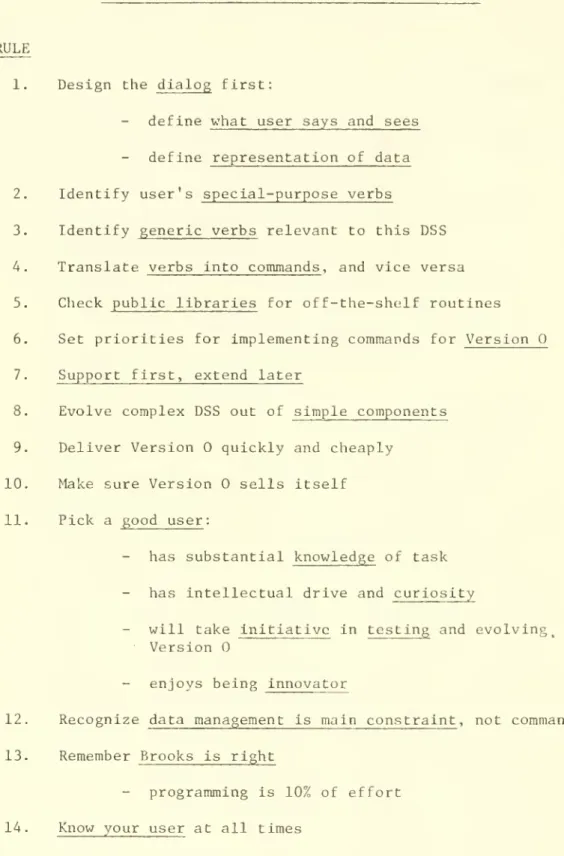
FIGURE 7: RULES OF THW1B FOR BUILDING DSS
RULE
1. Design the dialog first:
define what user says and sees
define representation of data
2. Identify user's special-purpose verbs
3. Identify generic verbs relevant to this DSS 4. Translate verbs into commands, and vice versa
5. Check public libraries for off-the-shelf routines 6. Set priorities for implementing commands for Version 7. Support first, extend later
8. Evolve complex DSS out of simple components 9. Deliver Version quickly and cheaply
10. Make sure Version sells itself
11. Pick a good user:
has substantial knowledge of task
has intellectual drive and curiosity
will take initiative in testing and evolving^ Version
- enjoys being innovator
12. Recognize data management is main constraint, not commands
13. Remember Brooks is right
programming is 10% of effort
-46-Rule 13: Remember Brooks is right.
—
—
—
—
^ <•
Rule 14: Know your user at all times.
Rule 13 may be restated in several ways:
(1) programming is 10% of the effort;
(2) if you want to build a product that will stand by itself, recognize the time and
effort needed; and
(3) Version can be built in weeks.
Rule 14 reflects the whole logic of adaptive design. Of all
techniques for applying computer-based models and information systems
to complex decision processes, Decision Support involves the most
attention to the user as a real person. At every single step in the
development of ISSPA, our success depended on:
(1) supporting a person, not solving a problem or building
a model;
(2) getting feedback from analysts' direct use of the DSS; and (3) responding to users' ideas and requests.
Principles of Adaptive Design
5.1 Introduction
23
A recurrent theme in DSS research is user learning. A DSS does
not solve problems, but lets individuals exploit their own skills in
problem-solving. The obvious strategy for DSS design is to support
first, extend later; the initial system is close enough, in terms of
commands and mode of dialog, to the users' current procedures to be
both attractive and easy to use. Clearly, however, if the DSS is to
-47-Keen (1979) draws attention to a consistent finding in DSS case studies: the unpredictability of system uses. The actual uses of a DSS are frequently entirely different from the intended ones. For
example, Gerrity's Portfolio Management System, intended to support
the investment decision, became instead a valuable aid to marketing
and communicating with customers. Often, the most innovative and
valued uses of a DSS could not have been anticipated by the designer. Keen summarizes this process, which has substantial implications
for the choice of a design architecture and an implementation strategy,
in a framework that views
—
in fact defines—
a Decision SupportSystem as an adaptive development strategy applicable only to situations
where the "final" system cannot be predefined, but must evolve through
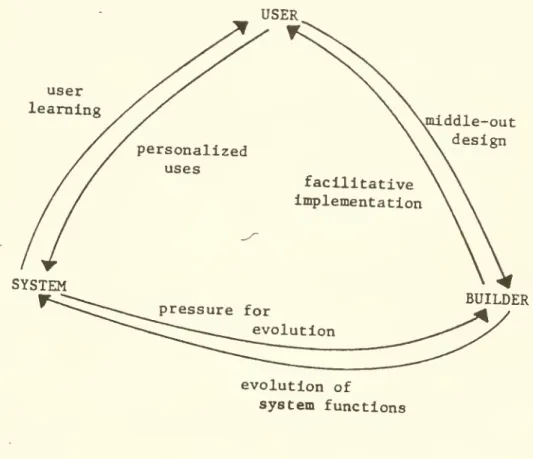
the interactions of user, system and designer. Figure 8 shows these adaptive influences.
This conceptual framework was developed partly from a review of
DSS research and case studies and partly through the process of developing
ISSPA. It translates into some very specific design criteria and
tech-niques. Most importantly, it views user learning as a direct outcome
of DSS usage and a contributor to it. The explicit reason for building ISSPA was to help improve policy analysis; learning was viewed as the
central issue for design and usage.
5. 2 The Cognitive Loop
Each arrow in Figure 8 indicates an adaptive influence. System —^User
,
for example, indicates that the DSS stimulates changes in the user's
problem-solving process. If an interactive system does not require or aim at
such user learning, then the label DSS is superfluous. Keen argues
that it is meaningful to label a system a DSS only if doing so leads
FIGURE 8: AN ADAPTIVE DESIGN FRAMEWORK FOR DSS USER SYSTEM jniddle-out design
facultative
implementation BUILDER evolution of system functions
-49-Situations where a system cannot be predefined and used independent
of the choices and judgments of the user, and where it will be extended
and modified, require a distinctive development process in which
learn-ing, adaptation and evolution are central.
The interactions between the user and the system directly relate
to learning. The DSS is intended to stimulate changes in user
think-ing: at the same time, it must be flexible enough to adapt to the
user as these changes occur. New tools must shape new uses, and vice -versa. As the user develops a new approach to problem-solving, he or
she must not be constrained by the previous one. If a system follows a rigid sequence of routines, learning is blocked. The User
—
System
link thus relies on a design architecture that permits personalizeduse; without it, any learning stimulated by the DSS cannot be exploited.
5. 3 The Implementation Loop
Keen terms the user-system links, the cognitive loop.
The implementation loop refers to the relationship between the designer
and the user.
Ness defined a key aspect of adaptive design: "middle-out"
development. ^'^ This is contrasted with top-down or bottom-up approaches,
and relies heavily on fast development and prototyping. Middle-out
design provides a means for the designer to learn from the user
(User
—
Designer) . While the concept of adaptive design is somewhatbroader than middle-out, Ness's concepts are at its core.
The implementation process requires a facilitative strategy on
the part of the designer (Designer
—
User) . A DSS is not anoff-the-shelf product. Building it requires close involvement with the user.
-50-or integrating agent (Bennett) who can act as a crusader, teacher and 25
even confidant. Adaptive design is a joint venture between user and
designer. Each needs to respect and understand the other. The designer's
job goes well beyond traditional systems analysis and functional
specifications. He or she needs to:
(1) understand the task and user;
(2) be able to humanize and even customize the system; and (3) be responsive to the user and help stimulate exploration
and learning.
In most instances of successful DSS development, the system is
associated with a skilled intermediary/impleraenter. The DSS is as
much a service as a product.
5.4 The Evolution Loop
The evolution loop relates to the process by which learning,
personalized use, middle-out and facilitative implementation combine
to make the initial system obsolescent and evolution essential. This
is shox-m in Figure 8 as an adaptive link from system to designer. Evolving the system means adding new commands (Designer
—
¥ System) Knowing when and how to evolve it requires keeping track of user andusage (System
—
* Designer)The main value of the command-based architecture used in ISSPA
is that it is easy to add commands, given APL. The DSS designer has
to plan for evolution. Since many of the new commands will be
user-defined, they may be very different from the preceding ones. Obviously,
however complex or esoteric they may be, it is essential that they do
not involve restructuring the program, only adding independent modules
to it. Brooks describes the need for "conceptual integrity" in the
-51-"The purpose of a programming system is to make a
computer easy to use .... Because ease of use is the purpose,
(the) ratio of function to conceptual complexity is the
ultimate test of good system design ....
For a given level of function, however, that system
is best in which one can specify things with the most
simplicity and straightforwardness."
Evolving a DSS relies on conceptual integrity. The
command-based, top-down structure of ISSPA provides for this. A major
postulate of the adaptive design framework is that a DSS is a
vehicle for user learning and hence, that evolution is inevitable
and essential.
Knowing when and how to evolve the DSS is often difficult. In
the initial stages of development, there is usually close and direct
contact between Designer and User. Later, however, the designer will
need a more formal methodology for tracking usage. The obvious one
is a data trap which records, with users' permission, each command
they invoke. These records may be analyzed in terms of mode of use,
reliance on individual commands, and stringing commands together into
distinct sequences or sentences. A data trap can provide a wealth of information to the designer. However, there is no easy way of
interpreting it. (Stabell, Andreoli and Steadman provide one approach,
used to evaluate Gerrity s Portfolio Management System.)
5.5 Adaptive Design in ISSPA
The descriptive mapping of the ISSPA users' decision process was
done by Keen and Clark, with a view towards defining ways to improve
28 ^
analytic capability in school finance policy analysis. it was clear
Whereas in statistical analysis they focus on medians, averages
and correlations, they are also concerned with measures of range and
variance, and with outliers. For example, they often need to look at
extremes, such as the lowest and highest 10% of districts in terms
of tax revenues per pupil. Their role is frequently to explain issues
to legislators, and respond very quickly to their requests for analysis.
The descriptive mapping identifies the key issues in making a
DSS usable. The prescriptive map defines how to make it more useful.
Our analysis was similar to Gerrity's and Stabell's assessment of the
Portfolio Management System. We found that the analysts had fairly
simple concepts of policy analysis and relied on only a few techniques,
especially ranking and linear regression. The descriptive map for a
DSS focusses on how people carry out a task. The prescriptive map
looks at the task itself. Gerrity found a lack of analytic concepts
among portfolio managers. There is a rich body of financial theory
relevant to their job that they do not draw on. They do not base their
decisions on analysis of their customers' portfolios, but think in
terms of individual stocks, ignoring issues of risk-return trade-offs.
The school finance analysts similarly ignore policy research; they
think incrementally and rarely go beyond the discussion of the bottom
line. They focus on very few overall policy issues.
Gerrity built PMS to support the existing process and move users
towards a more analytic one. Stabell found that the intended change
did not occur and argued that not enough attention was paid to how
to stimulate learning. With ISSPS, we intended to evolve the system
by adding commands that reflected concepts new to the analysts. For
example, we hoped to introduce adaptive forecasting techniques,
-53-analysis and exploratory data analysis. Clearly, it is unlikely that
analysts subject to organizational traditions and pressures of
day-to-day operations, will spontaneously adopt these new approaches. We
needed some leverage point and decided that the key issue for stimulating
learning is to find a really good user. Our assumption, backed up by
the findings from DSS case studies is that skilled users, helped
per-haps by capable intermediaries (Designer
—
»User in Figure 8), willexplore the DSS, find personal ways of using it (User
—
* System), pro-vide the design team with insights and challenges (User—
Designer) and respond to recommendations and training (Designer » User) . Inthis way, they themselves will help the system evolve.
We viewed ISSPA specifically as a vehicle for stimulating user
learning. We expected that:
(a) initially users would rely on fairly simple commands, reflecting simple user verbs;
(b) as they got used to the DSS and found it valuable, they would string these together into sentences,
re-flecting a methodology for analysis; once this occurred, we would need to provide an "exec" facility" and
(c) they would then ask for extensions to existing commands, define new ones and be ready to try out ones such as
EQUITY.
The principles of adaptive design indicated that for this sequence
to occur (as it did) , we had to ensure that the development process
allowed all the adaptive links to operate:
(1) for the cognitive loop, this meant:
(a) the interface and dialog must be communicative, responsive and easy to use and the commands directly
-54-relevant to the existing process, to facilitate
use and learning (System
—
User) . (We have noformal measures of the quality of these features
of the interface; the number of user errors, as
revealed by the data trap, and user comments are
reasonably adequate indicators.); and
(b) the DSS be command-based, with minimal constrictions on mode and sequence of use, to allow personalized,
innovative use (User
—
System) (2) for the implementation loop:(a) middle-out design, relying on APL to permit responsive service (User
—
Designer) ; and(b) close contact with users, either by one of the
development teams or a technical intermediary with
good knowledge of school finance, from within the
user organization (Designer
—
• User) (3) for the evolution loop:(a) a data "trap" to monitor how individual users work with ISSPA; and
(b) ongoing addition of new commands, expecially in
response to user requests and ideas (Designer
—
System) this also requires continued research on our part.The weakest aspect of our efforts to apply this adaptive
develop-ment strategy was in the implementation loop. We frequently did not
provide adequate facilitation (Designer
—
^
User) . Users need"hand-holding" not because they are stupid or scared of the system, but because
the adaptive links, especially the cognitive loop, consistantly strain