Open Archive TOULOUSE Archive Ouverte (OATAO)
OATAO is an open access repository that collects the work of Toulouse researchers and
makes it freely available over the web where possible.
This is an author-deposited version published in :
http://oatao.univ-toulouse.fr/
Eprints ID : 17900
To link to this article : DOI:10.1016/j.intermet.2017.03.006
URL :
http://dx.doi.org/10.1016/j.intermet.2017.03.006
To cite this version :
Martins, David and Grumbach, Fanny and
Manière, Charles and Sallot, Pierre and Mocellin, Katia and Bellet,
Michel and Estournès, Claude In-situ creep law determination for
modeling Spark Plasma Sintering of TiAl 48-2-2 powder. (2017)
Intermetallics, vol. 86. pp. 147-155. ISSN 0966-9795
Any correspondence concerning this service should be sent to the repository
administrator:
staff-oatao@listes-diff.inp-toulouse.fr
In-situ creep law determination for modeling Spark Plasma Sintering
of TiAl 48-2-2 powder
David Martins
a,b, Fanny Grumbach
a, Charles Mani!
ere
a, Pierre Sallot
c, Katia Mocellin
b,
Michel Bellet
b, Claude Estourn!
es
a,*aUniversit"e de Toulouse, CIRMAT CNRS UPS INPT, 118 route de Narbonne, 31062 Toulouse cedex 9, France
bMines ParisTech, PSL - Research University, CEMEF - Centre for Material Forming, CNRS UMR 7635, CS 10207 rue Claude Daunesse, 06904 Sophia-Antipolis
Cedex, France
c
Safran Tech, Rue des Jeunes Bois, 78114 Magny-les-Hameaux, France
a r t i c l e
i n f o
Keywords:
Spark Plasma Sintering Ti-48Al-2Cr-2Nb Creep
Densification parameters Norton-Green model
a b s t r a c t
Spark Plasma Sintering (SPS) is a process which allows powder densification, applying simultaneously a uniaxial external load and pulsed direct current of very high intensity through tools. This process is attracting significant attention, with a tremendous increase of studies in the metal powder densification field. Its growing popularity lies in the very fast heating rate and short cycle time driven by the Joule effect, which limits grain growth. However, this process implements different coupled electrical, thermal and mechanical phenomena. All this makes the process difficult to develop and to apply for routine industrial production, which has motivated the development of numerical simulation tools in order to understand and optimize the process. Up to now, very few models integrating the coupling between heat generation, electric transfer and mechanics have been proposed.
In particular, a numerical predictive model for powder densification requires a good understanding of the mechanical behavior, in our case a viscoplastic compressive law (Abouaf mechanical model). In this article, we will discuss the characterization of the material during densification, focusing on the creep behaviors of dense and porous state materials used to simulate sintering in the Abouaf framework. Validations of the creep law parameters and also of the densification parameters will be presented and subsequently discussed.
1. Introduction
Titanium Aluminide intermetallics are now a reality for struc-tural applications such as aero-engines, replacing nickel based su-peralloys[1e3]. The combination of a relatively high yield strength at high temperatures with good creep resistance, excellent resis-tance to oxidation/corrosion and their low density (3.9e4.1 g/cc) have contributed to their introduction on aero-engines' low pres-sure turbine blades or turbochargers in the automotive industry[4]. Several processes are available to produce TiAl alloys, such as classical fusion processes (Vacuum Arc Remelting (VAR)), hot working techniques[2,3]and casting [5]. The first step involves mixing starting raw materials and melting them in VAR. Then,
shaping is achieved by the casting technique using centrifugation or gravity depending on the complexity of the parts to produce. However, chemical homogeneity as well as microstructure control could be an issue when using casting, and can imply dispersions of mechanical properties. Powder Metallurgy is a good alternative to deal with part of these drawbacks and is worth studying; SPS can be compared to Hot Pressing (HP) but it is considered as a non-conventional densification process. Like in HP, a uniaxial external load is applied to the powder, which leads to more rapid densifi-cation compared to free sintering[6]. The major difference between the two techniques lies in the fact that in SPS the heating source is provided by the Joule effect, produced by a pulsed current applied through the tools. Depending on their relative electrical conduc-tivity, heat is generated in the sample itself (i.e. if the sample is more conductive than the tool) or in the tools[7,8]. Heating rates and external applied pressures can be as high as 1000 K/min and 150 MPa respectively, depending on the tools. This method can densify a large range of materials such as polymers, metals,
*Corresponding author. CIRIMAT, 118 route de Narbonne, 31062 Toulouse, France.
E-mail address:estournes@chimie.ups-tlse.fr(C. Estourn!es).
ceramics and their composites. The major advantage of this process is the control of the microstructure generated and its homogeneity in the bulk after sintering [6]. Densification rates as well as microstructure evolutions are closely linked to process parameters such as temperature and pressure distribution within the whole volume, and notably when considering complex-shaped parts. Thus, finite element modeling (FEM) of the whole process is a very efficient way to further optimize tooling design and SPS parameters.
Two main phenomena are usually modeled in SPS: heat gener-ation by the Joule effect and densificgener-ation. The electro-thermal component of the process can be modeled by a simple resistive approach with very good accuracy [8e10]. At the different in-terfaces between the tools and the powder, electrical and thermal contacts have to be considered as they greatly affect the tempera-ture field[7,11e15].
Considering densification under an external applied pressure field, viscoplastic laws are often used to describe the sintering process. Famous expressions developed by Abouaf [16], Olevsky
[17,18]or in[19]for the CAM-CLAY model are gateways between dense and porous mechanic fields. To simulate densification using such approaches, identification of creep law parameters for both dense and porous material is crucial. These data are usually very time-consuming to acquire and require many interrupted experi-ments at different temperatures and pressures on dense and porous samples. These parameters are often determined using HIP (Hot Isostatic Pressure) cycles[16,20,21]which requires several hours of handling[20]and thus restricts the identification of such param-eters to coarse microstructures.
Being able to run such experiments using SPS is very attractive for several reasons. The short processing time associated with SPS allows an identification of the parameters on controlled micro-structures. It opens a way to take into account, in simulations, the impact of microstructure evolution on sintering. A growing number of authors use reverse analysis to determine the powder compac-tion parameters from SPS tests [22,23]. Mani!ere et al. [24]have developed an original methodology, based on the work of Gein-dreau et al.[25], to determine by a set of experiences, the param-eters of the creep law for TA6V processed using SPS in-situ. This methodology will be applied in the present study to TiAl 48-2-2.
2. The constitutive model: Norton-Green compressible viscoplasticity
The densification of a metal powder during electrically activated sintering results from different physical phenomena: the plastic deformation of powder particles ð_εplÞ, the mass transport between
particles by diffusion under load ð_εdlÞ, the mass transport between
particles by electro-migration! _εem" and the mass transport due to
surface tension ð_εstÞ[26]. As a consequence, the global deformation
rate of the powder material, considered as a compressible contin-uum, can be expressed as the sum of the five contributions:
_ε¼ _εplþ _εdlþ _εemþ _εstþ _εth (1)
where _εthis the thermal dilatation.
At high temperature, which is the domain of interest for effec-tive densification in SPS conditions, it is assumed that elastic effects can be neglected. Moreover, and as a first approximation, the respective contributions of electro-migration and transport by diffusion are neglected. Equation(1)reduces then to:
_ε¼ _εvp
þ _εth (2)
where _εplis replaced by _εvp
assuming that particles deformation is purely viscoplastic at high temperature.
The constitutive model of the powder material should provide a relationship between the Cauchy stress tensor
s
and thevisco-plastic part of the strain-rate tensor ð_εvp
Þ. The selected constitutive model is the one proposed by Shima and Oyane[27], which consists of an extension of the viscoplastic power law usually used for high temperature creep of metallic alloys in the dense state. The two next paragraphs contain a brief reminder of this power law and a description of its extension to porous (not dense) materials.
2.1. Viscoplastic power law for creep in the dense state
Metallic alloys generally obey a viscoplastic power law when deformed at high temperature:
_ ε¼ A Tð Þ
s
n (3) wheres
¼ ffiffiffiffiffiffiffiffiffiffiffiffi 3 2s : s qdenotes the von Mises equivalent stress, s ¼
s
%1
3ðtr
s
ÞI the deviatoric stress tensor, I the identity tensor) and_ ε¼ ffiffiffiffiffiffiffiffiffiffiffiffiffiffiffiffiffiffi 2 3_ε vp : _εvp q
is the generalized strain rate.
The viscoplastic behavior is characterized by the temperature dependent function A and by n, a constant coefficient. Function A is assumed to follow an Arrhenius law:
AðTÞ ¼ A0e % %Q RT & (4)
where A0 is a pre-exponential term, Q the activation energy
ðJ$ mol%1Þ, R the universal gas constant and T the absolute
tem-perature ðKÞ.
Equation(3)shows that the generalized strain rate derives from a stress potential:
j
ðs
; TÞ ¼ A Tð Þ n þ 1s
nþ1 ε_¼ vj
vs
(5)The tensor constitutive equation can then be obtained by the normality rule: _εvp ¼v
j
vs
¼ vj
vs
vs
vs
(6) Leading to: _εvp ¼3 2AðTÞs
n%1s (7)2.2. Extension to the case of a porous metallic alloy
This extension relies first on the definition of the equivalent stress, as proposed by Green[22,28]:
s
¼'3c
2s : s þ f ðtr
s
Þ2(1=2 (8)
with c and f two decreasing functions of the relative density
r
r.When densification tends to be completed ð
r
r/1Þ, the limit values of c and f should be 1 and 0, respectively, in order to retrieve the standard von Mises expression fors
. Different expressions for cand f functions can be found in the literature[25,29,30]. On the interval ½
r
r;crit;1' for the relative density, there are the generalexpressions:
c ¼ 1 þ
a
f f ¼ Kf 1 %r
rr
r%r
r;crit!g
(9)
with
a
; Kf;g
;r
r; crit material parameters.In Equation (9),
a
; Kf;g
are dimensionless with no physicalmeaning, whereas
r
r;crit can be considered as the green relativedensity.
As proposed by Shima and Oyane[27]and by Abouaf[16], for a porous media, the tensor form of the constitutive equation is written in the same form as for the dense material, Eq.(6)and using the same potential function
j
as in the dense state, but with the modified expression of the generalized stress (Eq.(8)). We obtain:_εvp ¼v
j
vs
1s
%3c 2s þ f ðtrs
ÞI & (10)Taking the deviatoric part and the trace of this expression, we have: s ¼2
s
3c %vj
vs
&%1 dev! _εvp" trð Þ ¼s
s
3f %vj
vs
&%1 tr! _εvp" (11)Where dev stands for the deviatoric part. Injecting those two expressions in the equation for the equivalent stress, we obtain:
v
j
vs
¼ %2 3cdevð_ε vp Þ : devð_εvp Þ þ 1 9fðtr _ε vp Þ2 &12 (12)This suggests that the expression on the right hand side should be used for the equivalent or generalized strain rate in the context of a porous material. Thus, the power of deformation per unit of volume may be expressed as
_ w ¼
s
: _εvp ¼vj
vs
1s
%3c 2s : s þ f ðtrs
Þ 2& ¼s
ε_ (13)Finally, the viscoplastic compressible equation takes the following form: _εvp ¼ε_
s
%3c 2s þ f ðtrs
ÞI & ¼ A0e% Q RTs
n%1 %3c 2s þ f ðtrs
ÞI & (14)Different material parameters must be identified for this constitutive equation. Parameters A0, Q and n are associated with
the intrinsic viscoplastic behavior of the metal that constitutes the powder particles. Those three parameters can be identified with tests performed on a fully densified specimen, provided that its microstructure is representative of the powder particles, especially in terms of metallurgical grain size. Conversely, the functions c and f describe the impact of the relative density
r
ron the mechanicaldeformation of the powder material. They are assumed to depend on
r
rexclusively. For this reason, they can be identified byper-forming different compaction tests conducted on porous samples with different relative densities.
Before defining precisely an identification strategy, we will examine what the relationships are between stress and strain rate for two specific cases which will be used afterwards: free compression and confined compression.
3. Model equations in different configurations and definition of a strategy for parameters identification
3.1. Equations for free compression in the dense state
Free compression along the vertical direction z is supposed to be induced by a constant force F, applied to a plain cylindrical spec-imen, which is maintained at a constant temperature. Assuming a perfect lubrication, the stress state is found to be uniaxial and uniform through the specimen. In a coordinate system ðr;
q
; zÞ, the stress tensor writes:s
¼ 2 4 0 0 0 0 0 0 0 0s
zz 3 5 (15)As the temperature is constant, Eq.(2)reduces to _ε ¼ _εvp
, and we have, from Eq.(7):
_εzz¼ %Aj
s
zzjn¼ %A0e% QRTj
s
zzjn (16)3.2. Equations for free compression in the porous state
A similar situation, but for a compressible porous material, will now be considered. The stress tensor is equally uniaxial. From Eq.
(8)we have:
s
¼pffiffiffiffiffiffiffiffiffiffiffic þ fjs
zzj (17)Applying the flow rule, Eq.(14), we obtain:
_εzz¼ %AðTÞðc þ f Þ nþ1
2j
s
zzjn (18)3.3. Equations for confined compression in the porous state
Suppose now that the compression is operated with a tooling which restrains the specimen from any diameter variation. Still assuming a uniform strain rate, we have:
_ε¼ 2 4 0 0 0 0 0 0 0 0 _εzz 3 5 (19)
From Eq.(12), the equivalent strain rate writes:
_ ε¼j_εzzj 3 ffiffiffiffiffiffiffiffiffiffiffiffi 4 cþ 1 f s (20)
Applying Eq.(11), we obtain:
szz¼ 4 9c
s
_ ε _εzz and trð Þ ¼s
1 3fs
_ ε _εzz (21)This leads to:
s
zz¼ szzþ1 3trs
¼s
9_ε %4 cþ 1 f & _εzz¼1 9 %1 A &1n _ ε 1 n%1 %4 cþ 1 f & _εzz ¼ %AðTÞ%1n %1 3 &1nþ1%4 cþ 1 f &12 % 1 nþ1 & j_εzzj 1 n (22)_εzz¼ %3nþ1AðTÞ %4 cþ 1 f &%12ð1þnÞ j
s
zzjn (23)3.4. Definition of the identification strategy
The usual strategy for the identification of the different pa-rameters combines different tests [16,22,24]. First, uniaxial compression tests are conducted on the material in the dense state, at different temperatures, from which A0, Q and n can be
deter-mined. Second, isostatic pressing tests are performed in the non-dense state on specimens with different relative densities. Such tests can provide a direct determination of the function f ð
r
rÞ.Finally, complementary tests, still performed in the non-dense state and for different relative densities, are used to determine a com-bination of c and f, from which the function c(
r
r) can bedetermined.
In the framework of the present study, a similar strategy for the identification of the full set of material parameters has been used. The difference lies on the fact that it is based on the sole use of tests which could be carried out in the SPS pressing device. The different testing conditions are the following ones:
) uniaxial free compression at different temperatures of cylin-drical specimens made of densified powder. The tests are con-ducted in a creep mode, by prescribing the axial force; ) uniaxial free compression of non-dense cylindrical specimen, at
uniform temperature, and for different values of imposed axial force;
) confined compression of non-dense cylindrical specimen in a die, at uniform temperature, and for different values of imposed axial force.
Like in the usual strategy developed in[24], the dense state tests allow the determination of parameters A0, Q and n. The difference
lies in the fact that it is now a combined analysis of the results of the other tests (free and confined uniaxial compressions) that will lead to the determination of c and f functions. The experimental tests, together with their rough results, are presented in the next section.
4. Experimental
All the SPS experiments (i.e.: densifications and in-situ creep tests) were carried out on a Dr. Sinter 2080 device of the Plateforme Nationale CNRS de Frittage Flash located at the Universit"e Toulouse III Paul Sabatier at Toulouse.
The TiAl composition involved in this study is the Ti-48Al-2Nb-2Cr (at%) alloy, currently used on GE90 or LEAP engines. The
powder was supplied by Safran Tech and developed by General Electrics. The main chemical species are titanium and aluminum, with chromium and niobium as alloying elements.
The shape and the grain size distribution of the powder were controlled by Scanning Electron Microscope (SEM) characteriza-tions (Fig. 1).
Concerning the morphology of the powder, grains are mostly spherical. Some heterogeneities, such as elongated grains or sat-ellites are noticeable on Fig. 1-a. We also note the presence of several grain size particules (Fig. 1-b) between 30 and 144
m
m. Laser granulometry analysis of the powder revealed that 10% of the volume of the powder had a size less than 46.6m
m. The 50% of the volume of the powder has a size smaller than 67.6m
m. For large particles, 10% of the volume studied is larger than 97.9m
m (Table 1). The characteristics of the powder are given onTable 1.4.1. Uniaxial free compression tests on full dense and porous material
In both cases, samples were obtained by SPS compaction in graphite molds. They are all 8 mm in diameter. Dense specimens are 10 mm in height whereas the porous ones are taller (Table 2). Porosity-controlled samples were produced using seven inter-rupted SPS sintering cycles performed under vacuum (Table 2). The heating rate was 100 K/min and the pressure applied was 50 MPa without any dwell. With this SPS cycle and for each of the seven specimens, the only difference was the maximum temperature reached (Table 2).
The average relative density was estimated from the geomet-rical method. For samples exhibiting higher relative density than 0.95 verification by Archimedes' method was also performed.
Uniaxial free compression tests were performed in a graphite mold, 20 mm in diameter, used to avoid any contact between the creeping sample and the mold. During the tests the temperature of the sample and the load applied to the punches, as well as the lower punch displacement were continuously recorded.
All tests were performed in the SPS using indirect heating, i.e. the Joule effect was induced in the graphite tools surrounding the samples which were subsequently heated by radiation. To achieve indirect heating, graphite sheets (papyex) of 10 mm diameter with a thickness of 0.2 mm were coated with boron nitride on each side.
Fig. 1. Ti-48Al-2Nb-2Cr powder under the Scanning Electron Microscope (SEM) (a), Grain size curve distribution obtained by laser granulometry analysis (b). Table 1
Grain size distribution and interstitial contamination.
Grain size (mm) Interstitial contamination (wppm)
D10 46.6 C 76
D50 67.6 O 760
They were placed between the sample and the punches for elec-trical insulation, in order to avoid direct Joule heating of the sample. The circular surfaces of the pistons in contact with these graphite sheets were also coated with boron nitride. Another graphite sheet was placed between the punches and the mold (Fig. 2-a). Boron nitride is also a very good lubricant which avoids the barrel effect of the sample. All this allows a homogeneous distribution of the temperature during the experiment [24]. First, according to the methodology developed by Maniere et al., a partially open mold was used (Fig. 2-b) to run the tests, but it was found that the temperature was not homogeneous in the sample (temperature given by thermocouple n*2 was higher than that given by n*1). A
closed mold was finally used (Fig. 2-c) and tests indicated that the temperature on thermocouple n*1 and 2 was the same. All the
following free compression tests were performed with this closed mold.
A thermocouple was positioned at mid height on the samples
surface (thermocouple n*2 Fig. 2-c) to allow the control of
temperature.
4.2. Confined compression on porous material
Isothermal confined compression tests were carried out for various levels of applied pressure until complete densification was reached. The temperature was controlled with thermocouple n*2
(Fig. 3). To assess the real powder temperature during densification, the SPS cycle was reproduced a second time with a sacrificial thermocouple (n*1Fig. 3) introduced in the middle of the powder.
Due to the thermal gradient between the powder and the tools, the real compression temperature was then determined. The experi-mental setup is schematized (Fig. 3). Between graphite (pistons and mold) and powder, a sheet of papyex graphite was used (blue lines inFig. 3). This prevents powder from reacting with the mold and avoids any friction between the powder and the mold[31].
5. Creep parameters determination
5.1. Hypothesis and method
The uniaxial free compression test for dense samples was con-ducted under uniform and stable thermal conditions. The value of the parameter A is then constant during the whole experiment.
We get from Equation(17):
lnj_εzzj ¼ ln AðTÞ þ n lnj
s
zzj (24)The strain rate was computed using the time evolution of the lower punch displacement ðhÞ as follows:
_εzz¼ 0 @ d3ln3h h0 44 dt 1 A (25)
where h0 and h are the height at the initial stage and at a given
Table 2
Sintering conditions to obtain samples for uniaxial free compression tests.
Temperature max (*C) 935 975 995 1005 1035 1100 1200
Obtained relative density 0.77 0.88 0.91 0.93 0.96 0.99 1 (dense samples) Obtained height (mm) 12.98 11.49 10.98 10.87 10.41 10.1 10
Fig. 2. Experimental configurations in situ in the SPS for (a), uniaxial free compression for a dense or porous material, (b) partially open mold and (c) closed mold with thermocouple positions.
time respectively.
The load recorded by the SPS being the load which must be converted to stress using the section of the specimen. Considering a fully dense sample, its volume is constant and the section is deduced from: Sh ¼ S0h0
s
zz¼ %F S¼ % Fp
R2 0 h h0 (26)where S and S0 are the value of the section at a given time and
initial. R0is the initial radius of the sample.
5.2. Identification of creep parameters
First, 3 specimens were fully densified in the SPS at 1200 *C
(50 MPa, 3 min.) and subsequently cooled to room temperature after completion of the experiments. Creep tests were performed on the temperature range achievable for TiAl compression by SPS, i.e. (925 to 975*C). Below this temperature range, the load to be
applied in order to have some significant creep displacement is too high and reaches graphite tool limits 7.53 kN (ie 150 MPa).
When creep tests were performed at higher temperatures, the displacement of the pistons was too rapid. The section evolves too much for each step so the stress is not constant. The data recorded during a creep test of a full dense sample at 975*C is shown in
Fig. 4.
Fig. 4three different curves as a function of time are plotted. In red, the temperature of the sample (measured with the control thermocouple), in black the different load stages applied when the isothermal state is reached and stabilized, and then in green the evolution of the displacement of the lower punch. To ensure a proper contact between the samples and the tools, a very low load was imposed during heating. It should be noted that the evolution of the load before reaching the isothermal step results from the thermal expansion of the different part constituting the SPS col-umn. Indeed, at the very beginning of the process, a contact force is applied and the punch height is recorded. During heating, the tools and the specimen expand and so in order to keep this punch po-sition the value of the force increases.
After each creep test, all the samples were examined to verify that their cylindrical shape was retained and thus, if uniaxial con-ditions were respected. In Fig. 5are summarized all the experi-mental values of ln _ε obtained for different applied stress.
Fig. 5-a, presents the time evolution of the axial stress and the height of the sample during a free compression test at 975*C. The
load applied for each of the 10 steps was constant. As it can be seen fromFig. 5-a (red curve) for the first 7 steps, the stresses computed are constant with time. For the other ones, the stresses decreased during each step. So only this 7 steps can be used for the deter-mination of the creep parameters. This phenomenon can be explained by the rapid and strong increase of the specimen sections due to large creep rates. In these cases, the stress cannot be assigned with an average value and thus this part of the curve is not being used. Finally, 2 other steps remain noisy, which could generate some errors for the creep parameters identification.
As a consequence, at 975*C, only 5 steps will be considered from
the 10 observed inFig. 5-a.
Fig. 5-b represents the evolution of ln ð_εÞ as a function of ln ð
s
Þfor valid tests at three temperatures: 925, 950 and 975*C with the
load ranges respectively of (2.78e5.10 kN), (2.60e5.25 kN) and (1.55e4.94 kN).
Using a linear regression method on these data, creep parameter values were determined as: A0¼ 3.14 108MPa%ns%1, Q ¼ 414 163 J
mol%1and n ¼ 2.81.
5.3. Validation of creep parameters
To validate the creep law established, the free compression test, performed at 975*C, was simulated with the finite element
soft-ware FORGE®
using the parameters A0, n and Q determined
pre-viously. The imposed boundaries conditions and the initial geometry of the sample at the different force applied were extracted from experimental creep data.Fig. 6compares the height evolution of the sample during the creep test as recorded experi-mentally and as calculated with FORGE®
. The stresses simulated is plotted inFig. 6too. Considering the time and load range explored, the simulated final displacement is in firm agreement with the -0.6 -0.4 -0.2 0 0.2 0.4 0.6 0.8 0 200 400 600 800 1000 1200 0 1000 2000 3000 Load (x101 k N) -Displacement (mm) T emperatur e (°C) Time(s) Temperature Load Displacement
Fig. 4. Load, displacement and temperature evolution during a free compression test in-situ in the SPS at 975*C. 0 10 20 30 40 50 60 70 80 90 4 4.5 5 5.5 6 6.5 0 200 400 600 800 1000 1200 1400 1600 1800 Str ess (MPa)
Height of the sample (mm)
Time(s)
Height of the sample computed with experimental data
Computed stress with experimental data
-11 -10.5 -10 -9.5 -9 -8.5 17 17.5 18 18.5 Ln Strain Rate Ln stress 925 °C 950 °C 975 °C fit 925 °C fit 950 °C fit 975 °C
b)
a)
Fig. 5. Time evolution of the height of the sample and the applied stress at 975*C (a)
and evolution of ln ð_εÞ against ln(sÞ (b) for the 3 different creep tests performed on the full dense material in-situ SPS.
experimental one. The same comparison was made for tests per-formed at 925 and 950*C, also with strong agreement. Thus, it
validates the determination of creep parameters and the identifi-cation strategy described in Section4.2.
6. Identification of functions c and f
To further model material densification, the 2 functions cð
r
rÞand f ð
r
rÞ must be determined using two kinds of tests performedon non-dense specimens: uniaxial free compression and confined compression.
For a given relative density
r
r, the values of c and f functions canbe determined by the resolution of the equation for the uniaxial compression and for the confined compression, combined in the following system(27). The sum c þ f is obtained from porous creep tests (with configuration described in Fig. 2c) and the sum 4=c þ 1=f from non-dense confined compression compaction tests (with configuration described inFig. 3).
8 > > > > > > > > > < > > > > > > > > > : c þ f ¼ % j_εzzj A j
s
zzjn &nþ12 4 cþ 1 f ¼ 9A 1 njs
zzjj_εzzj%1n %1 3 &n%1n! 2n nþ1 (27)Provided that A0, Q and n are known, the resolution of system
(27)gives a unique solution. For c þ f , the creep test is performed at constant temperature, thus A is directly computed using the earlier coefficients. During the experiment, the stress
s
zz is computedusing Eq.(26). After each free compression test, the diameter and the relative density of the sample were measured and no significant changes were observed. Therefore, the necks keep the same ge-ometry all the time meaning that no mass transfer takes place.
_εzz was calculated using the displacement of the lower punch
and finally, the value c þ f was calculated and summarized inFig. 8 -a (blue dots). Contr-ary to the creep test on dense m-ateri-al, -a single load dwell was applied to porous samples. The explanation lies in the fact that for porous material, volume conservation hypothesis is
no longer valid and the actuation of specimen section through Eq.
(27)is no longer possible.
The free compression test conditions on porous material are summarized inTable 3:
The second part of system(27)involves several isobar stages. Thus, confined compression tests were carried out at 950 *C (ie
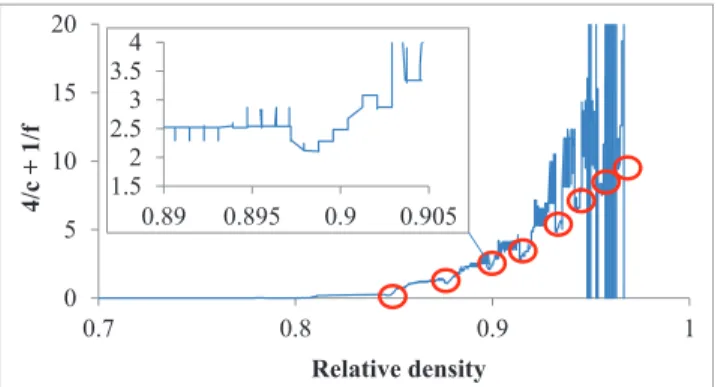
outer mold temperature) for various levels of applied pressure until complete densification was reached. The second set of experiments (see Section3.2) allowed determination of the real temperature of the powder. The relative density is computed using the displace-ment of the lower punch. So for each relative density, the value of 4=c þ 1=f can be calculated. The initial value of relative density is 0.65.
InFig. 7, 4=c þ 1=f values are represented during the confined compression. A lower punch displacement during application of an isobar stage implies that there has been densification.
On each of the load bearings sufficiently large for the densifi-cation to take place, three different steps are discernible. In the first step, just after the application of the load, the displacement speed of the lower piston is not constant. This therefore leads to a vari-ation in the rate of deformvari-ation. This movement reaches a steady state, as a result of which this deformation rate is constant. Finally, the applied force is no longer large enough to generate the densi-fication phenomenon. The value of the displacement of the lower piston decreases and tends towards 0. Surrounded in red are located the values of 4=c þ 1=f computed according to the degree of porosity for the second step of each stage. Here the more the relative density values increase, the more the 4=c þ 1=f values in-crease. Under
r
r¼ 0:85, the value is very low due to c and f beingvery high. Only one value was found at
r
r¼ 0:75 equal to 0.06.Then, empirical expressions for c and f have to be used to deconvoluate both functions. The retained expressions for c and f functions are given in (9). An optimization script was developed with Matlab®
to determine the material parameters present in Equation(9). Minimizing the residual error from the least squares, the quadruple (
r
r;crit, Kf,a
,g
) was determined.Fig. 8presents thefit obtained between experimental values and simulated ones as well as the final shape of functions c and f versus relative density.
Fig. 8-a) shows that c þ f decreases with the relative density and tends towards 1 in the dense state. Fitted curves are in good agreement with the experimental data. Thus, it is now possible to calculate the value of the functions c and f for any relative density between 0.65 and 1. InFig. 8-b, the evolutions of these two func-tions are presented and they both decrease when the relative density increases.
All the parameters required to model SPS sintering of the TiAl 48-2-2 powder are summarized and reportedTable 4.
Table 3
Conditions for free compression test on porous material conditions.
Relative density 0.77 0.88 0.91 0.93 0.96 0.99 1.00 Temperature (*C) 775 825 850 850 875 950 950 Load (kN) 4.2 4.6 4.95 4.85 4.2 4.37 4.43 0 5 10 15 20 0.7 0.8 0.9 1 4 /c + 1 /f Relative density 1.5 2 2.5 3 3.5 4 0.89 0.895 0.9 0.905
Fig. 7. Evolution of 4=c þ 1=f as a function of the relative density computed with the compaction test, insert: zoom forrr¼ 0.9.
Fig. 6. Simulated and experimental creep test performed on a full dense sample at 975*C.
7. Numerical validation of the proposed model
Since the creep law of TiAl 48-2-2 was determined in previous sections, the following section focuses on the validation of this model by comparing experimental and simulated sintering cycles. A sample 8 mm in diameter and 10 mm in height was sintered by SPS at 1050*C (50 MPa and 3 min.). The sintering cycle resumes
to a temperature ramp of 100 K/min, no dwell in temperature and a constant applied load of 50 MPa. The evolution of the relative density as function of time is given inFig. 9. Complete densification is obtained in 740 s. No densification is observed for the first 400 s as temperature is too low.
This densification cycle was simulated with FORGE®
using the electro-thermomechanical model implemented to take into ac-count both the Joule effect and the hot viscoplastic model written by Abouaf. The parameters A0, Q , n , and c, f functions determined
previously were used and the simulated relative density is compared inFig. 9with the experimental one. The correlation is very good throughout the process. The only difference is located in the early stage of densification. This difference can be explained by various phenomena. The determination of creep parameters was performed between 925*C and 975*C, thus creep at lower
tem-peratures could be underestimated by the model. On the other hand, the model implemented in this study is possibly not suffi-ciently precise to capture the first stage of sintering, i.e. the necking phenomenon[32]. Finally, the discrepancy between experimental and simulated data could result from local plastic deformation between particles[33,34], which is not considered by the model. Further creep tests at lower temperature and interrupted tests with SEM analysis of the pores structure are needed to reach a conclu-sion on these points. This will be done in another study. A final comment that can be done onFig. 9is that, despite the fact that only the mass transfer arising from the plastic deformation was considered here (as outlined in Section1), the agreement with the experimental data is excellent even at the end of the densification. This seems to indicate that for such metal densification, plastic deformation is definitely the first order phenomenon, the contri-bution of diffusion under load and surface tension remaining of minor importance. This will need confirmation through future extensive comparison between experimental observation and nu-merical solution.
8. Conclusion
This study focused on the protocol for the in-situ determination of the creep parameters of SPS-sintered TiAl 48-2-2 powders. This experimental protocol, associated with a proper model description of the sintering phenomenon provides acceptable and encouraging results towards the simulation of TiAl densification. This experi-mental methodology was developed in the framework of the Norton-Green powder compaction model, involving a relatively limited number of parameters, such as A0, Q and n for the creep law
of dense material and (c, f ) functions describing porous material behavior.
The unique combination of in-situ SPS creep tests on dense and porous samples as well as confined compaction experiments of powders opens a wide range of opportunities to model sintering of different kind of alloys. This potential has been demonstrated and validated on TiAl 48-2-2 case, and this approach could be generalized.
Acknowledgments
The support of the Plateforme Nationale CNRS de Frittage Flash (PNF2/CNRS) is gratefully appreciated. D.M., F.G., P.S., K.M, M.B. and C.E. thank the French National Research Technology Association (ANRT CIFRE Grant No 2013/1485) and Safran for financial support of this study.
References
[1]C. Leyens, M. Peters, Titanium and Titanium Alloys: Fundamentals and
0 5 10 15 20 25 30 1 6 11 16 21 26 0.65 0.7 0.75 0.8 0.85 0.9 0.95 1 4 /c + 1 /f c+f Relative density c+f (exp) c+f (comp) 4/c+1/f (exp) 4/c+1/f (comp) 0 2 4 6 8 10 12 14 16 18 20 1 11 21 31 41 51 61 71 0.65 0.7 0.75 0.8 0.85 0.9 0.95 1 f c Relative density
a)
b)
Fig. 8. Experimental (dots) andfits (lines) for c þ f ( ) and 4=c þ 1=f ( ) (a) and evolution of the c; f functions (b) for the relative density between 0.65 and 1.
Table 4
Values of the creep law parameters and c and f functions.
Parameters A0ðMPa%ns%1Þ Q (J mol%1) n
Values 3.14 108 414 163 2.81 f ¼ 4:97 % 1%rr rr% 0:52 &1:51 c ¼ 1 þ 2:9f .
0
200
400
600
800
1000
1200
0.65
0.7
0.75
0.8
0.85
0.9
0.95
1
1.05
0
200
400
600
800
T
emperatur
e
(°C)
Relative density
Time (s)
Densification SPS
Densification Forge
Temperature SPS
Applications, Wiley VCH, 2003.
[2] X. Wu, Review of alloy and process development of TiAl alloys, Intermetallics 14 (2006) 1114e1122.
[3] D. Hu, X. Wu, M. Loretto, Advances in optimisation of mechanical properties in cast TiAl alloys, Intermetallics 13 (2005) 914e919.
[4] E. Loria, Quo vadis gamma titanium aluminide, Intermetallics, 9 (2001) 997e1001.
[5] D. Jarvis, D. Voss, IMPRESS Integrated Projectdan overview paper, Mat. Sci. Eng. 413 (2005) 583e591.
[6] R. Orrù, R. Licheri, A. Locci, A. Cincotti, G. Cao, Consolidation/synthesis of materials by electric current activated/assisted sintering, Mater. Sci. Eng. R. 63 (2009), 127e287.
[7] Z. Munir, U. Anselmi-Tamburini, M. Ohyanagi, The effect of electric field and pressure on the synthesis and consolidation of materials: a review of the spark plasma sintering method, J. Mater Sci. 41 (2006) 767e777.
[8] G. Molenat, L. Durand, J. Galy, A. Couret, Temperature control in Spark Plasma sintering: an FEM approach, J. Metal. 2010 (2010). Article ID 145431. [9] K. Matsugi, H. Kuramoto, T. Hatayama, O. Yanagisawa, Temperature
distri-bution at steady state under constant current discharge in spark sintering process of Ti and Al 2 O 3 powders, J. Master Process Tech. 134 (2003) 225e232.
[10] U. Anselmi-Tamburini, S. Gennari, J. Garay, Z. Munir, Fundamental in-vestigations on the spark plasma sintering/synthesis process: II. Modeling of current and temperature distributions, Mater Sci. Eng. 394 (2005) 139e148. [11] A. Zavaliangos, J. Zhang, M. Kraemer, J. Groza, Temperature evolution during
field activated sintering, Mater Sci. Eng. A 379 (2004) 218e228.
[12] G. Maizza, S. Grasso, Y. Sakka, Moving finite-element mesh model for aiding spark plasma sintering in current control mode of pure ultrafine WC powder, J. Mater Sci. 44 (2009) 1219e1236.
[13] K. Vanmeensel, A. Laptev, O. Van der Biest, J. Vleugels, Field assisted sintering of electro-conductive ZrO 2-based composites, J. Eur. Ceram. Soc. 27 (2007) 979e985.
[14] C. Maniere, A. Pavia, L. Durand, G. Chevallier, V. Bley, K. Afanga, A. Peigney, C. Estournes, Pulse analysis and electric contact measurements in spark plasma sintering, Electr. Power Syst. Res. 127 (2015) 307e313.
[15] C. Maniere, A. Pavia, L. Durand, G. Chevallier, K. Afanga, C. Estournes, Finite-element modeling of the electro-thermal contacts in the spark plasma sin-tering process, J. Eur. Ceram. Soc. 36 (2016) 741e748.
[16] M. Abouaf, PhD Thesis : Mod"elisation de la compaction de poudres m"etalliques fritt"ees - Approche par la m"ecanique des milieux continus, Institut national Polytechnique de Grenoble, 1985.
[17] E. Olevsky, C. Garcia-Cardona, W. Bradbury, C. Haines, D. Martin, D. Kapoor, Fundamental aspects of spark plasma sintering: II. Finite element analysis of scalability, J. Amer Ceram. Soc. 95 (2012) 2414e2422.
[18] C. Mani!ere, PhD Thesis: Spark Plasma Sintering: couplage entre les approches Mod"elisation, Instrumentation, et Mat"eriaux, Universit"e T3 Paul Sabatier,
2015.
[19] K. Ranjit, N. Mahesh, M. Anwar, Numerical analysis of powder compaction to obtain high relative density in ‘601AB'Aluminum powder, SAS Tech. 11 (2012) 79e84.
[20] J. Besson, PhD Thesis: Simulation num"erique de la mise en forme des c"eramiques - Application !a la compaction isostatique !a chaud, Ecole Nationale Sup"erieure des Mines de Paris, 1990.
[21] E. Brisson, PhD Thesis : Etude experimentale du frittage assemblage d'un composite conducteur en Ag SnO2 sur un support en cuivre par courants puls"es, Universit"e de Bretagne, 2014.
[22] P. Mondalek, PhD Thesis : Numerical Modeling of Spark Plasma Sintering Process, Ecole Nationale Sup"erieure des Mines de Paris, 2012.
[23] X. Wei, C. Back, O. Izhvanov, O. Khasanov, C. Haines, E. Olievsky, Spark plasma sintering of commercial zirconium carbide powders: densification behavior and mechanical properties, Materials 8 (2015) 6043e6061.
[24] C. Mani!ere, U. Kus, L. Durand, R. Mainguy, J. Huez, D. Delagnes, C. Estournes, Identification of the Norton-Green compaction model for the prediction of the Ti-6Al-4V densification during the Spark plasma sintering process, Adv. Eng. Mater. 18 (2016) 1720e1727.
[25] C. Geindreau, D. Bouvard, P. Doremus, Constitutive behaviour of metal powder during hot forming. Part I: experimental investigation with lead powder as a simulation material, Eur. J. Mech. 18 (1999) 581e596.
[26] E. Olevsky, L. Froyen, Constitutive modeling of spark-plasma sintering of conductive materials, Scr. Mater. 55 (2006) 1175e1178.
[27] S. Shima, M. Oyane, Plasticity theory for porous metals, Int. J. Mech. Sci. 18 (1976) 285e291.
[28] R. Green, A plasticity theory for porous solids, Int. J. Mech. Sci. 14 (1972) 215e224.
[29] C. Wolff, S. Mercier, H. Couque, A. Molinari, Modeling of conventional hot compaction and Spark Plasma Sintering based on modified micromechanical models of porous materials, Mech. Mater. 49 (2012) 72e91.
[30] M. Abouaf, J. Chenot, G. Raisson, P. Bauduin, Finite element simulation of hot isostatic pressing of metal powders, Inter J. Numer. Meth Eng. 25 (1988) 191e212.
[31] C. Mani!ere, L. Durand, C. Estournes, Powder/die friction in the spark plasma sintering process: modelling and experimental identification, Scr. Mater. 116 (2016) 139e142.
[32] J. Guyon, Evolution des microstructures et m"ecanismes de densification d'un alliage TiAl lors du frittage par Spark Plasma Sintering, Metz: Universit"e de Lorraine, 2015.
[33] J. Guyon, A. Hazotte, J.-P. Monchoux, E. Bouzy, Effect of powder state on spark plasma sintering of TiAl alloys, Intermetallics 34 (2013) 94e100.
[34] H. Jabbar, A. Couret, L. Durand, J.-P. Monchoux, Identification of microstruc-tural mechanisms during densification of a TiAl alloy by spark plasma sin-tering, J. Alloys Compd. 509 (2011) 9826e9835.