DOCTORAT DE L'UNIVERSITÉ DE TOULOUSE
Délivré par :
Institut National Polytechnique de Toulouse (INP Toulouse)
Discipline ou spécialité :
Génie Électrique
Présentée et soutenue par :
Mme FANG LEI
le mercredi 24 janvier 2018
Titre :
Unité de recherche :
Ecole doctorale :
Innovative Solutions for Acoustic Resonance Characterization in Metal
Halide Lamps
Génie Electrique, Electronique, Télécommunications (GEET)
Laboratoire Plasma et Conversion d'Energie (LAPLACE)
Directeur(s) de Thèse :
M. PASCAL MAUSSIONM. GEORGES ZISSIS
Rapporteurs :
M. BABAK NAHID-MOBARAKEH, UNIVERSITÉ LORRAINE M. MOUNSIF ECH CHERIF EL KETTANI, UNIVERSITE DU HAVRE
Membre(s) du jury :
Mme BETTY SEMAIL, UNIVERSITE LILLE 1, Président M. GEORGES ZISSIS, UNIVERSITE TOULOUSE 3, Membre
M. PASCAL DUPUIS, UNIVERSITE TOULOUSE 3, Membre M. PASCAL MAUSSION, INP TOULOUSE, Membre
Metal halide lamp is one kind of the most compact high-performance light sources. Because of their good color rendering index and high luminous efficacy, these lamps are often preferred in locations where color and efficacy are important, such as supermarkets, gymnasiums, ice rinks and sporting arenas. Unfortunately, acoustic resonance phenomenon occurs in metal halide lamps and causes light flicker, lamp arc bending and rotation, lamp extinction and in the worst case, arc tube explosion, when the lamps are operated in high-frequency bands. This thesis takes place in the context of developing electronic ballasts with robust acoustic resonance detection and avoidance mechanisms. To this end, several envelope detection methods such as the multiplier circuit, rectifier circuit, and lock-in amplifier, are proposed to characterize fluctuations of acoustic resonance. Furthermore, statistical criteria based on the standard deviation of these fluctuations are proposed to assess acoustic resonance occurrence and classify its severity.
The proposed criteria enable classifying between no acoustic resonance and acoustic resonance cases based upon either a two-dimensional plane, a histogram or a boxplot. These analyses are confirmed by the study of spectral variations (variations of the spectral irradiance and colorimetric parameters) as well. Standard deviations and relative standard deviations of these variations are also correlated with the presence of acoustic resonance. The results from this study show that whatever voltage envelope variations or spectral variations are significantly influenced by acoustic resonance phenomena.
A set of metal halide lamps from different manufacturers and with different powers are tested in our experiments. We concluded that our designed multiplier and rectifier circuits for acoustic resonance detection have the same sensitivity as the lock-in amplifier, paving the way for the implementation of this function directly into the ballast circuit board.
Keywords: Acoustic resonance, Envelope Detection, High-frequency Electronic Ballast, Metal Halide Lamps, Energy Efficiency, Real-time Dynamic Control, Electronics
La lampe à iodure métallique est une des sources lumineuses de haute performance les plus compactes qui soit. En raison de leur bon indice de rendu des couleurs et de leur haute efficacité lumineuse, ces lampes sont souvent préférées dans les endroits où la couleur et l'efficacité sont importantes, comme les supermarchés, les gymnases, les patinoires et les arènes sportives. L’inconvénient majeur de ce type de lampe à iodure métallique vient d’un phénomène appelé « résonance acoustique ». Lorsqu’il se produit, la lumière scintille, l’arc au centre de la lampe se met à fléchir et à tourner. Cela peut aller jusqu’à l'extinction de la lampe et, dans le pire des cas, à l’explosion du tube lorsque les lampes fonctionnent dans certaines bandes de fréquence.
Cette thèse se situe dans le contexte du développement de ballasts électroniques incorporant des mécanismes robustes de détection et d'évitement de résonance acoustique. À cette fin, plusieurs méthodes de détection d'enveloppe telles que le circuit multiplicateur, le circuit redresseur et l'amplificateur à verrouillage de phase sont proposées pour caractériser les fluctuations de la résonance acoustique et mieux les détecter. Des critères statistiques basés sur l'écart-type de ces fluctuations ont été établis pour détecter la présence de résonances acoustiques et les classer suivant leur gravité.
Les critères proposés permettent de différencier les cas sans résonance acoustique et avec présence de résonance acoustique dans un plan bidimensionnel ou en utilisant des intervalles de confiance. Cette analyse temporelle est confirmée par l’étude des variations du spectre optique et des paramètres colorimétriques. Leurs écarts-types relatifs sont également corrélés à la présence de résonances acoustiques. Les résultats de cette étude montrent que les variations de l'enveloppe de tension ou les variations du spectre et des paramètres colorimétriques sont fortement influencées par les phénomènes de résonance acoustique
Un ensemble de lampes à iodure métallique de différents fabricants et avec des puissances différentes a été testé dans nos expériences. Nous avons conclu que les circuits à multiplicateurs et à redressement permettent de détecter les résonnances acoustiques avec le même niveau de sensibilité que le système à verrouillage de phase, ouvrant la voie à l’implantation de cette fonction directement au niveau du circuit du ballast.
Mots Clés : Résonance acoustique, Détection d’enveloppe, Ballast électronique haute fréquence, Lampes à iodure métallique, efficacité énergétique, contrôle dynamique temps réel, électronique de puis
This work was developed in “Commande et Diagnostic des Systèmes Electriques (CODIASE)” and “Lumière et Matière (LM)” research groups of LAboratoire PLAsma et Conversion d’Energie (LAPLACE), Université de Fédérale Toulouse Midi-Pyrénées, Toulouse, France. The scholarship of Ph.D. for Fang LEI is supported by China Scholarship Council (CSC).
To achieve this thesis, except my efforts, I also got a lot of assistance, support and encouragement from so many people. I would like to thank all of them for their contributions to my work.
Firstly, I would like to express my sincere appreciation and gratitude to my supervisors, Prof. Pascal MAUSSION, Prof. Georges ZISSIS, and Dr. Pascal DUPUIS, for their guidance, encouragement, and support during my study. Their extensive knowledge, creative thinking, and rigorous science attitude influence me through my research and all my life.
I would like to thank the jury: Prof. Mounsif ECH CHERIF EL KETTANI (reviewer), Prof. Babak NAHIDMOBARAKEH (reviewer) and Prof. Betty SEMAIL (examiner). Thanks a lot for them reviewed and checked my thesis.
I would like to say thanks to all the members of my groups, such as Stéphane CAUX, Maurice FADEL, Antoine PICOT, Maria PIETRZAK-DAVID, David BUSO, Laurent CANALE, Manuel LOPES, etc. It is my pleasure to meet and work with them.
I would like to specially thanks to the technician Mr. Olivier DURRIEU. He gave me a lot of favorable guidance and professional suggestions on how to do the experiment and debug electrical circuits. Without his assistance and guidance, I could not finish my experiment well.
I would like to thank all dear my colleagues: Andrea VERDICCHIO, Benedikt BYRNE, Clément FILLEAU, Joseph FABRE, Kamil MROZEWSKI, Thomas GENEVE, Youssef DRIMZI, Lucille KUHLER, Kuljaree TANTAYAKUL, Tianyi LIU, Jingyi WANG, Wencong ZHANG, Feng TIAN, Qiankun SU. It is nice to meet them in this beautiful city, Toulouse. With them, I had a colorful and wonderful life during those three years.
I would like to thank CODIASE and LM groups of LAPLACE laboratory, Université de Fédérale Toulouse Midi-Pyrénées, which provided a wonderful academic environment to study and do research work.
Specially thanks to CSC, which gave a chance to study in France and offer me financial support.
Last but not least, I offer my deepest gratitude to my family, my parents, sisters, and brother, particularly to my parents and boyfriend for their trust, love, and support.
Toulouse, 23th November 2017 Fang LEI
General Introduction ... 1
State of the Art ... 5
Background ...7
General summary of light source ...7
1.2.1 Electromagnetic spectrum and light ...7
Light sources metrics ...9
1.2.2 Different types of light sources ...16
Incandescent lamp ...17
Gas discharge lamp...17
Solid state light source...22
Comparisons of different lamps ...23
Ballast ...24
1.3.1 Electromagnetic ballast ...24
1.3.2 Electronic ballast...25
Low-frequency square-wave electronic ballast ...25
High-frequency electronic ballast ...26
1.3.3 Comparison between electromagnetic ballast and electronic ballast ...27
Review of previous research about acoustic resonance ...28
Thesis key points ...31
References ...34
Acoustic Resonance in High-Intensity Discharge Lamps ... 39
Introduction ...41
Phenomenon of acoustic resonance ...41
Theory of acoustic resonance ...42
2.3.1 Wave equations and their solutions...42
2.3.2 An example of AR frequency calculation ...45
AR theoretical frequencies versus AR experimental frequencies ...45
Simulation of three fundamental AR frequency modes ...46
2.3.3 Power threshold in high-intensity discharge lamps ...50
Methods for acoustic resonance detection ...52
2.4.1 Electrical methods...52
Observed variations of electrical parameters ...52
Low-frequency voltage fluctuations (Voltage envelope) ...53
Changes of electrical parameters ...54
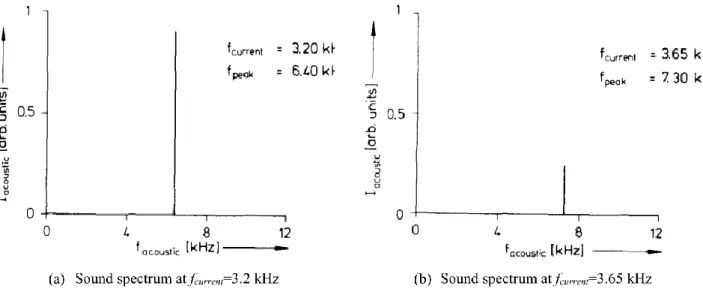
FFT of lamp current fluctuation ...55
Arc motion and light flicker ...57
Optogalvanic method...60
2.4.3 Sound spectrum...61
2.4.4 Temperature variations ...62
2.4.5 Comparisons between different acoustic resonance detection methods ...64
Methods for acoustic resonance avoidance ...65
2.5.1 Changing lamp related parameters (AR-free frequency) ...65
2.5.2 Operation supply of ballast ...66
DC-type ballast ...66
Low-frequency square wave electronic ballast ...66
Extra-high frequency electronic ballast ...66
2.5.3 Spread power spectrum ...66
Frequency modulation ...66
Injecting adjacent frequency ...68
2.5.4 Comparisons of acoustic resonance avoidance methods ...68
Advantages of acoustic resonance ...69
2.6.1 Arc straightening ...69
2.6.2 Color mixing for HID lamps operated vertically ...69
2.6.3 Strength test of arc tube and outer bulb ...70
Conclusions ...70
References ...70
Online Acoustic Resonance Detection and Electrical Modeling of Lamp
Voltage in Metal Halide Lamps ... 73
Introduction ...75
Circuit of the high-frequency electronic ballast ...75
3.2.1 Main circuit ...75
3.2.2 Ignition methods ...76
Lamp ignited by a transformer ...77
LCC circuit with frequency sweeping ignition for metal halide lamps in our experiment ...77
Experimental set-up at Laplace N7 ...79
Online envelope detection for acoustic resonance ...79
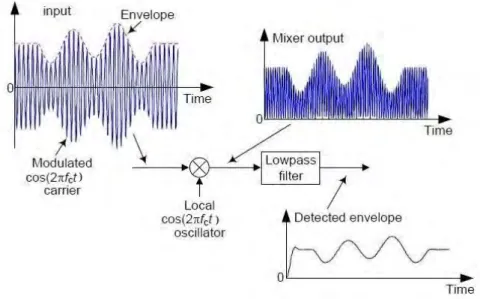
3.4.1 Principle of envelope detection ...79
Synchronous envelope detection (Multiplier circuit) ...80
Asynchronous full-wave envelope detection (Rectifier circuit) ...81
Synchronous complex envelope detection (Lock-in amplifier) ...82
3.4.2 Principle of synchronous voltage envelope detection...82
Mathematical model of amplitude modulation for synchronous envelope detection ...83
Schematic of detection circuit and test bench ...85
AR real-time detection with the proposed multiplier circuit ...86
3.4.5 Rectifier envelope detection for acoustic resonance ...89
Schematic of detection circuit ...89
AR Real-time detection with proposed rectifier circuit ...89
Characterizations of voltage envelope ...91
Electrical modeling of lamp voltage in presence of acoustic resonance ...92
3.5.1 Principle of lamp voltage modeling ...92
Amplitude modulation ...92
3.5.2 Electrical modelings of acoustic signals and acoustic resonance detection ...93
Periodic acoustic signal with acoustic resonance ...94
Stochastic acoustic signal with acoustic resonance ...95
Lookup table of lamp voltage in the presence of acoustic resonance ...96
Summary of acoustic resonance characterizations ...97
Conclusions ...99
References ...100
Statistical Method for Acoustic Resonance Characterization in Metal
Halide Lamps ... 103
Introduction ...105
Experimental set-up at Laplace UPS ...105
Statistical characterization of acoustic resonance using commercial devices ...106
4.3.1 Data acquisition of voltage envelope and spectral variations ...107
LabVIEW program in our experiment...107
Data acquisition of voltage envelope...108
Data acquisition of spectral variations (spectral irradiance and colorimetric parameters) ...108
Spectral variations and detection principle ...109
4.3.2 Statistical analysis of voltage envelope detection ...110
Two-dimensional plane of voltage envelope standard deviation versus average voltage envelope 110 Boxplot of voltage envelope and voltage envelope waveform ...113
Histogram of voltage envelope ...117
Analysis of variance of voltage envelope ...119
Results Inter-comparison ...123
Conclusions of voltage envelope using statistical analysis methods ...124
4.3.3 Statistical analysis of spectral variation detection ...124
Standard deviation and relative standard deviation in the spectral irradiance ...125
Correlation between voltage envelope detection and light spectral variation detection ...137
4.4.1 Standard deviation of voltage envelope versus colorimetric parameters ...137
Validations of our online detection methods with respect to the lock-in amplifier ...139
4.5.1 Experimental result comparisons between different detection methods ...139
4.5.2 Simulation results between different detection methods ...140
4.5.3 Comparison between voltage envelope detection and spectral variation detection ...145
Conclusions ...146
References ...147
General Conclusion and Perspectives ... 149
Conclusions ...151 Perspectives ...152
Annexes ... 153
List of Figures ...155 List of Tables ...159 List of Publications ...161HID - High Intensity Discharge
MH - Metal Halide
HPS - High Pressure Sodium
HPM – High Pressure Mercury
CFL - Compact Fluorescent Lamp
LED - Light Emitting Diode
OLED - Organic Light Emitting Diode
CRI - Color Rendering Index
CCT - Correlated Color Temperature
LFSW - Low Frequency Square Wave
AR - Acoustic Resonance
STD - Standard Deviation
RSD - Relative Standard Deviations
ANOVA - Analysis of Variance
CIE - International Commission Illumination
UCS - Uniform Chromaticity Scale
SPD - Spectral Power Distribution
RFI - Radio Frequency Interference
EMI - Electromagnetic Interference
LCD - Liquid Crystal Display
FFT - Fast Fourier Transform
CCD - Charge Coupled Device
SNR - Signal to Noise Ratio
Metal halide (MH) discharge lamp is one of the most compact high-performance light sources with direct electrical-to-visible conversion efficiency up to 35%–55% [1]. As result of good color rendering index (CRI>90) and high luminous efficacy (up to 150 lm/W), MH lamps are widely used in locations where color and efficacy are important, such as retail stores, factories, gymnasiums, and sporting arenas. Furthermore, in situations requiring producing a large amount of lumen (scenery lighting, plant growth …), LED-based luminaires are commercially available with similar characteristics but at a higher cost. Therefore, because of economic incentives, MH lamps will be kept as legacy devices for at least one decade.
Because of the negative impedance, MH discharge lamps are always supplied by ballasts to limit the current. High-frequency electronic ballasts with half-bridge inverter increase lamp-ballast efficiency, leading to increased energy efficiency and lower costs, compared to the low-frequency square-wave (LFSW) ballasts with full-bridge inverter [2], [3]. Additionally, high-frequency ballasts present a reduced hysteresis area [4].
A disadvantage of this ballast of high-frequency lamp operation is the occurrence of acoustic resonance (AR) for frequency bands above 1 kHz region [5]. AR can cause lamp arc distortion, rotation, extinction and in the worst case, lamp explosion [6], [7], [8]. Obviously, AR hinders the development of MH lamps and ballasts, and gives unknown risks or may increase the higher cost for lamps end-users’ due to lamp destruction.
AR is excited when the lamp power frequency is close to the eigenfrequency of the arc tube and the excitation energy is over the threshold energy [9]. The common explanation for this phenomenon is that standing pressure waves are generated in the gas of the arc tube such as those which occur in organ pipes and other musical instruments [10], [11]. Another explanation is that acoustic streaming results in the occurrence of AR. An acoustic flow develops in the standing wave caused by an inhomogeneity of the acoustic field [12].
Since the 1960s, researchers have studied the AR phenomenon. However, AR is a multi-physic problem relevant to several disciplines: electrical, electronics, electromagnetic, chemical to mention a few. Up to now, AR understanding is far from complete. Nevertheless, there is an incentive in using high intensity discharge (HID) lamps at higher frequencies, as the plasma I-V behavior comes close to a pure resistance load, leading to a reduction of hysteresis losses and higher lamp efficiencies.
The first essential point for AR phenomenon is to use simple and online methods to detect it. Many methods already were developed by researchers, which can be categorized into three groups [13]: optically, electrically and other physical parameters such as sound emission and temperature profile. However, most of the methods are not online detection, and some of them are difficult to fulfill.
On the other hand, AR also affects the spectral irradiance and color properties of lamps. Nevertheless, there is no literature investigated how the AR phenomenon influences on the spectral irradiance and colorimetric parameters (spectral variations) in HID lamps.
Based on those reasons, this thesis will mainly focus on:
1) Online AR envelope detection methods with high sensitivity;
2) Voltage envelope characterizations of AR by using statistical analyses based on envelope detection results;
3) How AR does influence on spectral variations by using some statistical analyses.
Online detection methods are aiming at providing simple and high sensitivity AR detection in order to control AR phenomenon, contributing to design high-frequency electronic ballasts for energy savings. Statistical methods are used to analyze AR characterizations in order to understand this phenomenon further.
Chapter 1: The aim of this chapter is to introduce the framework about light sources, ballasts and AR phenomena and the relationships between them. The electromagnetic spectrum and light are defined first, and then different lamps and their emitting principles are presented as well, especially for HID lamps. Electromagnetic ballasts, low-frequency square wave electronic ballasts and high-frequency electronic ballasts are presented. We also compare the advantages and disadvantages of different ballasts. The previous researches about AR occurrence in HID lamps are reviewed. The key points and main work of this thesis are presented lastly.
Chapter 2: This chapter focuses on AR phenomena occurring in HID lamps. Different AR phenomena and the AR mechanism are reviewed. We then give an example of AR theoretical frequencies in one kind of our tested lamps, and the pressure variations in longitudinal, radial and azimuth modes are simulated in MATLAB as well. Although AR theoretical frequencies can be calculated, these frequencies depend on the tolerance of manufacture. Therefore, AR detection and avoidance methods are essential for HID lamps. We review different detection and avoidance methods, compare the methods presented in literature with our proposed methods, and give the advantages and disadvantages of each method. Finally, AR benefits are summarized as well.
Chapter 3: Our high-frequency electronic ballast is introduced. The simplified model of this ballast is described as well in order to analyze the lamp ignition. AR causes low-frequency fluctuations on plasma arc in HID lamps, resulting in fluctuations in the lamp voltage and current. The lamp voltage waveform with occurrence is similar to the signal with a double-sideband amplitude modulation. Different envelope detection methods and their implementation are analyzed in detail. Then, we propose two simple online envelope detection methods implemented by a multiplier circuit and a rectifier circuit. Those methods are easily embeddable into the ballast board at low cost and can fulfill the real-time detection. Lastly, the electrical modelings of the lamp voltage in the presence of AR are built in PSIM. Our proposed methods and simulations could help ballast designers to design ballasts with better performance for AR detection and avoidance.
Chapter 4: We propose two kinds of lab methods for physical measurements. A lock-in amplifier is applied to measure lamp voltage fluctuations. Then, different statistical methods are proposed to analyze AR characterizations and classify AR and no AR based on the standard deviation (STD) of the voltage envelope. The proposed criteria enabling to classify AR versus no AR cases use a two-dimensional plane plot, a boxplot, a histogram or an analysis of variance (ANOVA). In addition, the spectral variation detection (the variations of the spectral irradiance and colorimetric parameters) are presented as well. AR shifts the chemical balance in the arc tube, resulting in some variations in the spectral irradiance and colorimetric parameters, such as chromaticity coordinates and correlated color temperature. The STDs and the relative standard deviations (RSDs) of the spectral irradiance and colorimetric parameters are calculated to evaluate these variations. Finally, we analyze the correlation between lamp voltage variations and spectral variations. We also compare our online detection methods with the lab methods and give advantages and disadvantages of different detection methods.
This thesis will end with the general conclusion and perspectives. In this part, the conclusions are summarized in each chapter. At last, the future works are anticipated in this domain.
Background
Nowadays, lighting consumption represents about 15% of annual world energy. In France, the overall electricity consumption of lighting is 56 TWh which accounts for 12% of French electricity consumption [14]. Although the global energy consumption is still rapidly growing [15], relative part of lighting consumption is slowly decreasing thanks to the wide LED adoption. Outdoor lighting, especially for roadways, is the main power consumption of public lighting and is also one of the most important areas particularly for safety. To meet the requirement of saving energy internationally, lighting research becomes more and more urgent to human society [16]. Thanks to much higher luminous efficacy, better color rendering index and longer lifetime than fluorescent lamps, high-intensity discharge (HID) lamps are used for commercial and industrial applications such as street lighting, plant growth, and stage lighting, etc.
HID lamps are a type of electrical gas-discharge lamp and produce light by striking an electric arc across tungsten electrodes housed inside a specially designed inner fused quartz or fused alumina tube [17]. This tube is filled with both gas and metals. The gas helps start the lamps. The metals produce the light once they are heated to a point of evaporation, forming a plasma.
Metal halide (MH) lamps regard as one kind of the most efficiency lamps in HID lamp family. The recent emergence of MH discharge lamps with ceramic arc tubes has led to a new generation of highly efficient light sources with higher color rendering index up to 93 that result in an improved perception. Like fluorescent lamps, MH lamps present the negative impedance characteristic and thus need auxiliary circuit namely “ballasts” to ensure steady lamp operation [18]. Compared to conventional magnetic ballasts, electronic ballasts have a smaller volume, lighter weight, higher efficiency and can dim lamps easily. Thus, they are widely used and developed.
There are mainly two kinds of electronic ballasts: low-frequency square wave ballast (LFSW) and high-frequency ballast. In the case of discharge lamps, half-bridge inverter ballasts increase system efficiency, leading to lower operating costs [19], [20]. Traditional LFSW ballasts with full-bridge inverter presents higher cost in this respect. However, acoustic resonance (AR) occurs in MH lamps operating at the high-frequency electronic ballast. The AR phenomenon that leads to lamp arc distortion, flickering and sometimes destruct the lamp’s tube [6]. The AR phenomenon brings the risk for lamps and hinders the development of ballasts and lamps. Therefore, it is essential to study the AR phenomenon, so as to avoid it.
The AR phenomenon is due to the development of standing acoustic wave in the lamp arc tube. However, the interaction between this acoustic wave and the arc is still poorly understood, particularly their impacts on the arc shape. Consequently, the mechanism of the AR phenomenon and AR characterizations need to be studied further.
To harness uncontrollable growth in energy demand of lighting system in the next years, developing high-frequency electronic ballast systems for MH lamps is a good choice. Developing these systems implies that we must solve AR phenomena first. Therefore, it is crucial to adopt innovative solutions and advanced diagnosis systems to track the operation state and AR characterizations in MH lamp.
General summary of light source
1.2.1
Electromagnetic spectrum and light
Light is a certain portion of the electromagnetic (EM) spectrum, which ranges from radio waves to gamma rays. The EM spectrum is the range of all types of EM radiation, as shown in Fig. 1-1. EM radiation can be described as a stream of photons, each traveling in a wave-like pattern, carrying energy and moving at the speed
of light. The difference between radio waves, visible light, and gamma rays is the energy of the photons. Radio waves have photons with the lowest energies. Gamma rays have the highest energies. The amount of energy a photon behaves like a wave, or more like a particle. This is called the “wave-particle duality” of light. Low energy photons (such as radio waves) behave more like waves, while higher energy photons (such as gamma rays) behave more like particles.
EM radiation with respect to wavelength
Type of radiation Wavelength (nm)
Gamma rays < 0.01 X-rays 0.01 – 10 Ultraviolet 10 – 380 Visible light 380 – 780 Infrared 780 – 106 Microwave 106 – 109 Radio waves 109 – 1014
Visible light is a just small part of the EM spectrum extended from the wavelengths of 380 to 780 nanometers (nm). More generally, visible light is defined as the wavelengths that are visible to most human eyes [21]. The eye looks like photoreceptor, is sensitive to only a narrow band of the electromagnetic spectrum, this band corresponding to “visible light”. Two different kinds of detectors exist in our eyes: the cones that perceive color and necessitate a minimum illumination level and the rods that perceive grey levels corresponding to brightness. Fig. 1-2 illustrates brightness relative sensitivity of human eyes under photopic and scotopic vision conditions. The scotopic vision (dark-adapted response) corresponds to the eye response under low illumination level. The photopic vision (light-adapted response) represents the receptor’s sensitivity to high illumination level. The photopic vision is the only one concerning lighting design because eyes are “light-adapted” than “dark-adapted” under the most illumination levels produced by the manmade light.
Light sources metrics
The basic parameters for measuring light are as follows: Source efficiency and luminous efficacy
The efficiency of a source is defined as the percentage of electrical power converted into radiation, and the luminous efficacy is described as the percentage of power or energy converted to visible radiation. The efficacy is measured in lumens per watt, and the theoretical maximum is 683 lm/W if all the electricity is converted into radiation with a wavelength corresponding to the maximum sensitivity of the eye at 555 nm [25].
Luminous flux
The luminous flux (
Φ
) describes the quantity of light emitted per second from a light source and the unit is lumen. The lumen flux is usually measured in an integrating sphere, where the light is diffusely reflected by inner walls. Each unit surface of the sphere is illuminated proportionally to the flux of the light source, and a small window collects and measures the luminous flux.The surface of a sphere is 4 r 2, where r is the radius of the sphere, so the solid angle is: 4 ( sterad)
(1-1)
The solid angle of a surface A is defined as:
2 /
A r
(1-2)
The luminous efficiency is the ratio of the luminous flux to the electrical power consumed (lm/W). It is a measure of a light source’s economic efficiency.
Luminous intensity
The luminous intensity (I) is defined as the flux of light emitted per second in a particular direction and its unit is the candela (cd=lm/sr). It is measured by a goniophotometer as follow:
/
I
(1-3)The luminous intensity of monochromatic light of wavelength λ is given by:
683 ( )
eI
y
I
(1-4)e
I is the radiant intensity in watts per steradian (W/sr);
y
( )
is the standard luminosity function. If more than one wavelength is present), the luminous intensity is described as:0 ( ) 683 ( ) dIe I y d d
(1-5) IlluminanceIlluminance (E) is defined as the amount of light incident on a unit area and the unit of measurement is the lux (lx=lm/m2). Illuminance is measured by photometers that convert light (photons) into current, applying the
weighting of Fig. 1-2 (Lux meter).
/
E
A
(1-6)where A is the area of incidence. Luminance
Luminance (L) is a photometric measure of the luminous intensity per unit of viewing area of light traveling in a given direction. It is defined as the amount of light that passes through, is emitted or reflected from a particular area, and falls within a given solid angle. The unit of luminance is candela per square meter (cd/m2). Luminance
is the only basic lighting parameter that is perceived by the eye. It describes a light source’s impression of brightness on a surface and therefore depends to a large extent on the degree of reflection (color and surface). The luminance of a specified point of a light source, in a specified direction, is defined as:
2
cos
d
L
d d
(1-7)where L is the luminance (cd/m2); d 2 is the luminous flux (lm) in the area d in any direction contained inside the solid angle d; d is an area (m2) of the source at specified point;d is an solid angle (sr) at specified direction; is the angle between the normal n to the surface d in a specific direction. Fig. 1-3 illustrates the parameters for defining the luminance.
Colorimetric parameters
Color is used to describe the appearance of a visible stimulus within a certain spectral shape. The human eyes use three different kinds of cones to detect the color of blue, green and red of visible radiation. In this way, the spectral shape of visible stimulus is converted to three physiological signals. Some information is lost because a continuous spectral shape is described by only three numbers, defined as tristimulus values. Therefore, different spectra can be perceived as having the same color (metamerism). The tristimulus values can be calculated using color matching functions, which implicitly contain the relative sensitivity of the three cones in the human eye. To calculate the tristimulus values, the spectrum should be multiplied by the corresponding color-matching function, and then integrated over the whole wavelength range for visible radiation. When this theory was developed, the color of a spectrum was supposed to be independent of the intensity. Thus, the total value of the tristimulus values is normalized to unity. The result of this normalization is that the color of a spectrum can be expressed by two quantities: the chromaticity coordinates. A diagram containing these two chromaticity coordinates is called a chromaticity diagram. The most frequently used chromaticity diagram is the one defined by the international commission illumination (CIE) in 1931 [27]. The chromaticity coordinates are defined as x and y in this diagram. As explained latter, this approach was revised in 1960 and 1976. Nevertheless, to avoid losing inter-comparison with previous data, characterizations in another color space are always accompanied by measurements in this one.
Chromaticity coordinate
CIE 1931 chromaticity coordinates x and y are calculated from the spectral power distribution (SPD) of the light source and the CIE color-matching functions Fig. 1-4 (a)).
x
( )
,y
( )
, andz
( )
color-matching functions give the tristimulus value X, Y, and Z.( ) X
px d (1-8) ( ) Y
py d (1-9) ( ) Z
pz d (1-10)where p is the SPD of the light source. From X, Y, and Z, the chromaticity coordinates x, y, z can be obtained as follows: X x X Y Z (1-11) Y y X Y Z (1-12) 1 Z z x y X Y Z (1-13)
Using x, y as the coordinates, a two-dimensional chromaticity diagram (the CIE 1931 color space diagram) can be plotted as shown Fig. 1-4 (b).
In Fig. 1-4 (a), the color matching function 𝑦̅() is equal to the overall sensitivity of the eye for visible radiations. In Fig. 1-4 (b), the x and y values of the monochromatic stimuli are plotted. The color of monochromatic stimuli and the color of the mixture of these stimuli are shown as well. The spectral locus, the boundary, and the blackbody locus comprise the chromaticity diagram.
The CIE 1976 uniform chromaticity scale (UCS) diagram was defined by the CIE in 1976, as illustrated in Fig. 1-5. It is intended to provide perceptually more uniform color spacing for colors at approximately the same luminance. The values of u' and v' can be calculated from the tristimulus values X Y Z or from the chromaticity coordinates x, y according to the following formulas:
' 4 4 15 3 2 12 3 X x u X Y Z x y (1-14) ' 9 9 15X 3 2 12x 3 v X Y Z x y (1-15) ' ' ( )' 2 ( )' 2 u v C u v (1-16)
where
C
u v' 'is the chroma; chroma is the colorfulness of an area judged as a proportion of the brightness of a similarly illuminated area that appears white or highly transmitting [29].Color temperature or correlated color temperature
Planck's law describes the spectral density of electromagnetic radiation emitted by a black body in thermal equilibrium at a given temperature T. When the temperature of the blackbody is sufficiently high, it will start emitting visible light.
In the CIE 1931 chromaticity diagram, the blackbody emission appears as a parametric curve depending on temperature, as shown in Fig. 1-4 (b). When the color point of a lamp is close to the blackbody locus in the chromaticity diagram, the temperature of the proximal point on the locus is called correlated color temperature (CCT). The dominant color of a blackbody is called its hue, i.e. the monochromatic wavelength obtained at the intersection of a line starting from the radiometric neutral white (equal-energy) and passing by the lamp color point. The hue is a function of temperature as illustrated in Fig. 1-6. The blackbody distribution is used as reference white for temperatures up to 5000 K. Above 5000 K, daylight becomes the reference with an associated CCT. Fig. 1-6 (a) plots the hue appearing for most of the lighting devices. It ends at 6500 K, which is the reference white for computer display. Fig. 1-6 (b) starts at 6500 K and those values are generally not found in light sources.
A blackbody with CCT below 3300 K contains a lot of energy in the near infrared. When exposed to this kind of source, humans will feel a sensation of heating in their skin; this is why such sources are called “warm”. As CCT increase, the near infrared content drops; such sources are called “cold” for CCT above 5300 K. This explains the apparent discrepancy where low CCT are called “warm” and high CCT are described as cold.
Color rendering index
Color rendering index (CRI) is a measure of how accurately the light source reproduces the colors of an object in comparison to a reference light source. The CRI value of 100 means the sample light source reproduces the color as the reference light source does. Therefore, the higher the value of CRI, the more it resembles the reference light source. When evaluating CRI, the reference light source is chosen to have the same correlated color temperature as the sample light source.
Reference light source:
1) Lower than 5000 Kelvin: Planckian radiator; 2) 5000 Kelvin and higher: CIE daylight.
Ra is called average color rendering index or general rendering index as well as the special color-rendering indexes R1-R15. The color-color-rendering index Ra of the different light source is shown in TABLE 1-2.
Average color rendering index Ra of different light source
Color rendering index Ra ≥90 80-89 70-79 60-69 40-59 20-39
Daylight ×
Incandescent lamp × ×
Compact fluorescent lamp × ×
Fluorescent lamp × × × × ×
Mercury vapor high-pressure lamp × ×
Metal halide lamp × × ×
Sodium vapor high-pressure lamp × × × ×
Spectral irradiance
The spectral irradiance is given as a function of wavelength
and gives the power (energy per unit time) received by the surface for a particular wavelength of light [32]. The spectral irradiance can be expressed by:( ) ( ) h c
F
(1-17)
where F( ) is the spectral irradiance in Wm-2µm-1;
is the photon flux in m
-2sec-1; h is Planck’s constant; cthe speed of light;
is the wavelength of the given photon in meter. For commodity, the photon number is often expressed in “moles” (1 mole = 6.022 * 1023 particles). Hence, the spectral irradiance can be determined as theFig. 1-7 shows the spectral irradiance for different light sources. The differences in spectra results from the differences in the light production mechanisms.
1.2.2
Different types of light sources
Light sources can be grouped into natural light sources and artificial light sources. The main artificial light sources are composed of thermal light sources (incandescent lamps), gas discharge lamps (Low-intensity and high-intensity discharge lamps) and semiconductor light sources (LED, OLED). Since Thomas Edison invented the first practical incandescent lamp in 1879, conveniences and advantages that were brought by the artificial light source are self-evident. It cannot be imaginable if our life does not have artificial light sources. Fig. 1-8 and Fig. 1-9 illustrate the families and the luminous efficiency of artificial light sources respectively.
According to Fig. 1-9, we can see that HID lamps have higher luminous efficacy than incandescent and fluorescent lamps. Since 2009, white LED and OLED lamps are improved greatly and the luminous efficacy of these two kinds lamps increases sharply, especially for LED lamps. This means that LED lamps are the development trend of light sources in the future. However, HID lamps take the main place in the market currently. Therefore, HID lamps still have research and use value.
Incandescent lamp
The incandescent light bulb or incandescent lamp is a thermal radiator. It is an electric light by heating a filament in the lamp to a high temperature so that it glows with visible light. The incandescent lamp is the second form of electric light to be developed for commercial use after carbon arc lamp. It is also the second most used lamp in the world except the fluorescent lamp. The incandescent lamp has good color rendering index (100), cheap price, and no quantity of toxic materials inside arc tube. However, it just can convert 10% of its energy to the visible light, 90% of the energy going to heat. Therefore, it is replaced by the fluorescent lamp. Fig. 1-10 shows the first incandescent light bulb and typical structure of the incandescent lamp.
Gas discharge lamp
The gas discharge lamp is an artificial light source that produces light by creating an electrical discharge through an ionized gas, a plasma [36]. This kind of lamps uses a noble gas (argon, neon, krypton, and xenon) or a mixture of these gases. Some contain additional materials, such as mercury, sodium, and metal halides, which are vaporized during startup to become part of the gas mixture.
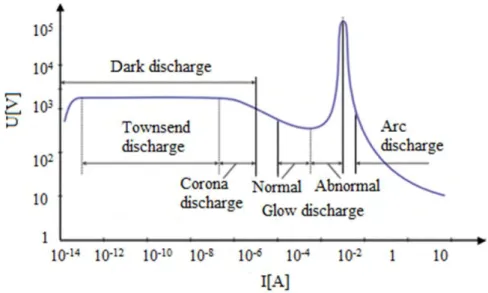
The V-I characteristics of gas discharge
Fig. 1-11 shows the V-I characteristics of self-sustained discharges. The V-I characteristics are composed of three regions: dark, glow and arc discharge. The dark discharge contains the Townsend and corona discharge. At this region, the low current is up to 10-4 A and voltage is over kilovolts. There is no significant luminance here.
The glow discharge includes normal and abnormal mode. It owes its name to the luminous glow of the plasma. Glow discharge is widely used as a source of light such as neon lights, fluorescent lamps, and plasma-screen televisions. The current is from 10-4 A to 10-1 A in the glow discharge.
The arc discharge can produce an ongoing electrical discharge. It is characterized by a lower voltage than the glow discharge and relies on thermionic emission of electrons from the electrodes sustaining the arc. Normally, the higher currents are over 10-1 A in a plasma during the arc discharge.
Types of gas discharge lamp
Gas discharge lamps can be categorized into two groups: low pressure and high-pressure discharge lamps. Low-pressure gas discharge lamps contain fluorescent lamps and low-pressure sodium lamps. High-pressure mercury lamps, metal halide lamps, and high-pressure sodium lamps are high-pressure gas discharge lamps, also called HID lamps. The term high-intensity discharge means a high-power density. For most of HID lamps, the arc tubes are enclosed in outer glass bulbs.
Compared to incandescent lamps, fluorescent lamps have much higher luminous efficacy (up to 100 lm/W) and they are widely used in the indoor environment. Because of much higher luminous efficacy (up to 140 lm/W), better color rendering index (up to 93), HID lamps are applied for the outdoor environment.
Fluorescent lamp
The fluorescent lamp or the fluorescent tube is a low-pressure mercury-vapor gas-discharge lamp that uses fluorescence to produce visible light. It is a cylindrical glass tube that is coated on the side with phosphors. It is composed of mercury and is filled with a small amount of argon, a combination of argon and neon or krypton gases. When it operates, some current passes through the lamp and the mercury is vaporized, producing ultraviolet light. Then the phosphor coating absorbs the ultraviolet light and radiates it as visible light. The fluorescent lamp needs starters and ballasts to start and limit current.
The compact fluorescent lamp (CFL) is a type of fluorescent lamp, also known as a compact fluorescent light or energy saving light. Compared to the incandescent lamp giving the same amount of visible light, the CFL uses less power and has a longer lifetime. For example, the incandescent bulb consumes anywhere from 4 to 8 times as much power to generate same amount light, and the lifetime is just 10% of the fluorescent lamp. Much of the wasted power in incandescent bulbs turns to heat. Fig. 1-12 shows two kinds of fluorescent lamps.
The ballast is used to limit the current after lamp ignition. To start the lamp, there must be a high voltage spike to start the arc because of the high resistance of argon itself. To make the lamp work safely, preheat the lamp is figured out by using a starter switch. Recently, several approaches such as preheat, instant start, rapid start, semi-resonant start and programmed start are applied to start the lamps [40]. Fig. 1-13 shows the basic structure and operation principle of a fluorescent lamp.
High-pressure mercury lamp
High-pressure mercury lamps are gas discharge lamps which use an electric arc through vaporized mercury to produce light [42]. Fig. 1-14 shows the structure of a high-pressure mercury lamp.
In Fig. 1-14, an arc tube inside the lamp bulb is made of quartz, with two tungsten electrodes at the ends. The tube contains a few milligrams of mercury and about 25-50 torr of pure argon as a buffer gas [44]. An auxiliary starting electrode is mounted next to one of the main electrodes to help lamp ignition. Generally, the arc discharge is confined to a small fused quartz arc tube mounted within a larger glass bulb. The aim is to produce a bright white and bring a relatively long life.
Mercury vapor lamps produce white light with bluish-green because most chemicals inside arc tube are mercury. Thus, mercury lamps cannot be used in some applications which need high color rendering index properties such as shops, schools, hospitals and so on. In recent years, color rendering index of mercury lamps has been improved by using a phosphor inside of the outer bulb that emits better white light.
High pressure sodium lamp
High-pressure sodium (HPS) lamps produce light by an electric discharge through mixed vapors of mercury and sodium, with the sodium radiation dominating the spectral emission. The HPS lamp is one kind of HID lamps, which is used in industrial lighting especially in large manufacturing facilities and plant growth areas. It is also widely used for outdoor area lightings, such as highway roads, parking lots, and security areas. The HPS lamp is regarded as the most ubiquitous for street lighting on the planet because of good efficiency (up to 140 lm/W) and long lifetime (up to 40000 hours). The HPS lamp contains a narrow arc tube supported by a frame in a bulb. There is a higher pressure inside the arc tube to achieve a great efficiency. Sodium, mercury, and xenon are composed of the inside the arc tube. The arc tube is made of aluminum oxide ceramic which is resistant to the corrosion of alkalis like sodium. The HPS lamp starts an arc through xenon gas by a high voltage pulse via a ballast. Then the arc heats up the mercury. Finally, the sodium is vaporized (over 240 °C). The mercury helps produce a blue light which is added to the pure yellow of the sodium. The sodium is mixed with other impurities to achieve a nice white light.
Metal halide lamp
Metal halide lamps are also one kind of HID lamps. Because their light-emitting materials of the inside arc tube are filled with several metal halide salts such as dysprosium iodide (DyI), thulium iodide (TmI), holmium
iodide (HoI3), thallium iodide (T1I), sodium iodide (NaI). Thus, they are called metal halide lamps. While the
buffer gas and the starting rare gas are formed of mercury and argon. Gas discharge works through excitation of the metal halide salts and the mercury is excited by the current flow. The mixture of the visible radiation of the different elements results in the designed CCT and CRI for the lamps. Comparing with HPS lamps, MH lamps have excellent color rendering qualities. As one of the most efficient white light sources with higher CRI (up to 93), they are used for wide area overhead lighting of commercial, industrial and public spaces as well as residential security lighting and automotive headlamps. MH lamps consist of a fused quartz or ceramic arc tube that has the gases and the arc, enclosed inside a larger glass bulb that has a coating to filter out the ultraviolet light produced. They work at a high pressure between 4 and 20 atmospheres and need ballasts to start. Fig. 1-16 illustrates different arc tubes of MH lamps.
Electrodeless lamp
Electrodeless lamps are also called induction lamps which are a kind of gas discharge lamps and there are no electrodes and light filament inside. Electrodeless lamps are based on a technology that is different from that of traditional light sources. They produce light by using an electromagnetic field to excite mercury particles mixed in a noble gas like argon or krypton [49]. The mercury creates a UV light and a phosphor on the inside of the tube filters the energy to visible light. This emitting principle is similar to fluorescent lamps. However, they do not consist of electrodes in the tube. These lamps have three parts: frequency generator (ballast), discharge tube and electromagnet. Fig. 1-17 illustrates the structure of an electrodeless lamp.
This kind of lamps has some advantages, such as long lifespan (25000 to 100000 hours) due to the lack of electrodes, high luminous efficacy 62 to 90 lm/W, and “Instant-on” and “hot re-strike” unlike most HID lamps. Electrodeless lamps also are environmentally friendly due to use of less energy and less mercury than the traditional lamps. Nevertheless, some of these lamps operated very high frequency, which can produce radio frequency interference (RFI) that interferes with radio communications in the area [50]. Due to intellectual property barriers, the makers of those lamps do not have access to HIGH-CRI fluorescent powders. Consequently, the CRI of commercial devices is currently in the range of 70 to 80.
Solid state light source Light emitting diode
In some semiconductors, during the recombination process of electrons with holes at the junction of n-doped and p-doped semiconductors, energy is released in the form of light.
The light emitting diode (LED) is a monolithically integrated P-N semiconductor device that emits light when voltage is passed across its two terminals. A P-N junction can also convert absorbed light energy into a proportional electric current. The same process is reversed here (i.e. the P-N junction emits light when electrical energy is applied to it). This phenomenon is generally called electroluminescence, which can be defined as the emission of light from a semiconductor under the influence of an electric field. Fig. 1-18 shows the structure of the LED.
Organic light emitting diode
Organic light emitting diodes (OLEDs) are a relatively new technology for solid-state light sources. A typical OLED contains two organic layers: electron transport layer (ETL) and hole injection layer (HIL), embedded between two electrodes. The organic emitters are embedded between two organic layers. The top electrode is usually a metallic mirror with high reflectivity and the bottom electrode is a transparent indium tin oxide (ITO) layer on top of the glass substrate. Fig. 1-19 (a) illustrates the structure of the OLED.
OLEDs work in a similar way to LEDs, but instead of using layers of n-type and p-type semiconductors, they use organic molecules to create electrons and holes. When a voltage is added to the electrodes, the charges start moving in the device under the influence of the electric field. Then electrons leave the cathode and holes move from the anode in opposite direction. When these two charges meet, a brief burst of energy is released by in the form of a particle of light- a photon. Because this process happens many times, so OLEDs produces continuous light as long as the current keeps flowing.
OLEDs are the flat light emitting technology, which made by placing a series of organic thin films between two conductors. OLEDs are used to make digital displays and lighting. Because they can emit light, so they do not need a backlight. Comparing with liquid crystal display (LCD), OLEDs can display deep black levels and can be thinner and lighter. In a dark room, OLED screen can achieve a higher contrast ratio than LCD. Fig. 1-19
Comparisons of different lamps
Comparisons of different lamps [54]
Name Optical spectrum Efficacy (lm/W) Lifetime (MTTF) (hours) Color temperature (Kelvin) Dominant color Color rendering index
Incandescent Continuous 4–17 750-2000 2400–3400 Warm white (yellowish) 99
Fluorescent Line spectrum + Phosphor 52–100 (white) 20000 8000- 2700–5000 White (any color
temperature) 60–95
High pressure
mercury Line spectrum 40-60 10000-20000 4000-7000 bluish green White with 40-69
High pressure sodium Broadband (Pressure dependent) 55–140 10000-40000 1800–2200 Pinkish orange 0–70 Ceramic metal halide Quasi-continuous 50–150 6000-24000 3000–4500 White and saturated colors available 80–93
Electrodeless Line spectrum +Phosphor 70–90 (white) 80000–100000 2700-6000 Ditto (white) 70–80
LED
Die(s) emission and phosphor (white LED only) Up to 300 (Cree) [55] 35000–100000 2700-12000 Ditto Up to 95 (white)
According to the emitting principle, light sources can be categorized into three groups: thermal radiation, gas discharge, and solid-state lamps. Gas discharge light sources consist of low-pressure lamps and high-pressure lamps. Fluorescent lamps are one kind of low-pressure gas discharge lamps. Comparing with incandescent lamps, fluorescent lamps have much higher efficiency and better color properties. For a lot of outside lighting areas, HID lamps that consist of HPM, HPS and MH lamps surpass fluorescent lamps, no matter from efficacy and lifetime. TABLE 1-3 shows the characteristics of different lamps.
Ballast
Because of the negative impedance, discharge lamps need ballasts to stabilize them. The ballast is a device that is placed in line with the load in order to limit the amount of current in an electrical circuit. It can be viewed as a current source with finite impedance. For efficiency reasons, reactive devices are used to avoid supplemental power dissipation. Fig. 1-20 shows the impedance of discharge lamps.
As can be seen from Fig. 1-20 (a), as the voltage decreases, the current increases. This means that unless something can prevent it, the current will increase uncontrollably. In Fig. 1-20 (b), the current is stabilized between points a and b after adding a resistor in the lamp circuit. The solid line is the result of adding the negative resistance of the ballast (dotted curve) to that of the series resistor (dotted straight line).
Ballasts of gas discharge lamps have two functions to perform: supplying high voltage to start the lamp and limiting the current after lamp ignition. There are mainly two kinds of ballasts: magnetic and electronic ballasts (low-frequency square wave and high-frequency electronic ballast).
1.3.1
Electromagnetic ballast
Simple resistors can be used as current-limiting ballasts for gas discharge lamps, but they have many power losses. Inductive coils that have the same effect as a resistor can be used as ballast. These inductive ballasts are called “electromagnetic ballasts” because the electric and magnetic fields are generated by coils. Magnetic ballasts are “core-and-coil” electromagnetic ballasts wrapped with copper windings. They are heavier, bulkier,
less efficiency and lower power factor but cheaper comparing to the electronic ballast. Therefore, magnetic ballasts are gradually replaced by electronic ballasts. Fig. 1-21 shows the magnetic ballast and the lamp current and voltage supplying by the magnetic ballast.
In Fig. 1-21 (a), the magnetic ballast works accompanied by a starter. In Fig. 1-21 (b), the current waveform presents serious distortions. This characteristic causes a serious non-linear for the lamp I-V curve. Obviously, magnetic ballasts have a heavy weight, low efficiency, and low power factor.
1.3.2
Electronic ballast
Electronic ballasts use solid-state electronic components to provide the proper starting and operating electrical conditions to power discharge lamps. They use integrated circuit (IC) chips and feedback to implement better controls and safety features into ballasts. Electronic ballasts have higher efficiency than similar electromagnetic ballasts. They also are small size, lightweight, improved lumen maintenance, fault mode protection and better power regulation, which results in better color consistency.
The most common electronic ballasts can be categorized into two types: low-frequency square-wave and high-frequency electronic ballasts.
Low-frequency square-wave electronic ballast
Most commercial electronic ballasts are low-frequency square wave ballasts that are reliable, and almost no AR occurrence for their supplying lamps. However, they are low efficiency due to complicated structures. Low-frequency square-wave electronic ballasts are shown in Fig. 1-22.
In Fig. 1-22 (a), the commercial three-stage ballast consists of a PFC boost converter (an inductor Lboost a
switch Sboost, a diodes Dboost and a capacitor Cdc1), a buck converter (a switch Sbuck, a diode Dbuck and Cdc2) for
regulating lamp power, and a full-bridge inverter (switches S1, S2, S3 and S4) for supplying low frequency square
wave source. In Fig. 1-22 (b), the two-stage ballast consists of a PFC boost converter which is the same as the PFC boost converter in Fig. 1-22 (a), and a full-bridge inverter (an inductor Lbuck, a capacitor Cbuck and switches
S1, S2, S3, and S4) for supplying low-frequency square wave source as well.
Fig. 1-22 (c) illustrates the driving signals of the ballasts; the switches S1 and S2 operate at high frequency,
and the switches S3 and S4 operate at low frequency. When S1 and S3 are on, S2 and S4 are off, and vice versa. The
waveform for the lamp current and voltage are low-frequency square waveforms, as shown in Fig. 1-22 (d). The common low frequencies are 60 Hz, 120 Hz, and 400 Hz.
High-frequency electronic ballast
HID electronic lighting has now become a practical alternative to traditional magnetic-based technology. In particular, high-frequency electronic ballasts for HID lamps have proven to be technologically feasible and economically justifiable, while generating significant energy savings. Fig. 1-23 illustrates the schematic of the high-frequency electronic ballast, the waveforms of driving signals, and the lamp voltage and current.
As can be seen from Fig. 1-23 (a), the high-frequency electronic ballast has the simpler structure and the inverter is half-bridge inverter just contained two switches. Thus, it has better system efficiency and lower cost. The high-frequency electronic ballast also increases luminous efficacy by almost 10% when the lamp is driven at frequencies in excess of 2 kHz in an improved compact, lightweight package [62]. Nevertheless, AR may occur when HID lamps are operated at frequencies from several kHz to a few hundred kHz. The AR spectrum, unfortunately, always covers the frequency band suitable for the high-frequency electronic ballasts. AR can reduce the lamps’ lifetime and damage the ballasts or lamps. Therefore, the high-frequency ballasts must have the AR control circuit.
1.3.3
Comparison between electromagnetic ballast and electronic ballast
While magnetic ballasts are simple and easy to design, the more sophisticated electronic ballasts have too many advantages. In addition to not causing light flicker and noise like magnetic ballasts, electronic ballasts are preferred because they are smaller in size and weigh less. They are also great for the environment because of their higher energy efficiency. Additionally, electronic ballasts can be used in lamps that are in parallel and series mode. This means that if one of the lamps goes out, this will not affect the other lamps even though all the lamps are using the same ballast. TABLE 1-4 shows the comparison between the electromagnetic ballast and the electronic ballast.
Electromagnetic ballast versus electronic ballast
Type Electromagnetic ballast Electronic ballast
Electric energy
consumption 100 Reduced from 10 to 15%
Lamp lifetime 100 Increased up to 30%
depending on the light sources
Ignition time From 90 to 60 seconds to reach 90%
of the nominal luminous flux 50% quicker
Heat More Less
Noise Humming noise 100 Hz (magnetic constriction) No noise
Light fluctuations no perceived flickering but reported health effects No flickering
Size and weight Heavy and large size Lightweight and compact
Power factor 0.5-0.7 >0.95
Review of previous research about acoustic resonance
The phenomenon of AR was first reported by Campbell [63]. The research achievements about AR can be grouped into several categories as follows:
b) AR characterization
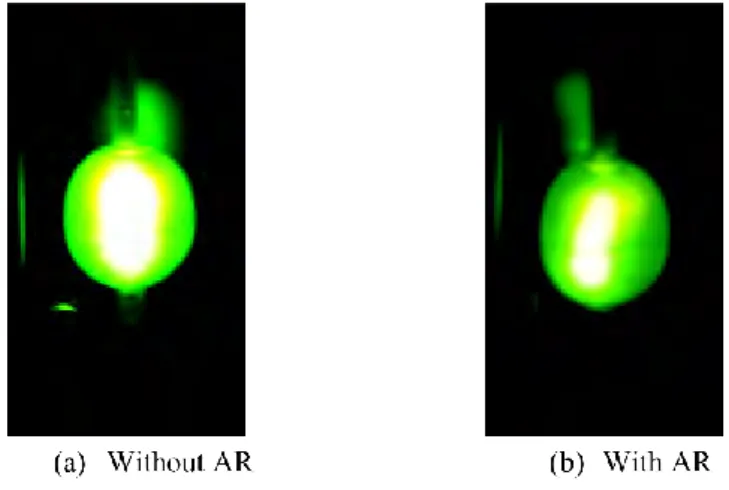
AR not only causes arc fluctuations, deformations, and light flicker but also changes chromaticity coordinates, and color temperature significantly [64]. As presented in the paper [6], AR can change electrical parameters, increasing the lamp voltage and decreasing the current. In the paper [65], AR can cause noisy sounds in arc tube of HID lamps. Overall, there is no doubt that AR hampers the development of HID lamps and reduces lamps’ lifetime. Fig. 1-24 and Fig. 1-25 show arc distortions in different kinds of HID lamps.
c) AR mechanism and theoretical frequencies
In the paper [12], the AR mechanism has been defined. Alternating electric current represents a periodic heat source in the arc tube. The resulting temperature fluctuations cause pressure oscillations. The ballasts operating at the eigenfrequency of the arc tube produces standing pressure waves, which affect the velocity field of the plasma and cause arc flicker. The other explanation of AR occurrence can be attributed to acoustic streaming.
According to the solution of the simplified acoustic wave equation, three kinds of AR frequency modes can be calculated in HID lamps: the longitudinal mode, the radial mode and the azimuth mode [68].
d) AR Detection
AR detection methods can be classified depending on how the AR is detected: measuring lamp electrical parameters (voltage, current, or relative impedance) [6], [8], [69], or observing other lamp physical parameters (sound emission, thermal parameters, or optical parameters) [2], [65], [70] .
e) AR avoidance
The main effect of AR excitation in the arc tube of HID lamps is the changes of the chemical and physical balance of filling materials. This basic phenomenon leads to fluctuations of electrical parameters, light instability, and light flickering.
Although certain free AR windows exist in HID lamps, due to the production tolerance or aging time of lamps, these free windows are unpredicted. In order to avoid AR in HID lamps, several methods are applied, such as square wave supply [13], pulse operation [71], extra-high frequency [72], frequency modulation [11], amplitude modulation, injection of fundamental and the third harmonic [73], and injection of several adjacent frequency signals [74]. The main ideas are to reduce the power harmonic below the AR excitation threshold.
f) Model of acoustic streaming
In recent years, acoustic streaming in HID lamps becomes a research hot point. The numerical model including acoustic streaming using 2-D axisymmetric geometry was implemented in an HID lamp [8], [75], as shown in Fig. 1-26.
In Fig. 1-26, several velocity fluxes are generated by the acoustic streaming force. Except for these fluxes, the amplitude of the velocity increases from 0.1 cm/s (without AR) to 4.5 cm/s (with AR). The rise of the velocity and the generation of the velocity fluxes can explain the instabilities in the arc tube and the displacement of the electrical arc.
In Fig. 1-27 (a), the flux velocity is generated because of the gravitational force, when AR does not occur in the HID lamp. Fig. 1-27(b), several fluxes are generated due to the acoustic streaming force. In addition, the streamline is divided into several irregular parts.
3D multi-physics mode of high-intensity discharge mode has been set up to calculate the acoustic streaming velocity field inside the arc tube of HID lamps [76], [67]. In the paper [77], a 3D finite element model was
presented to determine the influence of acoustic streaming on the temperature field near an acoustic eigenfrequency. The results show that acoustic streaming affects voltage drop, temperature field, and flow field. Furthermore, it has recently been discovered that the acoustic streaming phenomenon is the link between the high-frequency resonances and the frequency light flicker. The high-frequency sound wave causes a low-frequency movement of the plasma arc that is visible as light flicker. As presented in the paper [78], there are low frequencies (8-15Hz) of discharge arc flicker and arc fluctuations due to the excitation of AR in MH lamp. The reason of low-frequency flicker with AR can be identified as acoustic streaming effects.
In the paper [67], acoustic streaming is assumed to be responsible for light flicker caused by AR. According to Fig. 1-28, the maximal streaming velocity is about 0.8 m/s near an AR frequency. For the diameter of an arc tube 6 mm, this velocity is very large, so it is not surprising that the streaming field can disturb the plasma arc.
Thesis key points
Base on the current research achievements studied by others, our work focuses on several parts as follows: a) Why we choose MH lamps, not HPS lamps?
MH lamps have quasi-continuous spectrum, higher CCT, and better color rendering index. In addition, MH lamps produce white light, comparing to HPS lamps producing yellow light. MH lamps can be used for somewhere needs high color qualities. Fig. 1-29 shows HPS and MH lamps using in different streets.