Publisher’s version / Version de l'éditeur:
2017 IEEE 30th Canadian Conference on Electrical and Computer Engineering
(CCECE), 2017-06-15
READ THESE TERMS AND CONDITIONS CAREFULLY BEFORE USING THIS WEBSITE. https://nrc-publications.canada.ca/eng/copyright
Vous avez des questions? Nous pouvons vous aider. Pour communiquer directement avec un auteur, consultez la première page de la revue dans laquelle son article a été publié afin de trouver ses coordonnées. Si vous n’arrivez pas à les repérer, communiquez avec nous à [email protected].
Questions? Contact the NRC Publications Archive team at
[email protected]. If you wish to email the authors directly, please see the first page of the publication for their contact information.
NRC Publications Archive
Archives des publications du CNRC
This publication could be one of several versions: author’s original, accepted manuscript or the publisher’s version. / La version de cette publication peut être l’une des suivantes : la version prépublication de l’auteur, la version acceptée du manuscrit ou la version de l’éditeur.
For the publisher’s version, please access the DOI link below./ Pour consulter la version de l’éditeur, utilisez le lien DOI ci-dessous.
https://doi.org/10.1109/CCECE.2017.7946593
Access and use of this website and the material on it are subject to the Terms and Conditions set forth at
An approach to detect branches and seedpods based on 3D image in
low-cost plant phenotyping platform
Cao, Thang; Panjvani, Karim; Dinh, Anh; Wahid, Khan; Bhowmik, Pankaj
https://publications-cnrc.canada.ca/fra/droits
L’accès à ce site Web et l’utilisation de son contenu sont assujettis aux conditions présentées dans le site LISEZ CES CONDITIONS ATTENTIVEMENT AVANT D’UTILISER CE SITE WEB.
NRC Publications Record / Notice d'Archives des publications de CNRC:
https://nrc-publications.canada.ca/eng/view/object/?id=953390a1-7621-4dc9-8faa-2d3da061aa78 https://publications-cnrc.canada.ca/fra/voir/objet/?id=953390a1-7621-4dc9-8faa-2d3da061aa78An Approach to Detect Branches and Seedpods Based
on 3D Image in Low-Cost Plant Phenotyping
Platform
Thang Cao, Karim Panjvani, Anh Dinh, Khan Wahid
Department of Electrical and Computer Engineering University of Saskatchewan
Saskatoon, Canada
Pankaj Bhowmik
National Research Council Canada Saskatoon, Saskatchewan
Canada
Abstract—To meet the high demand for supporting and accelerating progress in breeding of novel traits, plant scientists and breeders have to make more efforts to deal with the need to accurately measure a large number of plants and their characteristics. A variety of imaging methodologies is being deployed to acquire data for quantitative studies of complex traits. When applied to a large number of plants, however, a complete 3D model is very time-consuming for high-throughput phenotyping with an enormous amount of data. In some contexts, complete rebuild of entire plants may not be necessary. With the aim of producing a smaller amount of data per plant, low-cost depth imaging systems can be useful. We propose the use of such a low-cost depth camera, called Time-of-Flight (ToF), to have videos and pictures of the plant in 3D. An application has been developed to display 3D model of a plant and estimate certain characteristics. Counting the number of branches and seedpods of the canola plant have been implemented. Estimating the biomass and crop yield will be deployed in the near future.
Keywords—3D plant phenotyping, image processing, time-of-flight camera, counting branches and seedpods
I. INTRODUCTION
With the increasing demand of food supply in the world, agricultural scientists are facing a tremendous challenge in that the current production rate does not satisfy the need in the future [1]. To meet such high demand in food production, there is an obligation to increase breeding efficiency. Advances in genetic technologies, such as next generation DNA sequencing, have provided new methods to improve plant breeding techniques in the past decade. With these novel technologies, plant breeders can increase the rate of genetic improvement by molecular breeding [2]. However, the lack of access to phenotyping capabilities limits the ability to analyze the genetics of quantitative traits related to growth, crop yield, and adaptation to stress [3]. In the past few years, there has been increased interest in high throughput phenotyping approaches in the controlled indoor environment [4]. These new approaches linking functional genomics, phenomics, and plant breeding are needed to improve both crop production and crop yield stability and efficient screening of high-yielding or stress-tolerant varieties [5]. The currently used techniques, such as visible imaging, spectroscopy imaging, thermal infrared imaging,
fluorescence imaging, etc., provide quantitative morphological measurements.
Many studies have deployed laser systems (LemnaTec Scanalyzer) that scan the plant surfaces to acquire and analyze plant images, or 3D images, for extracting particular phenotypic traits [6-8]. Some larger scale facilities, such as the Australian Plant Phenomics Facility, the European Plant Phenotyping Network, and the USDA-NIFA have also been deployed robotics, precise environmental control, and remote sensing techniques to assess plant growth and performance in growth chambers or greenhouses. Kjaer and Ottosen used a high-resolution 3D laser scanner (PlantEye, Phenospex) to track daily changes in plant growth with high precision in challenging environments [9]. Eitel et al found that, with the greater robustness, accuracy and resolution, the best known and most widely used type of sensor for 3D canopy reconstruction is LiDAR [10]. LiDAR creates accurate and detailed 3D models by structured light projection and laser range scanners. However, the system is expensive and requires longer imaging acquirement time. Therefore, these high-end platforms require far beyond budget that most research laboratories can afford and they may not be suitable to use in different environments. The objectives of our project are to: (1) present a low-cost depth camera system, (2) deploy high-throughput 3D phenotyping suitable for both greenhouses and fields, and (3) develop novel image processing algorithms for detecting and counting number of branches and seedpods.
II. METHODOLOGY
This 3D plant phenotyping has some advantages over the current imaging systems as it uses a low-cost depth camera system to provide a high-throughput 3D phenotyping system with multi-platform capability. A low-cost depth camera (Agros3D-P100, developed by Bluetechnix) is used as an imaging acquisition system. With this time-of-flight (ToF) technology camera, phenotypic traits such as plant height, number of branches, number of seedpods, and plant canopy (e.g., volume of plant) can be directly extracted and measured. The ToF depth sensor can capture depth map and 160x120 pixel data at up to 160 frames per second to simultaneously deliver depth information and grayscale image for each pixel. In addition, the data acquired from the depth camera is small
enough for realtime phenotyping process as well as increase the storage capacity. The 3D phenotyping system can be deployed on a greenhouse or on a field platform. With the growth chamber platform, an imaging system can be fixed and the plant is turned around the camera or the camera is moved around a stationary plant. In the field platform, an imaging system can be mounted on a moveable carrying device (e.g., robot or slider) that moving over the field plots. In this work, a 3D plant phenotyping approach, combining of a depth camera and a digital camera, used in a chamber environment is deployed to measure plant height, number of branches, and number of seedpods. Matlab, Agros3D-P100 SDK and Kinect V2 SDK are used to connect the depth camera with a PC and supports the acquiring pf phenotypic data.
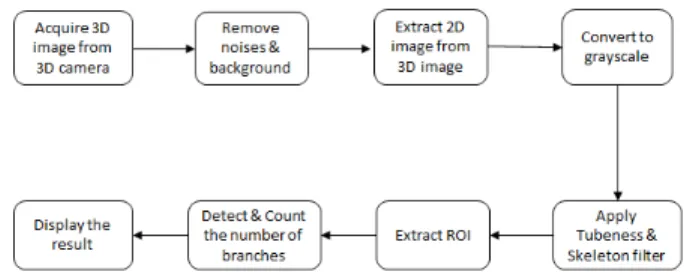
Fig. 1 describes the steps to be used to count the number of branches. First, the 3D ToF camera provides the depth information. The camera is stationary and the plant is rotated on a turntable. Noise and background are then removed by applying a 3D filter. From the filtered 3D images, 2D images are extracted in the third step. Before applying a thinning algorithm (to acquire skeleton) and a tubeness algorithm (to achieve thicker and smoother tubes) in step 5, the images are converted to grayscale images in step 4. A region of interest (ROI), containing stems and branches, are extracted in step 6 before detecting and counting the number of branches in step 7. Finally, the result of the counting is displayed in step 8.
Fig. 1. Workflow diagram of counting the number of branches
Fig. 2 illustrates the process to count the number of seedpods. In this process, a digital camera is used to capture color images of the canola plant. The color images are converted to grayscale images. Next, the Frangi 2D Vesselness filter algorithm [11] is applied to detect tube-like structures of stems and branches from the grayscale images. A thinning algorithm is then used to get the skeleton of the plant. Finally, an algorithm for detecting and counting the number of seedpods is developed. The algorithm also refines the result after applying Frangi filter and determines the locations of end points in the skeleton of the plant. From these end-point locations, seedpods can be detected and the number of seedpods can also be estimated.
III. EXPERIMENTAL RESULTS
In this work, the Agros3D-P100, Kinect V2 and Sony SLT-A58 cameras were used in the experiments. First, a combination of Agros3D-P100 and Sony SLT-A58 were used to compare with the combination of Kinect V2 and Sony SLT-A58. After applying the processes previously described, the best approach will be proposed. The experimental results are shown as below.
Fig. 2. Workflow diagram of counting the number of seedpods
A. Results from a combination of Agros3D-P100 and Sony SLT-A58
3D images (in term of point cloud) of a canola plant are extracted from the Agros3D-P100 by using APIs mentioned in the MatlabSDK_BtaP100 package. Then, noise and background of these depth images will be removed by applying a filter as illustrated in the Fig. 3.
Fig. 3. 3D image acquired from the ToF camera Agros3D-P100, plant image with background (a), plant image after removing background (b).
From the 3D cleaned point cloud above, the next steps are to extract 2D images and convert to grayscale images as shown in Fig. 4. Then, acquiring the skeleton of the canola by applying the thinning filter and implementing the tubeness filter to get a thicker and smoother skeleton is performed before extracting the ROI (see Fig.5). Finally, with ROI information, an algorithm of counting the number of branches is deployed and shown the results as in Fig. 6.
Fig. 4. Extracting 2D image from the filtered 3D image (a) and converting to grayscale image (b).
Ten images from a canola plant with different angles were captured and processed. The results were compared to manual count, as listed in Table I. Although there are low-resolution images acquired from the low-cost depth camera, the counting branches algorithm can achieve an accuracy up to 93%.
(a) (b)
Fig. 5. Results of extracting skeleton, implementing tubeness filter, extracting ROI (red color), and counting the number of branches.
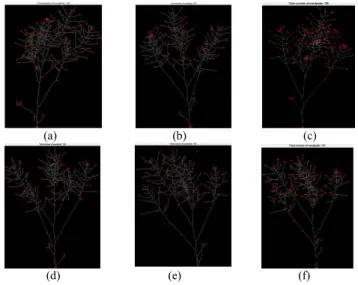
Fig. 6. Results of other branches detection with different images acquired by the Agros3D P100
TABLE I. MANUAL AND ALGORITHM COUNTING NUMBER OF CANOLA BRANCHES –FROM THE AGROS3D-P100 CAMERA
Image number from Agros ToF camera
Manual count Algorithm count Error rate (%) 1 5 5 0 2 4 4 0 3 5 4 20 4 5 4 20 5 5 5 0 6 5 5 0 7 4 3 25 8 5 5 0 9 5 5 0 10 4 4 0 Average 7
As the results shown in the Fig. 6 and Table I, the algorithm successfully detects branches in most cases. However, in image number 4, there are only four branches were counted by the algorithm instead of five. The reason is that the hidden branch was not detected due to branch overlapping. Other sources of error include viewing angle and distance between the camera and the plant.
For the second experiment to count the number of seedpods, ten images of the canola plant were taken by the Sony SLT-A58 camera. As the workflow introduced in Fig. 2, these color images were converted into grayscale, then tube-like structures (vessels) were distinguished by applying Frangi 2D Vesselness filter, as shown in the Fig. 7. By using Frangi filtered image, the skeleton of the plant is extracted. Finally, the skeleton is refined
before applying an algorithm to detect the end points in the given skeleton. From these certain end points (the red stars in the image), the seedpods can be detected and the number of seedpods is to be estimated (see Fig. 8).
Fig. 7. Acquiring a color image (a), converting to grayscale image (b), and applying Frangi Vesslness filter (c).
Fig. 8. Extracting skeleton (a) detecting end points (b). Based on these end points, calculate the number of seedpods.
The other images of the same plant were used to evaluate the algorithm at different angles. The results were quite similar, however they are dependent on the viewing angle (see Fig. 9). For example, the actually number of seedpods of the plant is 124, the algorithm detects and counts only 117 in the image ‘Color_image_6’ because some seedpods were shaded by the others. On the other hand, in the image ‘Color_image_5’, the number of seedpods was 130 due to background noise. In overall, in the detection of seedpods experiments, the accuracy rate can reach up to about 97% as shown in Table II.
Fig. 9. Detected end points on different images at different viewing angles
(1) (2) (3) (4) (5) (6) (a) (b) (c) (a) (b) (a) (b) (c) (d) (e) (f)
TABLE II. RESULTS OF MANUAL AND ALGORITHM COUNTING THE NUMBER OF CANOLA SEEDPODS
Image number from Digital camera Manual count Algorithm count Error rate (%) Color_image_1 124 125 1 Color_image_2 124 128 3 Color_image_3 124 126 2 Color_image_4 124 124 0 Color_image_5 124 130 5 Color_image_6 124 117 6 Color_image_7 124 131 2 Color_image_8 124 127 2 Color_image_9 124 127 2 Color_image_10 124 122 2 Average 3
B. Results from a combination of Kinect V2 and Sony SLT-A58 for green house environment
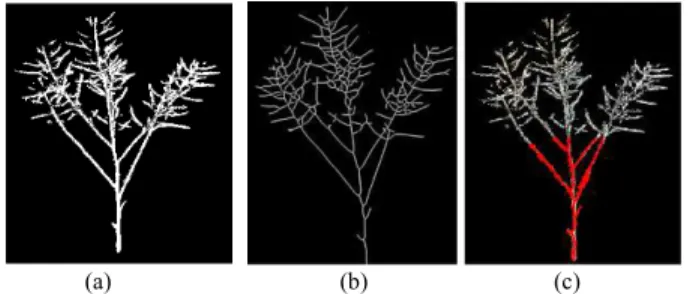
In contrast to the Agros3D P100 that can acquire depth information without light or under directly sunlight, the Kinect V2 requires good illumination environment when captures a point cloud of the canola plant. Obviously, the Kinext camera provides higher resolution compared to the ToF counterpart. The next steps were performed as the same as previous experiment (from step 3 to step 8 in Fig. 1). The results are illustrated in Fig. 10 and Table III. Due to the higher resolution than the depth camera, the performance of the algorithm on Kinect V2’s images is better.
Fig. 10. Images from Kinect V2 greyscale (a), tubeness filtered (b), extracting ROI (c)
TABLE III. MANUAL AND ALGORITHM COUNTING THE NUMBER OF CANOLA BRANCHES – FROM KINECT V2
Image number from Kinect V2 camera Manual count Algorithm count Error rate (%) Kinect_image_1 5 5 0 Kinect _image_2 5 5 0 Kinect _image_3 4 5 25 Kinect _image_4 5 4 20 Kinect _image_5 5 5 0 Kinect _image_6 5 5 0 Kinect _image_7 4 4 0 Kinect _image_8 5 5 0 Kinect _image_9 5 5 0 Kinect _image_10 4 4 0 Average 5 IV. CONCLUSION
Our proposed approach deals with some obstacles in 3D plant phenotyping. Algorithms were developed to improve the Frangi 2D Vessel Filter, extract and validate skeleton end points and then estimate the number of branches and
seedpods. From both experiment results performed on a single canola plant by the ToF Agros3D P100 and the Kinect V2 cameras, it is seen that the error rates of counting the number of branches (7% and 5% respectively) and seedpods (3%) are acceptable. The Kinect V2 is suitable to implement in the greenhouse because it cannot cope with direct sunlight. The ToF Agros3D P100 camera is more suitable for both in the greenhouse and out to the field by its advantages such as high frame rate and an independent of environment illumination. With a combination of a ToF camera and a digital camera, the imaging system is capable of being scaled up for indoor and outdoor facility high-throughput plant phenotyping on different environment platforms. In the future, the algorithms need to be improved in accuracy when applied to a large number of canola plants in the field. Biomass, crop yield, and other characteristics can be estimated using the images from these cameras.
ACKNOWLEDGMENT
The authors would like to acknowledge the support from the Global Institute for Food Security, Canada, and Agriculture Development Fund, Saskatchewan, Canada.
REFERENCES
[1] Bongaarts, J., United, “Nations, department of economic and social affairs, population division, sex differentials in childhood mortality,” Population and Development Review, vol. 40, no. 2, pp. 380, June 2014. [2] Phillips, R.L., “Mobilizing science to break yield barriers,” Crop Science
Society of America, vol. 50, pp. S-99–S-108, March 2010.
[3] Li, L., Zhang, Q., & Huang, D., “A review of imaging techniques for plant phenotyping,” Sensors, vol. 14, no. 11, pp. 20078-20111, October 2014. [4] Fiorani, Fabio, and Ulrich Schurr, “Future scenarios for plant
phenotyping,” Annual review of plant biology, vol. 64, pp. 267-291, 2013.
[5] Bolon, Yung-Tsi, et al, “Phenotypic and genomic analyses of a fast neutron mutant population resource in soybean,” Plant physiology, vol. 156, no. 1, pp. 240-253, February 2011.
[6] Furbank, Robert T., and Mark Tester, “Phenomics–technologies to relieve the phenotyping bottleneck,” Trends in plant science, vol. 16, no. 12, pp. 635-644, Dec. 2011.
[7] Dornbusch, T., et al, “Measuring the diurnal pattern of leaf hyponasty and growth in Arabidopsis – a novel phenotyping approach using laser scanning,” Functional Plant Biology, vol. 39, n0. 10-11, pp. 860-869, August 2012.
[8] Chen, Dijun, et al, “Dissecting the phenotypic components of crop plant growth and drought responses based on high-throughput image analysis,” The Plant Cell, vol. 26, no. 12, pp. 4636-4655, December 2014. [9] K. Kjaer and C.-O. Ottosen, “3D Laser Triangulation for Plant
Phenotyping in Challenging Environments,” Sensors, vol. 15, no. 6, pp. 13533–13547, June 2015.
[10] Eitel JU, Magney TS, Vierling LA, Brown TT, Huggins DR, “LiDAR based biomass and crop nitrogen estimates for rapid, non-destructive assessment of wheat nitrogen status,” Field Crops Research, vol. 159, pp. 21-32, March 2014.
[11] A. F. Frangi, W. J. Niessen, K. L. Vincken, and M. A. Viergever, “Multiscale vessel enhancement filtering,” Medical Image Computing and Computer-Assisted Intervention — MICCAI’98 pp. 130-137, October 1998.