Polarforschung 85 (2), 69–80, 2015 (erschienen 2016)
Chaotic Behaviour of the Regional Climate Models,
CRCM5 and HIRHAM5,
in Ensemble Simulations over an Arctic Domain
by Oumarou Nikiéma1*, Anja Sommerfeld2, René Laprise1, Annette Rinke2 and Klaus Dethloff2 Abstract: In a chaotic system such as the Earth’s atmosphere, thediffer-ences between the members in an ensemble of global climate model simu-lations launched from different initial conditions initially grow in time until they reach the level of natural variability, indicating that member simulations be come uncorrelated. In nested Regional Climate Models (RCMs), however, the growth of inter-member differences is quenched due to the control exerted by the lateral boundary conditions (LBCs), but it nevertheless exhibits episodes of large fluctuations. Earlier work has speculated that this puzzling behaviour may simply reflect remaining chaos allowed by the incomplete control ex erted by LBC.
In this work, two large ensembles of twenty simulations were performed over an Arctic domain with two different RCMs: the Canadian RCM (CRCM5) and the High-Resolution Limited-Area Model (HIRHAM5). The inter-mem ber variability (IV) of each ensemble was methodically analysed in the frame-work of the potential temperature IV budget. The study reveals that, de spite being simulated by models with entirely different formulation, the two ensem-bles exhibit nearly identical IV patterns and time evolution, and in both cases baroclinic processes trigger fluctuations of IV. These results confirm earlier speculations that IV in RCMs is not an artefact of specific model nest ing tech-nique, but rather a natural phenomenon arising from the chaotic na ture of the atmosphere.
Zusammenfassung: Wird mit einem globalen Klimamodell ein Ensemble mit unterschiedlichen Anfangsbedingungen generiert, dann führt dies auf-grund des chaotischen Verhaltens der Atmosphäre dazu, dass die Diffe-renzen zwischen den Ensemblemitgliedern mit der Zeit anwachsen, bis ein Zustand entsprechend der natürlichen Variabilität erreicht ist. Dies führt zu Simulatio nen, die sich zueinander unkorreliert verhalten. In genesteten regi-onalen Kli mamodellen (RCM) ist das Anwachsen der Variabilität zwischen den Ensem blemitgliedern aufgrund der äußeren Randbedingungen (LBC) gedämpft. Dennoch können Episoden mit starken Schwankungen der Varia-bilität zwi schen den Ensemblemitgliedern auftreten. In früheren Studien wird die Ver mutung geäußert, dass dieses rätselhafte Verhalten durch mangelhafte LBC und das damit zusammenhängende verbleibende Chaos initiiert wird. In dieser Arbeit werden zwei große Ensemble mit je 20 Ensemblemitglie-dern über der Arktis mit zwei verschiedenen RCMs erzeugt: dem kanadi-schen RCM (CRCM5) und dem „High-Resolution Limited-Area Model“ (HIRHAM5). Für diese Ensemble wird die Variabilität zwischen den Ensem-blemitgliedern (inter-member Variability; IV) mit Hilfe einer IV Budgetstu die für die potentielle Temperatur analysiert. Die Studie ergab, dass trotz der sehr unterschiedlichen Modellformulierungen die räumlichen Muster und die zeitliche Entwicklung der IV in beiden RCM Ensembles sehr ähnlich sind. Außerdem werden in beiden Fällen die Schwankungen der IV durch baro kline Prozesse ausgelöst. Diese Ergebnisse bestätigen die früheren Vermu tungen, dass die IV in RCMs nicht durch die Nestingmethode bedingt, son dern eher ein natürliches Phänomen ist, dessen Ursache in der chaotischen Natur der Atmosphäre liegt.
____________
doi:10.2312/polfor.2016.002
1 Université du Québec à Montréal (UQAM), ESCER Centre, Département des Sciences
de la Terre et de l’Atmosphère, UQAM, P.O. 8888, Stn Downtown, Montréal (QC) Canada H3C 3P8;
* Corresponding author: <[email protected]>
2 Alfred Wegener Institute, Helmholtz Centre for Polar and Marine Research,
Telegra-fenberg A 43, D-14473 Potsdam, Germany.
This paper was presented as an oral presentation at the International Conference “Our Climate – Our Future: Regional perspectives on a global challenge”, 6–9 October 2014 in Berlin, Germany.
Manuscript received 01 May 2015; revised version 05 November 2015; accepted in revised form 03 December 2015.
INTRODUCTION
Regional Climate Models (RCMs) are very powerful tools used to make retrospective climate simulations and future cli mate projections due to their capacity of representing the physical processes with high resolution. RCMs are integrated on a limited domain from initial conditions (ICs) and lateral boundary conditions (LBCs) provided either by an archived simulation of a driving Global Climate Model (GCM) or by a gridded analysis of observations. Starting from alternative initial conditions leads to an ensemble of simulations that can be used to quantify uncertainties in response of inter-member (or internal) variability (IV) effects. The question then arises as to the causes underlying IV and resulting simulation uncer-tainties: Do they arise from approximations or errors in the discretisation of the model’s equations, in the parameterisa-tion of subgrid-scale processes, or as an artefact of the nesting procedure?
Several studies, such as those of Weisse et al. (2000), GiorGi
& Bi (2000), rinke & Dethloff (2000), Christensen et al.
(2001), Caya & Biner (2004), luCas-PiCher et al. (2004,
2008), rinke et al. (2004), alexanDru et al. (2007), have
shown that nested RCM simulations exhibit some level of IV. The IV is defined as the difference between members in an ensemble of simulations that differ only in their IC, while the LBC are the same and thus exert a constraint that limits the freedom of the nested simulations, at least at large scales. However, the physical processes responsible for the presence of IV in RCM’s simulations have remained a scientific issue till recently.
nikiéma & laPrise (2011a, 2011b, hereafter referred to as
NL11a and NL11b, respectively) have performed a budget diagnostics of the Canadian RCM’s simulations IV that shed some light on the physical processes responsible for the devel-opment of IV and its fluctuations in time. But, these stu dies, however, were limited because they have been done using a specific RCM, and the simulations were performed over a domain located in mid-latitudes covering North America and bordering Atlantic Ocean. sommerfelD et al. (2015)
conducted the same budget analysis with another RCM over a circum-Arctic domain. They calculated significantly higher IV and emphasise differences in the relative importance of the individual processes compared to NL11a and NL11b. The present study is based on two different RCMs: the 5th
-genera-tion Canadian RCM (CRCM5) and the version 5 of the High-Resolution Limited-Area Model (HIRHAM5). A set of twen ty simulations were performed over an Arctic domain with both RCMs for the same period and using the same
LBC from Era-interim data (Dee et al. 2011). The different
members of the ensembles were generated by launching the simulations at different initial times.
This paper compares results of two RCMs ensembles and analy-ses the procesanaly-ses responsible for IV. We use the metho dology described in NL11a and NL11b for potential tempera ture in order to perform a quantitative diagnostic calculation of the various diabatic and dynamic contributions to the tem poral variation and spatial distribution of IV. The paper is orga-nised as follows. The following section “Data and Evaluation Methods” describes the two RCMs and the simulations design, and the IV budget equation is remind ed. Thereafter, results are presented where the time evolution and vertical structure of IV from the two RCMs are compared and analysed. Then, we discuss the time evolution and time-average of various contri-butions to the IV tendency. Finally, the conclusion will be summarised.
DATA AND EVALUATION METHODS
Overview of the CRCM5 and HIRHAM5 models
A complete description of the 5th-generation Canadian RCM
(CRCM5) is given in hernanDez-Diaz et al. (2013). To
summarise, CRCM5 is based on the limited-area model (LAM) version of the Canadian Global Environment Multiscale (GEM) model (zaDra et al. 2008). It was developed through a
collaboration established between RPN/MSC (2016), ESCER/ UQAM (2016), and OURANOS (2016). GEM uses an implicit semi-Lagrangian two-time-level marching scheme (Côté et al.
1998), with slight off-centring to reduce the spurious response to orographic forcing (tanGuay et al. 1992). In the horizontal
the discretisation uses an Arakawa staggered C-grid and in the vertical a hybrid terrain-following hydrostatic-pressure coor-dinate (σ-p-coorcoor-dinates; laPrise 1992). The parameterisations
of the ensemble effect of sub grid-scale physical processes include the kain & fritsCh (1990) deep-convection, the
Kuo-transient (kuo 1965, Bélair et al. 2005)
shallow-con-vection schemes, the Sundqvist (sunDqvist et al. 1989)
rela-tive humidity based large-scale condensation scheme, and the correlated-K radiation scheme (li & Barker2005). The
vertical diffusion is computed following approaches described in Benoit et al. (1989), DelaGe & GirarD (1992), and DelaGe
(1997). The model uses a weak lateral diffusion.
The version 5 of the High-Resolution Limited-Area Model (HIRHAM5) is based on the dynamics of the High-Resolu-tion Limited-Area Model (HIRLAM7; unDén et al. 2002) and
the parameterisations of subgrid-scale physical processes from the global atmospheric model ECHAM5 (roeCkner et al.
2003) developed at the Max-Planck Institute (MPI) for Meteo-rology. HIRHAM5 is described in detail in Christensenet al.
(2007); it was developed in collaboration between the Danish Climate Centre at Danish Meteorological Institute (DMI) and the Potsdam Research Unit of the Alfred Wegener Institute Helmholtz Centre for Polar and Marine Research (AWI). The model’s dynamics uses a semi-implicit leapfrog scheme. In the horizontal, the discretisation uses also an Arakawa staggered C-grid and σ-p-coordinates in the vertical. The parameterisa-tions include convection mass-flux scheme of tieDtke (1989),
condensation using the prognostic statistical cloud scheme of
tomPkins (2002), solar and terrestrial radiation schemes based
on fouquart & Bonnel (1980) and mlaWer et al. (1997),
and vertical diffusion of roeCkner et al. (2003). The model
also uses a weak lateral diffusion.
Experiment design and simulations
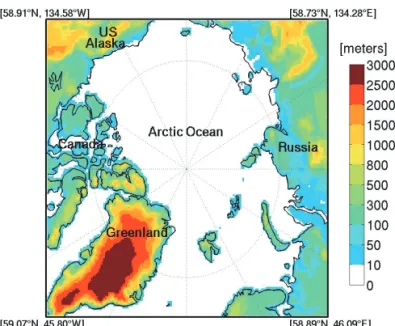
Two sets of 20-member simulations were performed with CRCM5 and HIRHAM5 over the Arctic region with its complex topography, including the Greenland Ice Sheet ex ceeds 3 km of height (Fig. 1). The study domain is rect-angu lar, centred on the North Pole (Fig. 1). For each RCM, inte grations were launched starting on July 1st, 2012 at 0000
UTC (1st simulation), and followed on each 6 hours up to
July 5th, 2012 at 1800 UTC (20th simulation). All integrations
share exactly the same LBC for atmospheric fields and lower boun dary conditions with prescribed sea-surface temperature (SST) and sea-ice cover (SIC) for the ocean surface from the ERA-Interim data. For other surface ICs, such as land-sur-face temperature and volumetric water contents of soil, sea ice temperature and snow depth and density, the two models use different sources of data since these were not available in ERA-Interim. The CRCM5 applies data from an earlier simu lation run from November 2008 to July 2012, while the HIR HAM5 uses the archived climate data for the month of July (haGemann 2002). Another detail is that the sea ice
thickness is computed in CRCM5 following semtner (1976)
for the model thermodynamic of sea ice growth and following eBert & Curry (1993) and flato & BroWn (1996) for the
parameterisation of albedo, conductivity and heat, whereas it is set constant at 2 m in HIRHAM5. In CRCM5, the growth of sea ice can reach a thickness more or less than the 2 m in different sectors of the Arctic region (result not shown). The simulations were integrated over a horizontal grid mesh of 0.25° of rotated longitude and latitude, with a 12-minute
Fig. 1: The common analysis domain for the two RCMs (CRCM5 and HIR-HAM5) over the Arctic area and topography (m). The longitude and latitude coordinates of the corners are indicated.
Abb. 1: Das Gebiet der Arktis inklusive der Orographie (m) für das die beiden RCMs (CRCM5 und HIRHAM5) angewendet werden. In den Ecken sind die Längen- und Breitengrade angegeben.
time step and 2-minute time step for CRCM5 and HIRHAM5, respectively. For technical reasons related to the model’s computational, the CRCM5 has 236 220 grid points includ ing a 10-grid-point wide semi-Lagrangian halo and a 10-grid-point wide sponge zone around the perimeter, resulting in a 196 180 free computational domain. The HIRHAM5 has 218 200 grid cells, with 10-grid-point wide sponge zone around the perimeter, resulting in a 198 180 free computa-tional domain. Hence the two models use nearly identical free domains. The analysis domain will comprise a common sub set region of 188 170 grid points (Fig. 1) in order to facili tate comparison. In the vertical, 56 and 40 terrain-fol-lowing levels were used for CRCM5 and HIRHAM5, respec-tively, with the top level near 10 hPa. The simulated fields of both models were interpolated on the following 19 pressure levels: 1000, 975, 950, 925, 900, 850, 800, 700, 600, 500, 400, 300, 250, 200, 100, 70, 50, 30 and 10 hPa. The simula-tions were archived at 3 and 6 hours intervals for CRCM5 and HIR HAM5, respectively, from July 6th, 2012 at 0000 UTC to
September 30th, 2012 at 1800 UTC.
Inter-member variability budget equation for potential temperature
The potential temperature is the tempera-ture that a parcel of dry air at pressure p and temperatempera-ture T would have if it were expanded or compressed adiabati-cally to a standard pressure p0. This atmospheric vari able is
important because every air parcel has a unique value, which is conserved for dry adiabatic motion (e.g., holton 2004).
This variable gives a simple mathematic expression of the first law of thermodynamic expressed as follows
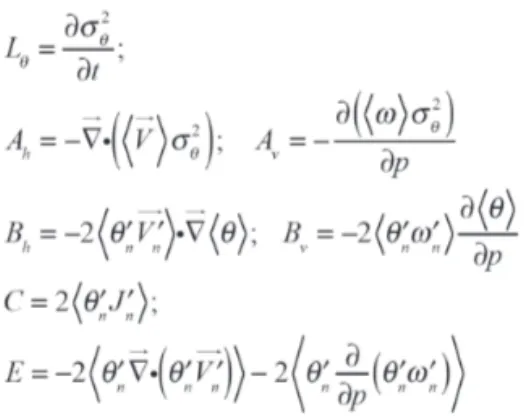
(1) where and Q is the sum of heat sources/ sinks in the atmosphere. Starting from this equation, NL11a established budget equation for the potential temperature IV. In the following, we briefly summarise the method-ology and we refer the reader to NL11a for more details on the algebraic details. Noting by n the simulation index in an ensemble of N members, each atmospheric variable can be split in two parts: an ensemble-mean part and the member deviations there of :
(2) with the ensemble-mean calculated as
(3) The inter-member variability is calculated as the inter-member variance of the variable approximated as the ensem-ble-mean of the deviation square:
(4) Starting from (1), the budget equation for the potential temperature IV ( ) is written as follows:
(5) where terms are given by:
The local change of the potential temperature variance (Lθ,
referred to as the “left-hand side” term) is calculated from the time evolution of the inter-member variance of the ensemble. The “right-hand side” term (Rθ) results from the sum of six
contributions:
• The horizontal (Ah) and vertical (Av) transport terms that
describe the convergence of the potential temperature IV by the ensemble-mean flow;
• The horizontal (Bh) and vertical (Bv) conversion terms that
represent the covariances of potential temperature and hori-zontal and vertical flow fluctuations in the direction of the ensemble-mean potential temperature gradient;
• The term C represents a diabatic generation (source/sink) term resulting from the covariance of fluctuations of poten-tial temperature and diabatic heating rate (J´n), which includes
contributions from latent heat release (Ccond), convective
heat-ing (Cconv), radiation heating (Crad), vertical diffusion (CVDif)
and lateral diffusion (CHDif);
• The third-order term (E) is the covariance of the potential temperature fluctuations and divergence of potential tempera-ture flux due to fluctuations.
RESULTS AND ANALYSIS
Inter-member variability (IV) in CRCM5 and HIRHAM5 simulations
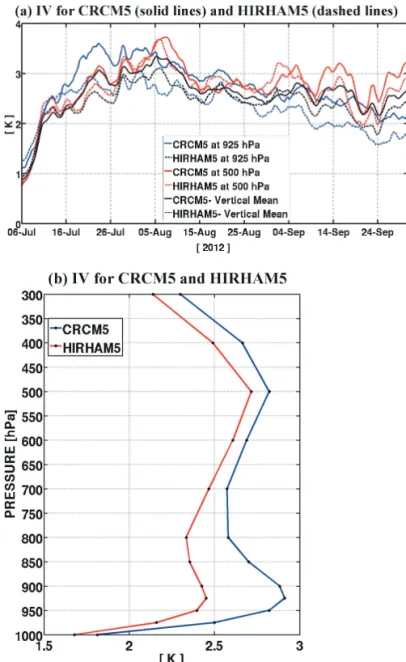
Figure 2a displays the time evolution of the potential tempera-ture IV for CRCM5 (solid lines) and HIRHAM5 (dashed lines) at 500 hPa (red lines), at 925 hPa (blue lines), and integrated over the troposphere between 300 hPa and the surface (black lines). The potential temperature IV is dis played as the square root of the horizontal domain average of 𝜎𝜎𝛩𝛩2. The inter-member
variability of the ensemble simulations of both models show remarkable similarity: the IV grows during a “spin-up” period of around 5 days and then reaches a quasi-equilibrium due to the control exerted by the LBC (GiorGi & Bi 2000), with
fluc-tuations in time and occasional episodes of larger IV. Although the CRCM5’s IV is slightly larger than HIRHAM5’s IV most the time, the time evolution of the two RCM’s IV are highly synchronous, with correla tion coefficients of 0.90, 0.91 and 0.93 for 500 hPa, 925 hPa and tropospheric average, respec-tively.
Figure 2b shows the vertical profile of the domain-averaged potential temperature IV, averaged in time over 82 days (from July 11th to September 30th 2012, thus excluding the spin-up
period). Although the CRCM5’s IV is larger than HIRHAM5’s IV at all pressure levels, the two models exhibit very similar
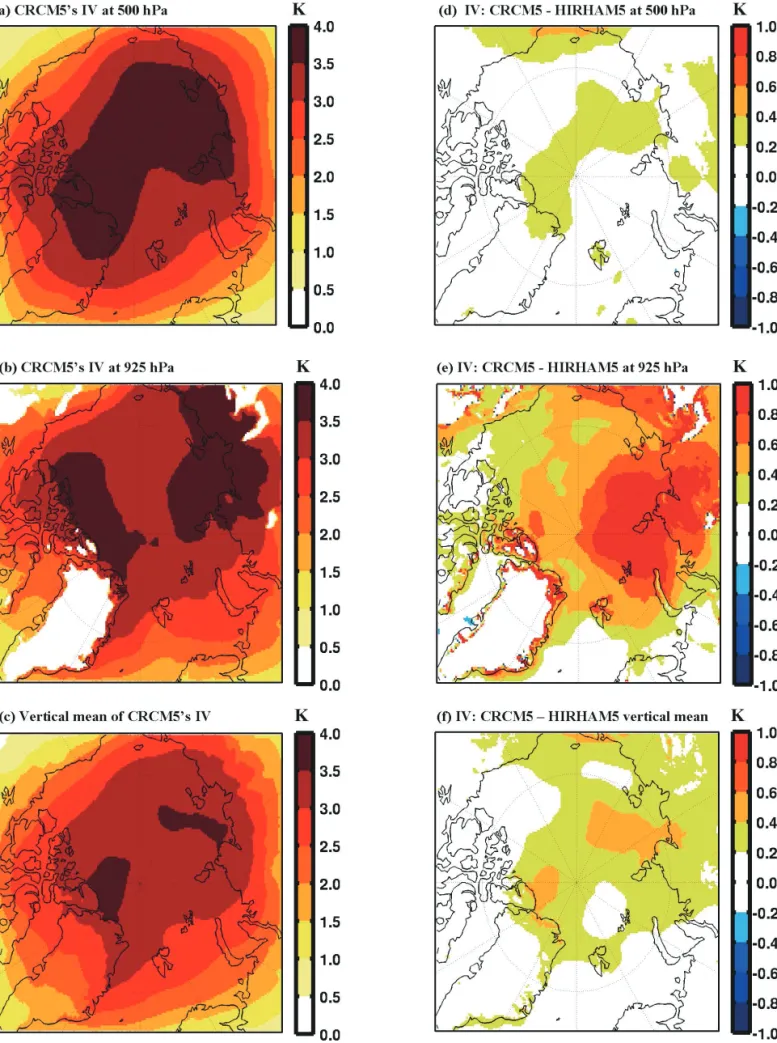
vertical profiles of IV, with minimum values of about 1.8 K and 1.7 K at 1000 hPa, and maximum values of 2.8 K and 2.4 K at 925 hPa, and 2.8 K and 2.7 K at 500 hPa for CRCM5 and HIRHAM5, respectively. By comparison with mid-latitude regional domains, NL11a found that the maximum values of IV are located at around 200 hPa, close to the tropopause level. Figure 3 presents the maps of the 82-day time-averaged po ten-tial temperature IV for CRCM5 at 500 hPa (a), 925 hPa (b), and the vertical integral between 300 hPa and the surface (c). The intense IV is found in the middle of the study domain and it decreases toward the boundaries because all simula tions share the same LBC and, hence perforce 𝜎𝜎𝛩𝛩2= 0, HIRHAM5
IV patterns were found to be very similar to those of CRCM5 and, for this reason, panels on the right-hand side in Figure 3 rather show the differences between the two models IV (CRCM5 minus HIRHAM5). Figure 3e shows that the maximum difference in IV occurs in the low levels near the
Fig. 2: (a): Time evolutions of the domain-averaged IV (inter-member variabi-lity) in K and (b): vertical profiles of time- and horizontal-averaged IV for po-tential temperature.
Abb. 2: (a): Zeitreihen der gebietsgemittelten IV (inter-member variability/ Variabilität zwischen den Ensemblemitgliedern) (in K) und (b): Vertikal profile der zeitlich und räumlich gemittelten IV für die potentielle Temperatur.
Severnaya Zemlya Archipelago; we speculate that this could be the result of the use of different parameterisations for boundary-layer, land-surface and sea-ice schemes in the two models.
Contributions to potential temperature IV (Inter-member variability) budget
Figure 4a presents the time evolution of the various contri-butions to the tendency of potential temperature IV, averaged over the domain, for the two models (CRCM5 in solid lines and HIRHAM5 in dashed lines). There is a remarkable simi larity of the various contributions between the two models, both in terms of amplitude of contributions and synchronicity of their fluctuations, confirming that the same physical pro cesses are acting in both models to contribute to the IV ten dency. It is clearly seen that Bh and C are systematically positive
contribu-tions, while the terms Bv and Ah are negative contributions for
both RCMs, with the dominant positive and negative contribu-tions to the IV tendency being Bh and Bv, respectively. In both
models, the vertical IV transport term (Av) and the third-order
term (E) do not contribute much to IV tendency on average, although the term E is occasionally non-negligible when the IV is large.
Figure 4b shows the vertical profiles of the time-mean and horizontal average of each contribution to shows the vertical profiles of the time-mean and 𝜎𝜎𝛩𝛩2
the vertical structure indicates four dominant terms, tendency. Again
the vertical structure indicates four dominant terms, Ah, Bh,
Bv, and C, with similar vertical structure in the two models.
The largest difference between the two models occurs in the term C, which will be commented upon later in the following sec tion. At all pressure levels, Bh contributes positively to the
IV tendency, while Ah and Bv act as negative contributions.
Con trary to what is seen in Figure 4a where the term C contri-butes positively in a vertically averaged sense, we note that it exhibits a negative contribution near the surface in both mo dels. In the mid-troposphere, the positive contributions of
Bh and C counterbalance the negative contributions of Bv and
Ah, resulting in a vanishing IV tendency on long time scales.
In deed, the two RCM’s results reveal that the tendency term (Lθ) is nearly zero at all pressure levels (not shown); this
means that there is no trend in IV although it greatly fluctu ates in time. Below 900 hPa, the only positive contribution comes from the horizontal baroclinic conversion term Bh, which is
offset by the negative contributions of (Bv + C). The terms
Av and E are much smaller compared to the other terms at all
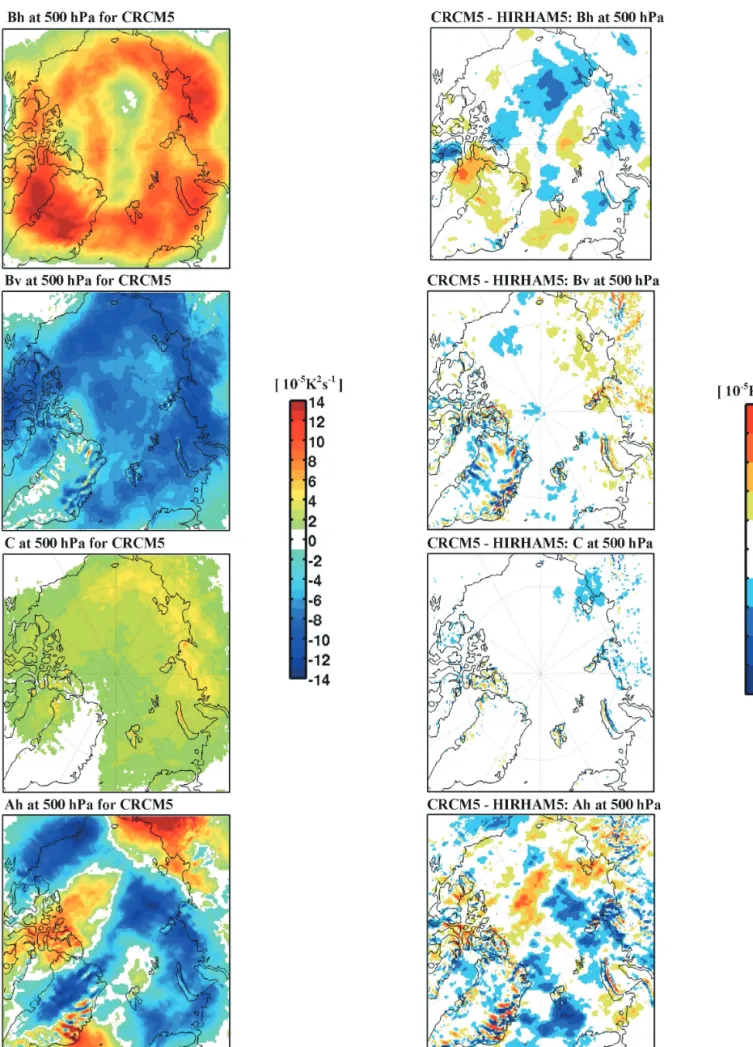
levels, and they will not be discussed further in the following. Figure 5 shows the spatial patterns of the time-averaged con tri-butions to the 500-hPa potential temperature IV tendency for CRCM5 (panels on the left-hand side), for the four domi nant terms (Ah, Bh, Bv, and C). Again given that the HIRHAM5
results are very similar to those of CRCM5, we chose to show the differences between the two models (CRCM5 minus HIR HAM5) on the right-hand side panels in Fig. 5). It is clearly seen that Bh and C contribute to generate IV while Bv
contri butes to destroy IV, at 500 hPa. The two models exhibit very similar patterns overall, but with locally some larger differ ences, especially for Ah and to some extent also for Bh.
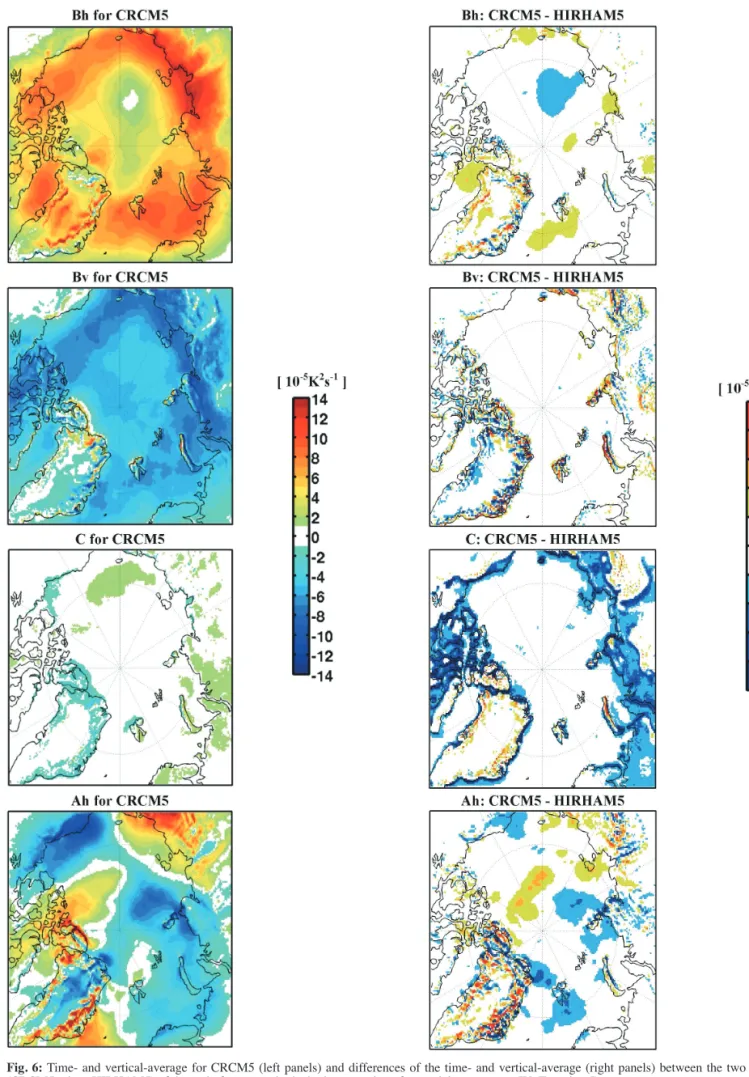
Figure 6 presents similar maps, but this time for the vertical integral of the contributions. Again the results of both models
Fig. 3: Time average of potential temperature IV for CRCM5 at 500 hPa (a), 925 hPa (b) and vertical average from 300 hPa to the surface (c). The right-hand side panels (d, e, f) show the corresponding differences between CRCM5 and HIRHAM5.
Abb. 3: Zeitlich gemittelte IV der potentiellen Temperatur für das CRCM5 in 500 hPa (a), 925 hPa (b) und vertikal von 300 hPa bis zum Boden gemittelt (c). Die rechten Abbildungen zeigen die entsprechenden Differenzen zwischen CRCM5 und HIRHAM5.
are very similar. The largest systematic difference is found in the term C, mostly near the coasts and adjacent land, and high mountains (e.g., East-Siberian and Ural mountains). Investi-gation has revealed that this difference is due to the neglect of the lateral diffusion contribution in the HIRHAM5 IV budget. This also explains the difference of results between the two models seen in Figure 4b for the vertical profile of C, as the lateral diffusion contributes negatively to IV tendency (NL11a). The term C in Figure 6 also shows that largest differ-ence in IV tendency between the two RCMs occurs around the perimeter of the Arctic Ocean. We speculate that this could be connected with the differing soil and land-surface schemes in the two models.
Physical interpretation of potential temperature IV (Inter-member variability) budget
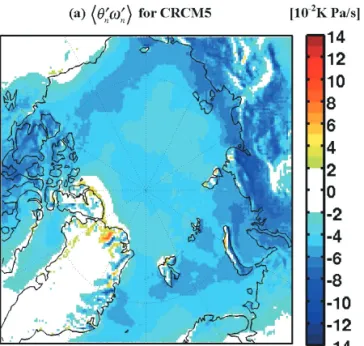
The analysis of various contributions to the term C for CRCM5 (Fig. 7a) indicates that its positive contribution to IV tendency in mid-troposphere is mainly due to effect of the condensation process (Ccond). The radiation process (Crad) also
contributes positively to IV tendency in mid-troposphere, but with less intensity. At the vicinity of 925 hPa, we note that
Ccond and Crad processes have compensating contributions to
C in a horizontal average sense (Fig. 7a). This compensation even holds to a large extent in the spatial distribution of these fields at 925 hPa (Fig. 7b, 7c). These results indicate that the radiative heating and temperature perturbations are positively correlated throughout the atmosphere, whereas condensation al heating and temperature perturbations are positively corre-lated in the middle troposphere (probably due to preferential condensation in warmer and more humid air) and negatively correlated in the low troposphere (apparently due to prefe-rential condensation in colder air or evaporation of precipita-tion in warmer air). Finally, the lateral (horizontal) diffusion (CHDif) contributes negatively to IV tendency throughout the
atmosphere, while the vertical diffusion (CVDif) contributes
negatively to IV tendency near the surface and positively aloft. For both RCMs, the dominant positive and negative contribu-tions to the IV tendency are the baroclinic terms Bh and Bv,
respectively, with rather small differences between the two models.
The positive contribution of the term Bh (Fig. 6) indicates that
the horizontal heat flux due to perturbation wind and temper-ature covariance is “down the gradient” of the ensemble-mean potential temperature, as noted by NL11a and NL11b. This reflects the fact that positive covariance of horizontal wind and potential temperature fluctuations occurs where there is negative horizontal gradient of the en semble-mean potential temperature . This means that warm air flux moves heat towards cold regions, and cold air flux moves heat away from warm regions.
On the other hand, the intense negative contribution of Bv
(Fig. 6) indicates a negative covariance of vertical motion ω and potential temperature fluctuations given the general presence of a negative presence of a negative vertical (pressure) gradient of ensemble-mean ), potential temperature in stable atmosphere (Fig. 8). This means that warm air rises and cold air sinks in perturbations from the ensemble-mean conditions, which tends to suppress the poten-tial temperature IV, as noted by NL11a and NL11b.
On a horizontal-mean and time-average basis, the term Ah
acts as a sink to IV (Fig. 4). This means that IV is lost by its transport outside the study domain by the ensemble-mean horizontal flow (NL11a and NL11b). On the other hand, the spatial distribution of Ah (Fig. 6) shows locally positive and
negative contributions; the dipoles of signs indicate the direc-tion of IV's transport within the study domain by the ensem-ble-mean horizontal flow.
Fig. 4: (a) Time evolution of the domain average and (b) vertical profiles of the time- and horizontal-average of different terms in the budget equation of po-tential temperature IV (inter-member variability) for CRCM5 (solid lines) and HIRHAM5 (dashed lines). The legend on the bottom right-hand side identifies the various terms in the two panels (a) and (b).
Abb. 4: (a) Zeitreihen der räumlich gemittelten und (b) Vertikalprofile der zeit-lich und räumzeit-lich gemit telten Terme der IV (Variabilität zwischen den Ensem-blemitgliedern) Budgetgleichung für die potentielle Temperatur für CRCM5 (durchgezogene Linien) und HIRHAM5 (gestrichelte Linie). Die Legende rechts unten zeigt die verschiedenen Terme in den beiden Abbildungen (a) und (b).
Fig. 5: On the left-hand side: Time-average maps of the four main terms in the budget equation of potential temperature IV (see Equation 5) at 500 hPa for CRCM5. On the right-hand side: Difference time-average between the two models (CRCM5 minus HIRHAM5).
Abb. 5: Links: Zeitlich gemittelte vier Hauptterme der IV-Budgetgleichung für die potentielle Temperatur (Gleichung 5) in 500 hPa für das CRCM5. Rechts: Zeitlich gemittelte Differenzen zwischen beiden Modellen (CRCM5 und HIRHAM5).
Fig. 6: Time- and vertical-average for CRCM5 (left panels) and differences of the time- and vertical-average (right panels) between the two models (CRCM5 minus HIRHAM5) of the main four terms in the budget equation of potential temperature IV (Equation 5).
Abb. 6: Zeitlich und vertikal gemittelte vier Hauptterme der IV-Budgetgleichung für die potentielle Temperatur (Gleichung 5) für das CRCM5 (links) und die Differenz zwischen beiden Modellen (CRCM5 minus HIRHAM5) (rechts).
Fig. 7: (a): Vertical profiles of time- and domain-average of various phys-ical processes in Jn of the term C which contributes to the potential tem-perature IV (inter-member variability) tendency in CRCM5. (b): The pat-terns of conden sation and (c): radiation processes contributions are shown at 925 hPa. The unity of the colour bar in (b) and (c) is 10-5 K2s-1.
Abb. 7: (a): Vertikalprofile der zeitlich und räumlich gemittelten indivi-duellen physikalischen Prozesse in Jn des Terms C der zur IV (Variabilität zwischen den Ensemblemitgliedern) Tendenz der potentiellen Temperatur im CRCM5 beiträgt. Die räumlichen Muster zeigen die Beiträge der Kon-densations- (b) und Strahlungsprozesse (c) in 925 hPa. Die Einheit der Farbskala in (b) und (c) ist 10-5 K2s-1.
Fig. 8: Time- and vertical-average of (a) the covariance of fluctuations and (b) the vertical gradient of the ensemble-mean potential temperature in the term Bv for the CRCM5.
Abb. 8: Zeitlich und vertikal gemittelte (a) Kovarianz der Abweichungen und (b) vertikale Gradient des Ensemblemittels der potentiellen Tempera-tur des Terms Bv für das CRCM5.
78
SUMMARY AND CONCLUSION
In ensembles of nested RCM simulations driven by iden-tical lateral boundary conditions (LBC), inter-member vari-ability (IV, defined as the spread amongst members around the ensemble-mean) greatly varies depending on atmospheric weather regimes, season, domain size and the regional domain of interest, as other studies have shown. Previous studies of budget diagnostics of IV have shed some light on physical processes responsible for the maintenance of IV and its vari-ations in time (NL11a, NL11b, sommerfelD et al. 2015), but
these studies were performed with only a single RCM. This study explored processes related to IV using two sets of twenty simulations performed with two different RCMs, CRCM5 and HIRHAM5, over the same study do main, the circum-Arctic, for the months of July, August and September 2012.
Despite the very different model formulations, the time evolu-tion of domain-averaged IV, the vertical profile of horizontal- and time-averaged IV, and horizontal maps of the time- and vertical-averaged IV were found to be very similar in both models, although the IV was somewhat larger in CRCM5 than in HIRHAM5. The good time correlations between IV fluctua-tions is indicative that the IV is closely tied to synoptic events during the simulations, as noted by previous studies (e.g., alexanDru et al. 2007, NL11a, NL11b, sommerfelD et al.
2015).
The budget study of IV in the two ensembles revealed that two terms
2
27.04.16
10
its variations in time (NL11a, NL11b, SOMMERFELD et al.
2015), but these studies were performed with only a single RCM. This study explored processes related to IV using two sets of twenty simulations performed with two different RCMs, CRCM5 and HIRHAM5, over the same study do-main, the circum-Arctic, for the months of July, August and September 2012.
Despite the very different model formulations, the time evolution of domain-averaged IV, the vertical profile of horizontal- and time-averaged IV, and horizontal maps of the time- and vertical-averaged IV were found to be very similar in both models, although the IV was somewhat larger in CRCM5 than in HIRHAM5. The good time correlations between IV fluctuations is indicative that the IV is closely tied to synoptic events during the simulations, as noted by previous studies (e.g., ALEXANDRU et al. 2007, NL11a,
NL11b, SOMMERFELD et al. 2015).
The budget study of IV in the two ensembles revealed that two terms
and
are the most important contributions, contributing system-atically positively and negatively at all pressure levels, respectively, to the potential temperature IV tendency. The contribution Bh acts positively because the heat transport by
covariance of fluctuations is down-the-gradient in the ensem-ble-mean state. On the other hand, the term Bv acts
negatively, which implies that warm fluctuations rise and cold fluctuations sink on average. There appears to exist a close analogy between this IV budget, with perturbation growth due to the term Bh and decay due the term Bv, and the
baroclinic conversion from transient-eddy perturbations available potential enthalpy to perturbation kinetic energy (e.g., LORENZ 1955, 1967, NL11a, NL11b).
The term also exhibits positive contributions to IV tendency in mid-troposphere due mainly to the conden-sation process that is positively correlated with temperature. Near the surface, this term C acts negatively to IV tendency due to diffusion (horizontal and vertical) processes. The con tribution
reflects the transport of IV by the ensemble-mean flow. On average, this term acts as a sink because it contributes to re-duce IV by transport outside the study domain. But, the term
Ah shows patterns of positive and negative values, indicating
the IV transport within the study domain.
This budget study of the potential temperature IV performed with two models over an Arctic domain revealed rather
and
2
27.04.16
10
its variations in time (NL11a, NL11b, SOMMERFELD et al. 2015), but these studies were performed with only a single RCM. This study explored processes related to IV using two sets of twenty simulations performed with two different RCMs, CRCM5 and HIRHAM5, over the same study do-main, the circum-Arctic, for the months of July, August and September 2012.
Despite the very different model formulations, the time evolution of domain-averaged IV, the vertical profile of horizontal- and time-averaged IV, and horizontal maps of the time- and vertical-averaged IV were found to be very similar in both models, although the IV was somewhat larger in CRCM5 than in HIRHAM5. The good time correlations between IV fluctuations is indicative that the IV is closely tied to synoptic events during the simulations, as noted by previous studies (e.g., ALEXANDRU et al. 2007, NL11a, NL11b, SOMMERFELD et al. 2015).
The budget study of IV in the two ensembles revealed that two terms
and
are the most important contributions, contributing system-atically positively and negatively at all pressure levels, respectively, to the potential temperature IV tendency. The contribution Bh acts positively because the heat transport by
covariance of fluctuations is down-the-gradient in the ensem-ble-mean state. On the other hand, the term Bv acts
negatively, which implies that warm fluctuations rise and cold fluctuations sink on average. There appears to exist a close analogy between this IV budget, with perturbation growth due to the term Bh and decay due the term Bv, and the
baroclinic conversion from transient-eddy perturbations available potential enthalpy to perturbation kinetic energy (e.g., LORENZ 1955, 1967, NL11a, NL11b).
The term also exhibits positive contributions to IV tendency in mid-troposphere due mainly to the conden-sation process that is positively correlated with temperature. Near the surface, this term C acts negatively to IV tendency due to diffusion (horizontal and vertical) processes. The con tribution
reflects the transport of IV by the ensemble-mean flow. On average, this term acts as a sink because it contributes to re-duce IV by transport outside the study domain. But, the term
Ah shows patterns of positive and negative values, indicating
the IV transport within the study domain.
This budget study of the potential temperature IV performed with two models over an Arctic domain revealed rather differ-ent underlying processes to the existence and fluctuations of IV from the study of NL11a and N11b over a mid-latitude domain for a summer season. They found that the term B has
are the most important contributions, contributing system atically positively and negatively at all pressure levels, respectively, to the poten-tial temperature IV tendency. The contribution Bh acts
posi-tively because the heat transport by covariance of fluctuations is down-the-gradient in the ensem ble-mean state. On the other hand, the term Bv acts negatively, which implies that warm
fluctuations rise and cold fluctua tions sink on average. There appears to exist a close analogy between this IV budget, with perturbation growth due to the term Bh and decay due the term
Bv, and the baroclinic con version from transient-eddy
pertur-bations available potential enthalpy to perturbation kinetic energy (e.g., lorenz 1955, 1967, NL11a, NL11b).
The term
2
27.04.16
10
its variations in time (NL11a, NL11b, SOMMERFELD et al.
2015), but these studies were performed with only a single RCM. This study explored processes related to IV using two sets of twenty simulations performed with two different RCMs, CRCM5 and HIRHAM5, over the same study do-main, the circum-Arctic, for the months of July, August and September 2012.
Despite the very different model formulations, the time evolution of domain-averaged IV, the vertical profile of horizontal- and time-averaged IV, and horizontal maps of the time- and vertical-averaged IV were found to be very similar in both models, although the IV was somewhat larger in CRCM5 than in HIRHAM5. The good time correlations between IV fluctuations is indicative that the IV is closely tied to synoptic events during the simulations, as noted by previous studies (e.g., ALEXANDRU et al. 2007, NL11a, NL11b, SOMMERFELD et al. 2015).
The budget study of IV in the two ensembles revealed that two terms
and
are the most important contributions, contributing system-atically positively and negatively at all pressure levels, respectively, to the potential temperature IV tendency. The contribution Bh acts positively because the heat transport by
covariance of fluctuations is down-the-gradient in the ensem-ble-mean state. On the other hand, the term Bv acts
negatively, which implies that warm fluctuations rise and cold fluctuations sink on average. There appears to exist a close analogy between this IV budget, with perturbation growth due to the term Bh and decay due the term Bv, and the
baroclinic conversion from transient-eddy perturbations available potential enthalpy to perturbation kinetic energy (e.g., LORENZ 1955, 1967, NL11a, NL11b).
The term also exhibits positive contributions to IV tendency in mid-troposphere due mainly to the conden-sation process that is positively correlated with temperature. Near the surface, this term C acts negatively to IV tendency due to diffusion (horizontal and vertical) processes. The con tribution
reflects the transport of IV by the ensemble-mean flow. On average, this term acts as a sink because it contributes to re-duce IV by transport outside the study domain. But, the term
Ah shows patterns of positive and negative values, indicating
the IV transport within the study domain.
This budget study of the potential temperature IV performed with two models over an Arctic domain revealed rather differ-ent underlying processes to the existence and fluctuations of IV from the study of NL11a and N11b over a mid-latitude domain for a summer season. They found that the term Bv has
similar magnitude as C throughout the troposphere, but with
also exhibits positive contributions to IV tendency in mid-troposphere due mainly to the conden-sation process that is positively correlated with temperature. Near the surface, this term C acts negatively to IV tendency due to diffusion (horizontal and vertical) processes. The contribution reflects the transport of IV by the ensemble-mean flow. On average, this term acts as a sink because it contributes to reduce IV by transport outside the study domain. But, the term Ah shows patterns of positive and
negative values, indicating the IV transport within the study domain.
This budget study of the potential temperature IV performed with two models over an Arctic domain revealed rather differ ent underlying processes to the existence and fluctua-tions of IV from the study of NL11a and N11b over a mid-lat-itude domain for a summer season. They found that the term
Bv has similar magnitude as C throughout the troposphere, but
with opposite sign. Their study also showed that the term C is the most important contribution to IV growth associated with local and intermittent physical processes linked with convec-tion and condensaconvec-tion. Over the Arctic domain the term Bh is
the most important contribution to IV growth, confirming that the baroclinic processes are more important over the Arctic region (rinke & Dethloff 2000, sommerfelD et al. 2015)
compared to North America domain where convection and condensation processes (in term C) are important in summer (NL11a, NL11b). The present study and those of NL11a, NL 11b and sommerfelD et al. (2015) reveal that the term Bv is
the most important contribution that suppresses the potential temperature IV. Contrary to what is seen for Arctic region, the term Ah contributed only negatively over North American
domain (NL11b) because of the actions of horizontal ensem-ble-mean flow that transports large pockets of IV outside the regional domain. Over the mid-latitude region, the episode of rapid decrease of IV is due to westerly flow that contributes to sweep away the IV. This result is different compared to what is seen over Arctic region where IV moves and mostly remains within the regional domain.
Despite the very different model formulations, the IV features of the two RCMs ensembles were found to be very similar, lending confidence in the earlier speculation that RCMs IV reflects a physical behaviour of numerical simulations of the chaotic climate system, subject to the partial control exerted by LBC of nested models, and not a numerical artefact associ-ated, for example, to the nesting technique. How IV connected with baroclinic instability processes could feed back with planetary atmos pheric circulation structures and influence climate variability from seasonal to inter-annual and decadal time scales is a matter of ongoing discussion with respect to Arctic-mid-latitude linkages as, e.g., discussed by Cohen et al.
(2014).
IV, rather than being seen as an evil in RCM simulations, might even be exploited to facilitate accessing the full range of physiccally plausible solutions corresponding to a set of imposed LBC. When, however, an RCM experiment is car ried out for which synchronicity is required between the RCM-simulated weather and the large-scale driving fields provided at the LBC – such as for case studies or seasonal prediction – then techniques to suppress IV such as large-scale spectral nudging (e.g., von storCh et al. 2000, alexanDru
et al. 2009, Šeparović et al. 2009, luCas-PiCher et al. 2015)
may be applied.
ACKNOWLEDGMENTS:
This research was done in collaboration between the UQAM’s ESCER Centre in Montréal (Québec, Canada) and the Alfred Wegener Institute Helmholtz Centre for Polar and Marine Research (AWI) in Potsdam (Germany). This study was founded in Canada by the Climate Change and Atmos pheric Research (CCAR) programme of the Natural Sciences and Engineering Research Council of Canada (NSERC) through a grant to the Canadian Network for Regional Cli mate and Weather Processes (CNRCWP), and in Germany by the Helm-holtz Climate Initiative (REKLIM). The simulations were made possible through Compute Canada – Calcul Qué bec supercomputers for CRCM5, and the German Climate
Computing Centre (DKRZ, Hamburg) for HIRHAM5. The authors thank Mrs. Katja Winger, Mrs. Ines Hebestadt, Mrs. Nadjet Labassi and Mr. Georges Huard for the technical support and maintaining efficient and user-friendly local computing facilities.The authors wish to thank Jens Hessel-bjerg Christensen and Emilia Sanchez-Gomez for their thor-ough reviews and helpful comments on the Manuscript.
References
CNRCWP <http://www.cnrcwp.uqam.ca>: Canadian Network for Regional Climate and Weather Processes; function tested on 15.03.2016.
ESCER/UQAM <http://www.escer.uqam.ca>: Centre pour l’etude et la simu-lation á l’echelle régionale (ESCER); function tested on 15.03.2016.
OURANOS <http://www.ouranos.ca/>: Consortium on regional climatology and adaptation to climate change; function tested on 15.03.2016.
REKLIM <http://www.reklim.de/en/>: Helmholtz Climate Initiative RE-KLIM (Regionale Klimaänderungen/Regional Climate Change); func-tion tested on 15.03.2016.
RPN/MSC <http://collaboration.cmc.ec.gc.ca/science/rpn/>: Environment and climate change Canada; function tested on 15.03.2016.
Alexandru, A., de Elia, R. & Laprise, R. (2007): Internal Variability in re gional c1imate downscaling at the seasonal scale.- Mon. Weather. Rev. 135: 3221-3238.
Alexandru, A., de Elía, R., Laprise, R., Šeparović, L. & Biner, S. (2009): Sensitivity study of regional climate model simulations to large-scale nudging parameters.- Mon. Weather Rev. 137: 1666-1686, doi: 10.1175/2008MWR2620.1,
Bélair, S., Mailhot, J., Girard, C. & Vaillancourt, P. (2005): Boundary-layer and shallow cumulus clouds in a medium-range forecast of a large-scale weather system.- Mon. Weather. Rev. 133: 1938-1960.
Benoit, R., Côté, J. & Mailhot, J. (1989): Inclusion of a TKE boundary layer parameterization in the Canadian regional finite-element model.- Mon. Weather Rev. 117:1726-1750.
Caya, D. & Biner, S. (2004): Internal variability of RCM simulations over an annual cycle.- Clim. Dyn. 22: 33-46.
Cohen, J., Screen, J.A., Furtado, J.C., Barlow, M., Whittleston, D., Coumou, D., Francis, J.A., Dethloff, K., Entekhabi, D., Overland, J.E., & Jones, J. (2014): Recent Arctic amplification and extreme mid-latitude weather.- Nature Geosci. 7: 627-637, doi: 10.1038/ngeo2234.
Côté, J., Gravel, S., Méthot, A., Patoine, A., Roch, M. & Staniforth, A. (1998): The operational CMC-MRB Global Environmental Multiscale (GEM) model: Part I. Design considerations and formulation.- Mon. Weather Rev. 126: 1373-1395.
Christensen, O.B., Gaertner, M.A., Prego, J.A. & Polcher, J. (2001): Internal variability of regional climate models.- Clim. Dyn. 17: 875-887. Christensen, O.B., Drews, M., Christensen, J.H., Dethloff, K., Ketelsen, K.,
Hebestadt, I., & Rinke, A. (2007): Technical Report 06-17, The HIRHAM Regional Climate Model Version 5 (β).
Dee, D.P., Uppala, S.M., Simmons, A.J., Berrisford, P., Poli, P., Kobayashi, S., Andrae, U., Balmaseda, M.A., Balsamo, G. & Bauer, P. (2011): The ERA-Interim reanalysis: Configuration and performance of the data assimilation system.- Quart. J. Royal Meteorol. Soc. 137: 553-597, doi: 10.1002/qj.828.
Delage, Y. (1997): Parameterising sub-grid scale vertical transport in atmo-spheric models under statically stable conditions.- Bound Layer Mete-orol. 82: 23-48.
Delage, Y. & Girard, C. (1992): Stability functions correct at the free convec-tion limit and consistent for both the surface and Ekman layers.- Bound Layer Meteorol. 58: 19-31.
Ebert, E.E. & Curry, J.A. (1993): An intermediate one-dimensional thermo-dynamic sea ice model for investigating ice-atmosphere interactions.- J. Geophys. Res. 98: 10085-10109.
Flato, G.M. & Brown, R.D. (1996): Variability and climate sensitivity of land-fast Arctic sea ice.- J. Geophys. Res. 101: 25,767-25,777.
Fouquart, Y. & Bonnel, B. (1980): Computation of solar heating of the Earth’s atmosphere: a new parameterization.- Beitr. Phys. Atmos. 53: 35-62. Giorgi, F. & Bi, X. (2000): A study of internal variability of regional climate
model.- J. Geophys. Res. 105: 29503-29521.
Hagemann, S. (2002): An improved land surface parameter dataset for global and regional climate models.- Report 336, Max Planck-Institute for Mete-orology, Hamburg.
Hernández-Díaz, L., Laprise, R., Sushama, L., Martynov, A., Winger, K. & Dugas, B. (2013): Climate simulation over CORDEX Africa domain using the fifth-generation Canadian Regional Climate Model (CRCM5).- Clim. Dyn. 40: 1415-1433, doi: 10.1007/s00382-012-1387-z.
Holton, J.R. (2004): An introduction to dynamic meteorology.- Academic Press, 1-535.
Kain, J.S. & Fritsch, J.M. (1990): A one-dimensional entraining/detraining plume model and application in convective parameterization.- J. Atmos. Sci. 47: 2784-2802.
Kuo, H.L. (1965): On formation and intensification of tropical cyclones through latent heat release by cumulus convection.- J. Atmos. Sci. 22: 40-63.
Laprise, R. (1992): The Euler equation of motion with hydrostatic pressure as independent variable.- Mon. Weather Rev. 120: 197-207.
Li, J. & Barker, H.W. (2005): A radiation algorithm with correlated-k distri-bution. Part I: local thermal equilibrium.- J. Atmos. Sci. 62: 286-309. Lorenz, E.N. (1955): Available potential energy and the maintenance of the
general circulation.- Tellus 7: 157-167.
Lorenz, E.N. (1967): The nature and theory of the general circulation of the atmosphere.- World Meteorol. Organ 218 TP 115, 1-161.
Lucas-Picher, P., Caya, D. & Biner, S. (2004): RCM’s internal variability as function of domain size.- In: J. CÔTÉ (ed), Research activities in atmos-pheric and oceanic modelling, WMO/TD, 1220, 34: 7.27-7.28.
Lucas-Picher, P., Caya, D., de Elía, R. & Laprise, R. (2008): Investigation of regional climate models’ internal variability with a ten-member ensem ble of 10-year simulations over a large domain.- Clim Dyn 31: 927-940, doi: 10.1007/s00382-008-0384-8.
Lucas-Picher, P., Cattiaux, J., Bougie, A. & Laprise R. (2015): How does large-scale nudging in a regional climate model contribute to improving the simulation of weather regimes and seasonal extremes over North America?- Clim. Dyn. doi: 10.1007/s00382-015-2623-0.
Mlawer, E.J., Taubman, S.J., Brown, P.D., Iacono, M.J. & Clough, S.A. (1997): RRTM, a validated correlated-k model for the longwave.- J. Geophys. Res. 102: 16663-16682.
Nikiéma, O. & Laprise, R. (2011a): Diagnostic budget study of the internal variability in ensemble simulations of the Canadian RCM.- Clim. Dyn. 36: 2313-2337, doi: 10.1007/s00382-010-0834-y,
Nikiéma, O. & Laprise, R. (2011b): Budget study of the internal variability in ensemble simulations of the Canadian RCM at the seasonal scale.- J Geophys. Res. Atmos. 116: doi: 10.1029/2011JD015841.
Nikiéma, O. & Laprise, R. (2013): An approximate energy cycle for inter-member variability in ensemble simulations of a regional climate model.- Clim. Dyn. 44: 831-852, doi: 10.1007/s00382-012-1575-x.
Nikiéma, O. & Laprise, R. (2015): Energy cycle associated with inter-member variability in a large ensemble of simulations with the Canadian RCM (CRCM5).- Clim. Dyn. doi: 10.1007/s00382-015-2604-3.
NL11a = Nikiéma, O. & Laprise, R. (2011a): Diagnostic budget study of the internal variability in ensemble simulations of the Canadian RCM.- Clim. Dyn. 36: 2313-2337, doi: 10.1007/s00382-010-0834-y.
NL11b = Nikiéma, O. & Laprise, R. (2011b): Budget study of the internal variability in ensemble simulations of the Canadian RCM at the seasonal scale.- J Geophys. Res. Atmos. 116: doi: 10.1029/2011JD015841. Rinke, A. & Dethloff, K. (2000): On the sensitivity of a regional Arctic cli mate
model to initial and boundary conditions.- Clim. Res. 14: 101-113. Rinke, A., Marbaix, P., & Dethloff, K. (2004): Internal variability in Arctic
regional climate simulations: case study for the SHEBA year.- Clim. Res. 27: 197-209.
Roeckner, E., Bäuml, G., Bonaventura, L., Brokopf, R., Esch, M., Giorgetta, M., Hagemann, S., Kirchner, I., Kornblueh, L., Manzini, E., Rhodin, A., Schlese, U., Schulzweida, U. & Tompkins, A. (2003): The Atmospheric General Circulation Model ECHAM5-Part 1: Model Description.- Technical Report 349, Max-Planck-Institute (MPI) for Meteorology: Hamburg.
Semtner, A.J. (1976): A model for the thermodynamic growth of sea ice in numerical investigations of climate.- J. Phys. Oceanogr. 6: 379-389. Šeparović, L., de Elía, R. & Laprise, R. (2012): Impact of spectral nudging
and domain size in studies of RCM response to parameter modification.- Clim. Dyn. 38: 1325-1343, doi: 10.1007/s00382-011-1072-7.
Sommerfeld, A., Nikiéma, O., Rinke, A., Dethloff, K. & Laprise, R. (2015): Arctic budget study of Inter-member variability using HIRHAM5 ensemble simulations.- J. Geophys. Res. Atmos. 120: 9390-9407. 10.1002/2015JD023153.
Sundqvist, H., Berge, E. & Kristjansson, J.E. (1989): Condensation and cloud parameterization studies with a mesoscale numerical weather prediction model.- Mon. Weather Rev. 117: 1641-1657.
Tanguay, M., Yakimiv, E., Ritchie, H. & Robert, A. (1992): Advantages of spatial averaging in semi-implicit semi-Lagrangian schemes.- Mon. Weather Rev. 120: 115-123.
Tiedtke, M. (1989): A comprehensive mass flux scheme for cumulus para-meterization in large-scale models.- Mon. Weather Rev. 117: 1779-1800, doi:
http://dx.doi.org/10.1175/15200493(1989)117<1779:ACMFSF>2.0.C0j2. Tompkins, A.M. (2002): A prognostic parameterization for the subgridscale
variability of water vapor and clouds in large-scale models and its use to diagnose cloud cover.- J. Atmos. Sci. 59: 1917-1942.
Undén, P., Rontu, L., Järvinen, H., Lynch, P., Calvo, J., Cats, G., Cuxart, J., Eerola, K., Fortelius, C. & Garcia-Moya, J.A. (2002): HIRLAM-5 sci entific documentation. In HIRHAM-5 Project, Swedish Meteorolog-ical and HydrologMeteorolog-ical Institute (SMHI): Norrköping, Sweden, http:// www.hirlam.org/index.php/meeting-reports-and-presentations/doc _view/270-hirlam-scientific-documentation-december-2002.
von Storch, H., Langenberg, H. & Feser F. (2000): A spectral nudging tech-nique for dynamical downscaling purposes.- Mon. Weather Rev. 128: 3664-3673.
Weisse, R., Heyen, H. & von Storch, H. (2000): Sensitivity of a regional atmospheric model to a sea state dependent roughness and the need of ensemble calculations.- Mon. Weather Rev. 128: 3631-3642.
Zadra, A., Caya, D., Côté, J., Dugas, B., Jones, C., Laprise, R., Winger, K. & Caron, L.-P. (2008): The next Canadian regional c1imate model.- Phys. Canada 64: 74-83.