Application of
a
Design Optimization Strategy to
Multi-Stage Compressor Matching
Jdr6me Bert
Dipl6me d'Inghnieur, Ecole Centrale Paris, 2005
Submitted to the Department of Aeronautics and Astronautics in
partial fulfillment of the requirements for the degree of
MASTER OF SCIENCE IN AERONAUTICS AND ASTRONAUTICS
at the
MASSACHUSETTS INSTITUTE OF TECHNOLOGY
February 2006
@ 2006 Massachusetts Institute of Technology. All rights reserved.
OF TECHNOLOGY
1
-
Author .- . . . . * . . .
,
...
Department of Aeronautics and Astronautics
February 3, 2006
m W s
Certified by...
' 7 ' ' ' ' ' " 7P fessor Z o l t h S. spakovszky
u
-3
C. S. Draper Associate Professor of Aeronautics and Astronautics
Accepted by
...
Thesis Supervisor
. . .
.-.
I..
...I
\\i
Jaime PeraireProfessor of Aeronautics and Astronautics Chair, Committee on Graduate Students
Application of a Design Optimization Strategy to
Multi-Stage Compressor Matching
by
J6r6me Bert
Submitted to the Department of Aeronautics and Astronautics on February 3, 2006, in partial fulfilment of the requirements for the degree of
Master of Science in Aeronautics and Astronautics
Abstract
A major challenge in the design of multi-stage compressors is the matching of stages to enable stable operation over a large range of mass flows and operating conditions. Particularly in turbofan low-pressure compressors, where a variable geometry cannot be implemented, design strategies for maximum efficiency at high speed can compromise the surge margin at low speed. In this thesis, a design optimization framework has been implemented to an industry-strength compressor-matching problem. The optimization framework combines a mean-line flow solver and a dynamic stability analysis of a six-stage low-pressure compressor of a modern turbofan engine to optimize the blade row geometry for enhanced stability at flight idle conditions. To assess the potential improve- ments in compressor stability at low speed, a number of optimization strategies are employed using different objective functions and stability metrics.
To estimate the performance and stability of the six-stage compressor, a mean-line flow solver is developed and coupled with a previously developed dynamic compressor-stability analysis. A fan-root flow model and an endwall loss correlation are developed using performance data provided by industry. The analysis reveals that the models enable an adequate estimation of the datum compressor performance. This methodology is then used in an optimization effort searching for the optimum compressor design.
A compressor blade parametrization based on Bezier splines is developed to explore a range of possible blade geometries. A CFD-based blade-row performance database is established using the blade-to-blade solver MISES. This facilitates an effective means to predict the blade performance for various geometries defined by the optimizer.
To find the best solution for the compressor-matching problem, a number of optimization strate- gies are applied to the datum compressor. The best result is obtained using an optimization strategy based on industry surge margin. An improvement of 14.8% in flight idle surge margin is achieved
while maintaining the design pressure ratio and efficiency at climb speed within 1% and 0.3 points of the design values respectively. A compressor design optimization based o n a dynamic-stability metric is also employed. Due to time constraints, this strategy could not be fully explored and the preliminary results suggest that further work is required.
The best results is a 14.8% improvement in the flight idle surge margin, but the re-matching
of the compressor and the associated increase in the rotor loading of the second stage entail high- risk design modifications. This suggests that, given these design limitations, the best matching is achieved by the datum configuration. In summary, the thesis demonstrates that the developed compressor design optimization methodology is applicable to industry-strength design problems, and the framework is shown to have the potential to investigate compressor designs for optimum matching .
Thesis Supervisor: Professor Z o l t h Spakovszky
Acknowledgement
I first wish to thank my advisor, Professor Spakovszky, for his guidance throughout the course of this research, his constructive comments, invaluable advice and most importantly, for having transformed this project into a great learning experience.
I wish to thank Lisa Brilliant and Kate Colson for their helpful emails and for running MISES calculations, Yuan Dong, Gavin Hendricks, Becky Rose, Tom Rogers, and Stanley Balamucky for their support and expertise, and for all the productive meetings we had at Pratt & Whitney.
I am grateful to Fran~ois and Alfonso for all the hours spent in their office, for the crappy- food-lunch-time ritual at the student center, and simply for their friendship. I would like to thank Vai-Man for all the conversations we shared, Juan for explaining me his matlab codes, and also all the GTL students for the unforgettable social hours. I also wish to thank Theo. Of course, I would like to thank my parents who played the largest role in giving me the opportunity to attend MIT in the first place and for their support and numerous encourage- ments over the last year and a half.
At last, I would like to thank Elise. Thank you for each time you came to Boston, for every minute we spent on the phone, and for much more. ..
This work was funded by Pratt & Whitney, Technical Monitor Dr. Yuan Dong. This support is gratefully acknowledged.
Contents
Abstract 3 Acknowledgement 5 Contents 7 List of Figures 10 List of Tables 14 Nomenclature 15 1 Introduction 19 1.1 Technical Background . . . 19 1.1.1 Compressor Matching. . .
19 1.1.2 Compressor Stability. . .
22 1.2 Previous Work. . .
261.2.1 Stall Inception and Active Control
. . .
261.2.2 Dynamic Stability Metric
. . .
261.2.3 Generic 3-Stage Compressor Design Optimization . . . 29
1.3 Nature of the Issue . . . 30
1.4 Scope of the Thesis . . . 31
1.4.1 Goals . . . 31
1.4.2 Research Questions
. . .
311.4.3 Technical Roadmap
. . .
321.4.4 Outline of the Thesis . . . 35
2 Datum Compressor Performance and Stability Estimation 36 2.1 Compressor Performance Estimation . . . 36
. . .
2.1.1 Overview 36
. . .
2.1.2 Fan Root Model Description 38
. . .
2.1.3 Compressor Performance Estimation at Design Conditions 39. . .
2.1.4 Off-Design Performance Estimation 41
. . .
2.2 Compressor Stability Estimation 43
. . .
2.2.1 Dynamic Stability Compressor Model 43
. . .
2.2.2 Stall Line Estimation 47
3 CFD Based Blade Performance Database 49
. . .
3.1 Nature of the Issue 49
. . .
3.2 Parametric Description of Blade Profiles 50
. . .
3.2.1 Blade-Profile Parametrization 50
. . .
3.2.2 Thickness Distribution 52
. . .
3.2.3 Assessment of Blade Profile Parametrization 54
. . .
3.3 Database 55
. . .
3.3.1 Optimization Parameter Choice 55
. . .
3.3.2 Optimization Parameter Range 55
. . .
3.3.3 Database Generation 57
4 Datum Compressor Performance 58
. . .
4.1 Implementation of Compressor Performance Estimation Method 58. . .
4.2 Datum Compressor Performance Estimation 61
. . .
4.3 Datum Compressor Matching 64
5 Implementation of the Optimization Framework 68
. . .
5.1 Optimization Strategy 68
. . .
5.1.1 Optimizer Settings 68
. . .
5.1.2 Assessment Met rics 69
. . .
5.2.1 Interpolation within the Blade Performance Database . . . . . . 5.2.2 Uncertainty Analysis
6 Compressor Design Optimization
6.1 Optimization Result Using a SMind Based Objective Function . . . . . . 6.1.1 Optimization Strategy
6.1.2 Compressor Performance Optimization Results . . . . . . 6.1.3 Analysis of the Results
. . . 6.1.4 Compressor Design Implications
. . . 6.1.5 Discussion of Results
6.2 Optimization Result Using an Sd Based Objective Function . . . . . . 6.2.1 Setup of the Optimizer
. . . 6.2.2 Preliminary Results
. . . 6.2.3 Discussion of Results
7 Summary and Conclusions
. . . 7.1 Compressor Performance Estimation
. . . 7.2 Blade Performance Prediction
. . . 7.3 Compressor Design Optimization Results
. . . 7.4 Recommendation for Future Work
List
of
Figures
Velocity triangles for the front and back-end stages at design condition (dotted
. . .
line) and at low speed (solid line).
(Kerrebrock[9])Two early high-pressure ratio. multi-stage compressors and their characteristics
.
Types of compressor instabilities: a.
surge: low-frequency average mass flow oscillations and b.
rotation stall: local mass flow variations with rotating wave. . .
structures
Compressor static stability: Point A is statically stable; point B is statically
. . .
unstable
Two compressors with the same growth rate of flow-field perturbations at
. . .
point 1 but with different robustness (adopted from Castiella [I])
. . .
Compressor maps of compressors A and B (adopted from Castiella[l])Sd versus SMNASA for compressors A and B of figure 1.6 (adopted from Castiella
[I])
. . .
. . .
Optimization Framework
Sketch of the gas-path geometry of the 6-stage low-pressure compressor inves-
. . .
tigated
. . .
Low pressure compressor blade rows
. . .
"3D/2Dn loss coefficient description
The low-pressure compressor is divided into three distinct compressor blocks Speed line adjustment: The blue speed line is modified to match the industry
. . .
data in red (this is a sketch and is not to scale)
. . .
Representation of the compressor in the dynamic stability model
Eigenvalues of the harmonics 1. 2. and 3 for operating points at mass flow larger than the mass flow at surge point at design speed
. . .
Blade profile parametrization. . .
Definition of the blade metal angles and flow angles used. . .
Blade-profile parametrization: thickness distribution composed by four Bezier
. . .
segments. (Figure not to scale) 53
Blade-profile parametrization: comparison between datum-blade profile (in red) and parameterized-blade profile (in blue). The two contours are super- imposed.. . . 54 Comparison between computed (MISES) loss buckets of the parameterized- blade profile (in blue) and loss buckets of the datum-blade profile (in red). The two loss buckets compare well, and the blade parametrization is assessed. Loss is expressed in terms of loss coefficient versus flow angle. . . . 55 Effects of a 4" variation in stagger angle (a) and camber angle (b) on loss buckets. On both plots, the blue bucket corresponds to the lower value of blade angle, and the red bucket corresponds to the higher value of blade angle. 56 Blockage at each compressor axial location from Stator 1 trailing edge to
. . .
Stator 6 trailing edge. 59
Corrections (in degrees) added to the blade-row deviation angles for different rotor speeds. . . 59 "3D/2DV loss coefficients applied to the blade-row 2D losses for different rotor speeds
. . .
60 Baseline compressor map. The performance estimation is plotted in blue; the performance measurements are plotted in red. The measured operating line is plotted as the black dashed line. . . . 61 Compressor efficiency map. The performance estimation is plotted in blue; the performance measurement is plotted in red. . . . 62 Blade-row loss buckets of the datum compressor at design speed. From left to right are plotted the surge point (denoted SP), the design point (denoted OP), and a point on the choke side of the compressor characteristic (denoted. . .
Blade-row loss buckets of the datum compressor at flight idle conditions. From left to right are plotted the surge point (denoted SP), the design point (de- noted OP), and a point on the choke side of the compressor characteristic (denoted CP).
. . .
The low-speed surge margin versus Rotor 2 geometry (stagger and camber angles). Other blade rows are kept at their baseline geometries.. . .
Variations of Rotor 2 geometry (stagger and camber angles) during one com- plete optimization. The full 2" parameter ranges for these angles have not. . .
been explored.
Comparison between the optimized-compressor map (SMind optimization) and the datum-compressor map
. . .
Comparison between the opt imized-compressor map (S Mind optimization) and the datum-compressor map (low-speed enlarged view). . .
Comparison between the optimized-compressor efficiency map (SMkd opti- mization) and the datum-compressor efficiency map.. . .
a) Variation of blade stagger angles and b) variation of blade camber angles between the optimized-compressor blades and the datum-compressor blades . SMind-based optimization: bladerow loss buckets at low speed surge point for the datum compressor (in blue) and the optimized compressor (in red). The solid-red line corresponds to the loss buckets interpolated using the database; the dashed-red line corresponds to loss buckets computed by MISES.. . . .
Changes in the incidence angles (a) and the flow angles (b) between the datum compressor and the optimized compressor for the SMind-based optimization. Blade-row loss buckets at the design speed operating point for the datum compressor (in blue) and the optimized compressor (in red) (SMkd-based op- t imization).
The solid-red line corresponds to loss buckets from t he database; the dashed-red line corresponds t o loss buckets MISES provides.. . .
6.8 a) Variation of the diffusion factor of the blade rows and b) variation of the work coefficient of the rotor blade rows a t the design-speed operating point. . 86 6.9 Sd-based optimization: comparison between the resulting-compressor map
List of
Tables
Compressor-performance comparison between estimation and measurement . Surge-margin comparison between estimation and measurement
. . .
Blade row loss for three Rotor 2 geometries. . .
Constraints used in the SMind-based optimization. . .
Comparison between optimized-compressor performance and datum-compressor performance on the operating line for the SMind-based optimization.. . .
Changes in the flow angles, the inlet blade metal angles and the incidence angles between the datum compressor and the optimized compressor for an SMind-based optimization.. . .
Constraints used in the Sd-based compressor design optimization.. . .
Sd-based optimization: changes in blade angles between the resulting com- pressor and the datum compressor. The changes are negligible.. . .
Sd- based optimization: comparison between output-compressor performance and datum-compressor performance on the operating line.. . .
Nomenclature
Acronyms CFD EC IC LPC MG MIT OP P RComputational Fluid Dynamics
Choke Point: operating point on the choke side of the compressor characteristic Diffusion Factors
Exit Conditions Initial Conditions
Low Pressure Compressor Moore-Greitzer
Massachusetts Institute of Technology Operating Point
Pressure Ratio Surge Margin Surge Point
Sequential Quadratic Programming
Greek
a Absolute flow angle
P
Relative flow angleP*
Blade metal angleY
Stagger angle A Finite variation6 Deviation angle, correction to deviation angle, variable increment 8 Angular coordinate in the cylindrical frame, camber angle
Blade passage inertia St at or blade row inertia Pressure ratio
Growth rate of the flow field perturbations, solidity Unsteady loss time lag
Flow coefficient
Pressure rise coefficient
Rot ation rate of the flow field perturbations
Roman
AR Blade row area-density ratio b Baseline blade parameter value B Transmission matrix CX Axial chord det Determinant 1 Index j Complex number kt Throttle coefficient L Loss coefficient
rh
Mass flowM Number of discreet point on the compressor characteristic n harmonic number, integer
Nstage Number of stage P Pressure
P Blade parameter r Radius
Robustness, rotor blade row Laplace variable, eigenvalue Stator blade row
Dynamic stability metric Maximum blade thickness
Temperature, transmission matrix Wheel speed
Flow velocity
Location of maximum blade thickness Weight distribution Superscripts
-
Linearized quantity - Mean quantity 7Quantity evaluated in the relative frame datum Relative to the datum compressor TS Total-to-static ss Steady-state Subscripts 1 Upstream 2 Downstream
,,,,
Corrected quantity I Isentropicini Initial, baseline quantity operating At operating point
Defined by NASA
R Rotor
r e f Reference rot Rotor
s Stator
speed Rotor speed sta Stator
surge At surge point S Y S System
T Stagnation quantity
x In meridional direction
Chapter
1
Introduction
1.1
Technical Background
1.1.1 Compressor Matching
Compressors are generally designed to maximize pressure ratio and efficiency at design conditions, or cruise conditions, since the engine operates there during most of its mission. However, at other flight conditions compressors still need to meet off-design performance and operability requirements. High-pressure ratio, multi-stage compressors in aircraft en- gine have some difficulties achieving operability requirements at these off-design operating conditions (Kerrebrock (91).
At design conditions, the compressor geometry is designed to meet the pressure ratio and efficiency requirements. For a constant flow coefficient throughout the compressor, the gas-path cross-section area needs to be reduced as pressure builds up through the machine and the flow density increases. The flow-path area at every stage of the machine is thus set by design conditions and design-performance requirements.
At flight idle conditions, the rotor speed is about 40% of the design speed, and the mass flow through the compressor is much less than the design mass flow, so the reduction in the flow-path area is no longer correct. For the front-end stages, since mass flow is low and the flow-path area is large, flow coefficient is low and incidence angles on the blade rows
Velocity Triangles
Front stage Back s t age
Figure 1.1: Velocity triangles for the front and back-end stages at design condition (dotted line) and at low speed (solid line). (Kerrebrock[S])
increase as shown in Figure 1.1. This change in incidence angles leads the front stages to stall. However, at the back end of the compressor, the pressure is low compared to the design conditions. The flow density is thus also reduced and the flow velocity increases to satisfy mass flow conservation: flow coefficient is high and incidence angles on the blade rows decrease (Figure 1.1). This change leads back end stages to choke. For both the front end and the back end of the compressor, the blade performance and global compressor performance deteriorate.
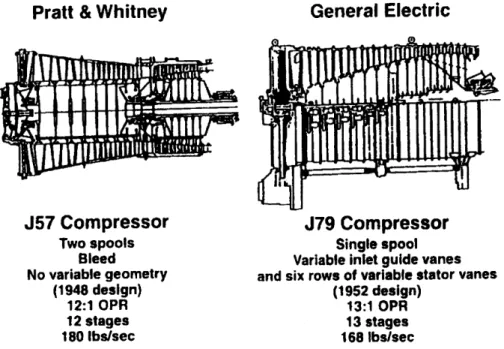
This simple example shows the difficulty of designing a compressor with high performance a t design point and good operability at off-design conditions, i.e., matching the compressor. These problems appeared with the emergence of the design of high-pressure ratio compres- sors in the 1950s, and compressor designers had to find solutions to alleviate the problem. Figure 1.2 gives two examples: the 557 compressor by Pratt & Whitney designed in 1948 and the 579 compressor by General Electric designed in 1952.
Pratt & Whitney
General Electric
557 Compressor
Two spools Bleed No variable geometry (1 948 design) 12:1 OPR 12 stages 1 80 Ibslsec579 Compressor
Single spool Variable inlet guide vanesand six rows of variable stator vanes (1 952 design)
1 3 1 OPR
13 stages
168 IbsJsec
Figure 1.2: Two early high-pressure ratio, multi-stage compressors and their characteristics.
Pratt & Whitney divided the compressor spool into two distinct parts to achieve a higher rotor speed at the back end of the compressor than at the front end. Pratt & Whitney also introduced air bleeds to decrease the mass flow at the rear of the compressor and thus ac- commodate for the lower density at low speed. GE introduced the solution of variable stator vanes: variable inlet guide vanes and six rows of variable stator vanes were implemented to modify blade angles and accommodate variations in flow angle.
Modern low-pressure compressors usually have fixed geometry, since they have no room for variablegeometry blade rows. Also, variable-geometry blade rows and multiple shafts yield a dramatic increase in engine weight and structural complexity. Thus, a real challenge in striving for high thrust-teweight ratios is to match mult i-st age compressors without using any of the above solutions.
1.1.2 Compressor Stability
Compressors are subject to two types of instabilities, as presented in Figure 1.3. The first,
on the left, is called surge and is a large scaled, one-dimensional, low-frequency oscillation of the compressor mass flow. The second, rotating stall, is a rotating flow disturbance produced
by the separation of the flow from the compressor blades. Once the flow separates from an
airfoil, the incidence angle on the next airfoil increases, causing flow separation on the next
airfoil. The flow disturbance propagates around the compressor annulus. While in rotating stall, the compressor operates at roughly steady reduced mass flow and pressure rise.
Rotating Wave S bruct~ure
Figure 1.3: Types of compressor instabilities: a. surge: low-frequency average mass flow oscillations and b. rotation stall: local mass flow variations with rotating wave structures
For a given rotor speed these phenomena occur for a low value of mass flow passing through the compressor. They can damage and reduce the life of the engines. Preventing these phenomena from taking place within the compressor increases engine lifetime and reduces the costs of maintenance.
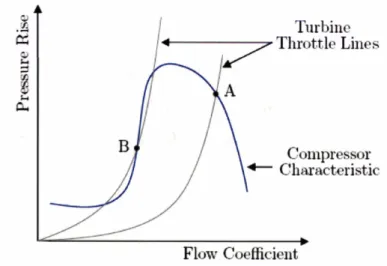
There are two criteria to assess the stability of a compressor. The first is a static stability criterium (Greitzer [8]). The steady-state operating point of the compressor is, as shown in Figure 1.4, at the intersection of the compressor characteristic and the throttle line. Static stability requires that the operating point move back toward its location after a small perturbation in mass flow.
3
&
Throttle Turbine Lines3
!
a
Flow Coefficient
Figure 1.4: Compressor static stability: Point A is statically stable; point B is statically unstable
.'I.
Figure 1.4 shows that the throttle line m k t have a slope higher than the compressor
,. . I
characteristic. At location A, if the mass flow decreases, pressure in the combustion chamber ' . '
becomes higher than needed by the turbine, and more mass flow is pumped through the 1 <
I : J
compressor. At location B, however, the same decrease in mass flow leads to a pressure
in the combustion chamber too low for the turbine to maintain the mass flow; therefore the mass flow through the engine decreases. Thus, point A is statically stable, point B is statically unstable.
the operating point, and the unstable point or surge point. There are two different ways of measuring the margin or "distance" between the operating point and the surge line. In industry practice, the surge margin refers to the margin between the operating point and the surge point a t the same corrected mass flow. Industrial surge margin is defined as:
- S M 1 n d = T ~ u r g e T o p e r a t i n g
T o p e r a t i n g corrected mass f l o w
(1.1)
This definition of surge margin is used to account for uncertainties in the corrected speed - during gas turbine acceleration, for example. According to Cumpsty [2], for operation at constant corrected speed, the surge margin definition should take into account the change in compressor outlet flow, a measure of the throttling process which is necessary to take the compressor into stall. The NASA surge margin definition follows this recommendation:
SMNAsA = 1 - T o p e r a t i n g mcorr, Surge
T s u r s e ' mcorr, Operating m r r e d e d rotor speed
The second criterion for stability refers to dynamic stability and is usually violated first. Greitzer [8] explains that while static instability is associated with a pure divergence from the operating point, dynamic instability is associated with growing oscillatory motions.
Rotating stall and surge phenomena are the mature forms of small amplitude perturba- tions in the flow field ([13]). Dynamic stability is concerned with the evolution and growth of these small amplitude perturbations. The value of the growth rate of the perturbation determines whether or not the compression system is dynamically stable. If this growth rate is positive, the perturbations grow exponentially and lead to compressor surge or stall. However, if the growth rate of the perturbations is negative, the perturbations are damped and the compressor is st able.
Moore and Greitzer (131 found that the the growth rate of the perturbations o is propor- t ional to the slope of the non-dimensional tot al-to-st atic compressor characteristic:
with
where Qts is the non-dimensional total-to-static pressure rise coefficient, is the flow coefficient, n is the harmonic number, p is the total blade row (rotor and stator) inertia, c,
is the blade axial chord, r is the blade row mean radius, and y is the blade stagger angle.
In the compressor model used in the Moore-Greitzer theory, the effects of the blade rows on the compressor stability are all taken into account through a single inertia parameter. The compressor model used throughout this thesis differs in that it captures the effects of each blade row on the flow-field perturbations separately. Independently considering the effects of each blade row on the compressor stability enables one to design each blade row to maximize compressor stability. Hence this compressor model is appropriate for a compressor design problem. This compressor model used in this thesis will be discussed later in Chapter 2.
1.2
Previous Work
1.2.1 Stall Inception and Active Control
Since the early work of Emmons [5] in 1955, stall inception has been studied by numerous researchers. Moore [12] and Moore and Greitzer [13] provided the basis for many investiga- tions, by developing a flow model for axial compressor able to predict compressor stall. The Moore-Greitzer model assumes the existence of circumferential traveling disturbances prior to compression system instability. Experimental work by McDougall et a1 (111, Garnier et a1 [7], gave a validat ion to this assumption. Predicting compressor inst ability and measuring pre-stall flow perturbations enables the active control of the compression systems to modify their stability and operability. This idea was first articulated by Epstein et a1 [6]. A sum- mary of the recent research done in the field of active control is provided by Paduano et a1
1141.
1.2.2 Dynamic Stability Metric
Castiella [I] compared the industrial surge margin and NASA surge margin with the growth rate of the flow-field perturbations for a 3-stage generic compressor to show that neither of the two surge margin definitions correlate with dynamic stability. Based on these observations, Castiella [I] developed a new stability metric using dynamic stability consid- erations. The new stability metric, denoted by Sd, consists of two parts: 1) the growth rate of the flow-field perturbations, and 2) the robustness of the compression system stability as related to changes in the operating conditions. In concert with the Moore-Greitzer theory, the first part is related to the slope of the total-to-static non-dimensional compressor char- acteristic. The second part takes into account the shape of the compressor characteristic in
order to guarantee the robustness of the compressor stability as related to changes in the operating conditions.
-
Flow coefficient
Figure 1.5: Two compressors with the same growth rate of flow-field perturbations at point 1 but with different robustness (adopted from Castiella [I])
As shown in Figure 1.5, compressor A and B have the same growth rate of flow-field perturbations at condition 1, but for the same change in throttle area, compressor A remains stable (the slope of the characteristic is still positive at point 2) and compressor B becomes unstable (the slope of the characteristic is negative at point 2'). This difference between compressors A and B is taken into account in the Sd metric via the robustness parameter R. The Sd metric is defined as follows:
where o is the growth rate of the flow-field perturbations and R is defined as the geometric average of the derivative of o with respect to the location on the characteristic (throttle
coefficient
b)
for M points on the characteristic:In the following example, two compressors A and B (Figure 1.6) demonstrate the benefit of the Sd metric as compared to surge margin. Compressors A and B feature the same operating line and surge line. However, their characteristics are vastly different: compressor . ' A has steeper characteristics than compressor B across the full compressor map. .
Figure 1.6: Compressor maps of compressors A and B (adopted from Castiella[l])
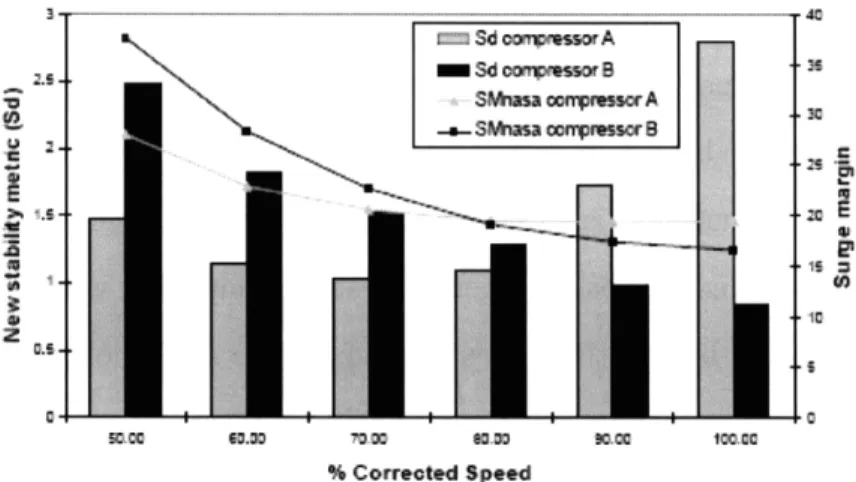
Examining the evolution of stability metrics with rotor speed shows that, contrary to the surge margin, Sd reveals major differences in the stability of these compressors. As can be seen in Figure 1.7, the industrial surge margin is the same for compressor A and B at every speed and the surge margin defined by NASA reveals a reduction in stability with speed for both compressors. But the Sd metric shows a deterioration in stability for compressor B and
% C o m M Speed
Figure 1.7: Sd versus SMNASA for compressors A and B of figure 1.6 (adopted from Castiella [I1 )
an increase in stability for compressor A. At low speed, compressor B yields higher levels of robustness than compressor A. However, compressor A's stability increases with rotor speed due to the stabilization of the flow-field perturbations. This example demonstrates that, as opposed to surge margin, Sd is able to capture quantitatively the dynamic stability of the compression system. Finally, this result suggests to use Sd as a compressor design variable to enable compressor designs with enhanced dynamic stability.
1.2.3 Generic 3-Stage Compressor Design Optimization
In order to assess the benefits of using an optimization framework to design compressors with enhanced performance and stability, Castiella [I] applied an optimization framework to a generic 3-st age compressor. Castiella tried two optimization strategies to optimize the performance and stability of the compressor, one using Sd in the objective function, the other using the efficiency. The optimizations produced encouraging results. The dynamic stability of the compressor could be improved by 23% using the Sd-bssed objective function. The surge
margin SMind also increased by 3.8 points throughout the operating envelope. The efficiency could be improved by one point on average across the compressor map using the efficiency- based objective function. In both cases, altering the blade geometry to modify the compressor matching achieved improvement. It is important to note that the level of improvement should be regarded with caution since the baseline generic 3-stage compressor was matched far from optimum. The motivation behind this thesis is t o apply the methodology to an industry- strength problem and to rigorously assess the feasibility of this idea.
1.3
Nature of
the Issue
The compressor studied in this research is a modern 6-stage low-pressure compressor from industry. This compressor yields relatively low stability at flight idle conditions. The goal is to investigate whether flight idle surge margin SMind can be improved through a better matching of the stages while maintaining the compressor performance at high power. The compressor has no room for variable geometry blade rows; therefore, the question is whether flight idle stability can be improved by optimizing the compressor matching for maximum surge margin at low speed with performance constraints at high speed.
Applying the compressor design optimization framework to this industry strength prob- lem implies that specific tools need to be developed. In particular, a mean-line flow solver must be developed and adapted to this 6-stage compressor in order to estimate with accu- racy the compressor performance and compare it to performance measurements provided by industry.
The strategy used to achieve an improvement in flight idle surge margin consists of applying several compressor design optimizations that differ in terms of objective function, stability metric, constraints, and initial condition.
1.4
Scope of the Thesis
The challenge behind this thesis is to improve the flight idle surge margin of an actual low pressure compressor from industry, while maintaining its performance and stability at high power during climb and cruise. Since the low pressure compressor architecture has no room for variable stator vanes, improvements must be achieved by rematching the compressor. The idea is to employ a compressor design optimization framework that combines a blade- teblade solver with a dynamic compressor-stability analysis to optimize the compressor blade-row geometry. This optimization is done using different strategies, that is, different objective functions and different stability metrics, to search for the best compressor matching solution.
1.4.1 Goals
The success goal defined by the project sponsor is to achieve an improvement in the flight idle (43% speed) surge margin SMind of three points at a cost of less than a 1% drop in pressure ratio and a one point drop in efficiency at high speed during climb (108% speed) and cruise (100% speed).
Another aim of this thesis is to implement and evaluate the design methodology and framework on an industry-strength problem and to assess potential benefits of a dynamic- stability metric as compared to surge margin considerations.
1.4.2 Research Questions
This thesis addresses the following research questions:
0 An accurate estimation of datum-compressor performance is of the utmost impor-
tance t o the optimization effort since any performance improvement is sensitive to the baseline performance. This raises the question of whether the measured compressor
performance can be adequately estimated using a mean-line compressor performance calculation. Put another way: what level of detail is necessary in the mean-line code and how would one account for three-dimensional loss and endwall effects?
o In previous work by Castiella [I], the optimization methodology applied to a simple generic compressor yielded encouraging results, but is this design optimization method- ology applicable to industry-strength design problems?
o What benefits in operability can be achieved if the compressor design is optimized based on the surge margin SMind or on the dynamic-stability metric Sd?
1.4.3 Technical Roadmap
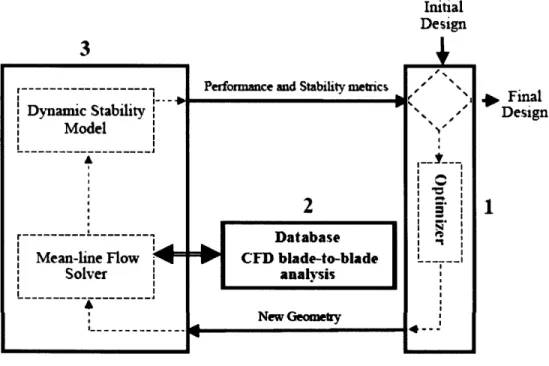
The design optimization methodology implemented in this research is computer-based, with an objective function based on compressor performance and/or stability metrics. The optimizer searches the space of possible compressor geometries to minimize the objective function. The possible compressor geometries are geometries for which the gas path is unaltered but the stagger and camber angles of the blades rows are changed (except for the fan rotor and the last stator of the machine). The optimizer thus forms the central part of the framework. The optimization framework is shown in Figure 1.8 and consists of three distinct modules: the optimizer, the blade-performance predict ion module, and the compressor performance and stability prediction module.
1. The optimizer uses Matlab's optimization toolbox function "fmincon," which imple- ments a sequential, quadratic programming algorithm (SQP) commonly used for constrained non-linear problems. Once the problem variables, the objective or cost function, and the constraints are specified, the optimizer finds a minimum of the objective function. This
h h a l Design
+
Final Design1
Figure 1.8: Optimization Framework
optimization problem has a total of 20 variables: the stagger and camber angles of stator 1 to rotor 6 blade rows. The objective function to be minimized is a combination of compres- sor performance and/or stability metrics evaluated at different operating conditions. And finally, the problem constraints require that the high-speed pressure ratio drop a t operating point (100% and 108% speed) does not exceed 1% of the baseline value, and that the high- speed efficiency drop at operating point (100% and 108% speed) does not exceed one point. Compressor geometries for which high-speed pressure ratio and efficiency requirements are not satisfied are not taken into account by the optimizer.
At every iteration, the optimizer defines a new compressor geometry for which the ob- jective function must be evaluated. Evaluating the objective function is the purpose of the two other modules of the framework: the compressor performance and stability prediction module (module 3) and the blade-performance prediction module (module 2).
2. The role of the blade-performance prediction module is to provide blade-row per- formance parameters such as deviation angle, profile loss, and profile-loss derivative with
respect t o flow angle. These parameters are specific to the new blade geometries defined by the optimizer and to the flow conditions -- Mach number and flow angle - specified by the compressor performance and stability module.
Running in real time both an optimization and a CFD software to compute blade-row performance for each new blade profile would require months of calculation. To reduce the computing time required by the optimizer, a database is established that contains blade row performance information for a very large number of possible blade profile geometries. The database can be created before carrying out the optimization effort, so the computing t,jmp.
can be minimized.
3. The compressor performance and stability prediction module evaluates the objective function for a new compressor geometry defined by the optimizer. This module uses required blade row performance data provided by module 2 in the framework. This part combines a mean line flow solver and the dynamic stability compressor model developed by Spakovszky [161.
The mean line flow solver uses the blade angles from module 1 and the blade profile loss and deviation angles from module 2 to compute compressor pressure ratio and efficiency. The dynamic stability compressor model uses the blade geometries and the associated profile- loss derivatives with respect to flow angle from module 2 to predict compressor stability. Combining these two tools allows one to construct the part of the compressor map needed to evaluate the objective function. Module 3 finally sends back to the optimizer the value of the objective function and the pressure ratio and efficiency at high speed to check if the constraints are satisfied.
In summary, a t every iteration, the optimizer (module 1) generates a new compressor and then module 2 and 3 compute the new compressor map and evaluate the objective function. Finally, the result is returned t o the optimizer which repeats the process depending on the value of the objective function.
1.4.4 Outline of the Thesis
The thesis is organized as follows. Chapter 2 provides a description of the optimization framework's module 3
,
including the mean-line flow analysis and the dynamic stability compressor model. Chapter 3 explains how the blade performance database is defined and computed. The datum compressor performance and stability estimation are then discussed in Chapter 4. Chapter 5 presents the implementation of the optimization framework to the compressor matching problem at hand. The results of the compressor design optimization strategy applied to the datum compressor are presented in Chapter 6. Finally, Chapter 7 summarizes the approach of the project and the results, and gives some recommendations for future work.Chapter
2
Dat
urn
Compressor Performance and
Stability Estimation
This chapter describes how the datum-compressor performance and stability are esti- mated using a mean-line flow calculation code and a previously developed dynamic-stability compressor model. The methodology used to estimate the datum-compressor performance and stability is also used as module 2 of the optimization framework to predict the perfor- mance and stability of each new compressor defined by the optimizer.
For each set of operating conditions (mass flow and rotor speed), the mean-line flow calculation calculates the compressor pressure ratio and the compressor efficiency. The dynamic-stability compressor model predicts if the compressor is stable or not. Combining these two tools enables one to determine the complete compressor map, including the surge line.
2.1
Compressor Performance Estimation
2 .I
.I
OverviewThe 6-stage low-pressure compressor under investigation can be divided into the fan-root section followed by a 5;-stage LPC. The gas path is shown in Figure 2.1 and Figure 2.2 shows the LPC blade rows. The idea of the research is to optimize the LPC matching by modifying the blade row geometry of stator 1 through rotor 6. The fan root cannot be altered, and a specific model is developed to estimate its performance.
FAN ROOT
:'. ' . Figure 2.1: Sketch of the gas-path geometry of the 6-stage low-pressure compressor investi- . . . . . . . . . . gated . . , - . . a
.
a . , . . , . . . . . . . . . a,.. - . . . . .d. . . . . . - . . . . . . . , . .The LPC performance is estimated using a mean-line flow calculation that involves to two successive steps: 1) estimating the operating line and, 2) estimating off-design performance.
2.1.2 Fan Root Model Description
The main difficulty in describing the fan-root performance arises from the fact that the separation between the flow entering the core of the engine through the low-pressure compressor and the bypass flow happens downstream of the fan. The flow-path area across the fan root is thus undefined and varies with the rotor speed and the mass flow.
Since the fan root is not included in the optimization, a simple fan-root model is es- tablished and used to estimate the compressor performance. The model assumes that the fan-root loss and loading depend on rotor speed only and are thus held constant for a given speed. Consequently, the flow path area upstream and downstream of the fan root depends only on rotor speed. The main parameters defining the fan-root model are:
o Flow-path area upstream and downstream of the fan root
o Fan-root loss
0 Fan-root loading
o Fan-root loss coefficient derivative with respect to flow angle
(g)
necessary for thedynamic stability compressor model
Measurements of the flow-path areas upstream and downstream of the fan and of the fan loss and loading at 40%, 60%, 80%, and 100% speed operating point were supplied by
industry. The fan-root
$
parameter is adjusted to match the surge point on these four speed lines to the data. A linear interpolation with rotor speed provides the value of these four parameters at any rotor speed.At low speed (below 60% speed), the fan performance depends on the mass flow. Since the model needs to account for this, a mass flow dependance is added to the fan parameters. Finally, at under 60% speed, the parameters of the fan root model depend on rotor speed and mass flow.
2.1.3 Compressor Performance Estimation at Design Conditions
The purpose of this step is to estimate accurately compressor pressure ratio and effi- ciency at each operating point. To ensure that the compressor is correctly matched, velocity triangles at the mean streamline are compared with the industry-supplied data. To estimate the global compressor performance, a model accounting for endwall effects is added to the mean-line calculation.
The first step in the compressor performance estimation at operating conditions is thus to determine the velocity triangles. Industry-supplied data provides velocity triangles at each axial location of the compressor, blade-row loss, and flow states for every streamline. This data was generated using a streamline code and experimental data. First, industry blade loss and deviation corresponding to the mean streamline is used in the mean-line flow calculation. The velocity triangles thus calculated are compared to the velocity triangles from the data. Then blockage at each axial location of the compressor can be determined by matching the calculated meridional flow velocity with the meridional flow velocity supplied
by industry. The blockage is defined as:
A a c t u a ~
k =
A e f f edlve ' (2.1)
Industry data is provided only for 40%, 60%, 80% and 100% speed operating points. Therefore, blockage is determined only for these operating points. Linear interpolation is used to determine the blockage at other rotor speeds. The blockage is assumed independent of mass flow.
The next step involves using computed blade deviation angles in the mean line flow calculation. The deviation angles are estimated using: 1)the deviation angle provided by MISES that varies with rotor speed and mass flow, 2) a correction 6,, specific to each blade row linearly dependant on rotor speed only.
For the same blade profile, deviation angles computed using the blade-to-blade flow solver MISES slightly differ from the deviation angles found in industry data. Therefore, a small correction 6,, is added to the deviation angle given by MISES. These corrections 6,,, depend only on the rotor speed.
The last step consists of accounting for endwall losses in the mean-line calculation. The blade row stagnation pressure loss is determined using: 1) the blade profile loss (2D) com- puted in MISES which varies with rotor speed and mass flow and, 2) a "3D/2DV loss coef- ficient specific t o each blade row, a linear function of the rotor speed only, to account for endwall losses. The 2D loss is multiplied by a "3D/2Dn loss coefficient. For each blade row, the "3D/2D7' loss coefficient is determined based on the ratio of the mass-average loss over the loss at the industry-provided mean streamline. Figure 2.3 shows a schematic description of the "3D/2Dv loss coefficients.
Since industry data is provided for 40%, 60%, 80%, and 100% speed only, the "3D/2D7'
f mass average loss
loss
*
Figure 2.3: "3D/2DV loss coefficient description
loss coefficients are first determined for these speeds. Linear interpolation is used to calculate t h e "3D/2D7' loss coefficients at any rotor speed. This 3D loss model is deemed sufficient for this application and as will be shown later, this model adequately estimates of compressor performance.
2.1.4 Off-Design Performance Estimation
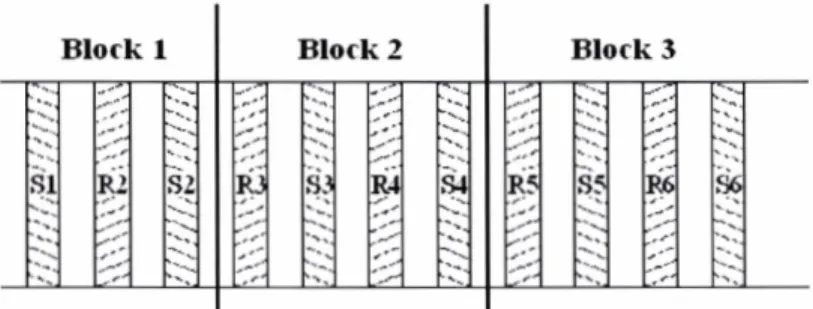
The shape of the speed lines at off-design conditions depends mainly on the blade-row loss and deviation angles that vary with mass flow. In order to account for the streamline contraction and endwall effects, the LPC is divided into three compressor blocks, as shown in Figure 2.4. This enables altering the loss and loading of a given part of the compressor independently. For a given rotor speed, a loss multiplier and a deviation-angle multiplier is applied to each compressor block. They enable light modifications of the loss and loading of the corresponding block and modify the shape of the speed line.
As shown in Figure 2.5, the estimated speed line (the pressure ratio and efficiency curves) is compared to the industry data. Loss and deviation multipliers can be chosen t o match
Figure 2.4: The low-pressure compressor is divided into three distinct compressor blocks
the two c u ~ v a . This p~oeess is done iteratively to obtain an adequate level of accuracy
Figure 2.5: Speed line adjustment: The blue speed line is modified to match the industry data in red (this is a sketch and is not to scale).
Loss and deviation multipliers are determined for 4096, 60%, 80%, and 100% speeds. In between these speeds, loss and deviation multipliers are linearly interpolated.
The compressor map can be constructed using the fan root and the simple endwall loss models. The assumption is made that these models do not change with the compressor design. Therefore, the parameters introduced (correction to deviation angles, "3D/2DV loss coefficients, and loss and deviation multipliers) are kept the same during the optimization
effort.
iteration. To evaluate the objective function, the compressor map of the new compressor is predicted using the same performance estimation methodology as for the datum compressor.
2.2
Compressor Stability Estimation
2.2.1 Dynamic Stability Compressor Model
The compressor model used throughout this thesis is a model developed by Spakovszky [16]. As mentioned in the first Chapter, this compressor model differs from the model used by Moore and Greitzer in that it captures the effects of each blade row on the flow field perturbations separately. The dynamic-stability compressor model makes the following assumptions:
o Flow is incompressible1 ( ~ a c h number assumed small enough)
0 Reynolds number effects are neglected
o Small perturbations are assumed so that the problem can be linearized
o Hub-tetip ratio is high enough to assume two-dimensional flow
o Viscosity and heat transfer are neglected in the inlet and exit ducts and in the inter- blade-row gaps.
o Blade row unsteady deviation effects are neglected
o The blade rows are modeled as semi-actuator disks with unsteady blade-passage fluid inertia and unsteady loss terms.
' ~ o t e that all mean flow quantities used in this model are based on the compressible mean-line perfor- mance estimation and that the incompressible flow assumption is only made for small perturbations of the flow field (i.e. entropy waves are neglected).
A dynamic analysis is performed for each of the compression system's component: rotor and stator blade rows, and also inlet, exit and inter blade-row axial gaps. These compressor components are shown in Figure 2.6.
Inlet duct
Figure 2.6: Representation of the compressor in the dynamic stability model
For each component, the governing equations are linearized and solved for the perturba- tion in pressure, meridional, and angular velocity. The flow perturbations are broken down into perturbation harmonics using Fourier series. For each harmonic, the system of equa- tions relating the downstream perturbation to the upstream perturbation can be written in a matrix form to give the component's transmission matrix. (For a detailed derivation,
see Spakovszky [16]). The transmission matrices yield three fundamental types of perturba- tions: two potential-like perturbation types or potential modes (denoted An and Bn for n-th harmonic) and one vortical perturbation type or vortical mode ((7,).
Blade-row transmission matrices depend on the blade geometry and the mean-line flow conditions. Transmission matrices for a rotor-blade row and a stator-blade row can be written as follow: P 1
-
-
AR 0 t a n b AR 0tan,& - Arot(s
+N)
)
lAR)
- -
-VX2 - Ve2 tan ,82 a L g 1
avo1 ~+TR(s+*) 1 _L.,. 1
-2
tancul avzl ~+T,(s+*)+
Vxl
-
For an entire system of compressor components, a system transmission matrix can be obtained by successively multiplying the component transmission matrices. The entire com-
e".8
(2.3) Bsta, = ( - h a s+
V22 - Ve2 tan ~ 2 ) / A R - aLSS b L S S-
-sl v " - 3 e i T k av,, I + T ~ S+
Vx1-
-
-
1 AR 0-
tan a2 AR 0 .fle (2.4)3 1 (s ) "' "f i" ~ :'j! L~UO pus '3 1 uo!lnlos ls!n!~$-uou s my ~ -2 uo!lsnb3 :ss u al pM aq us3 u o! q !p u 03 kspunoq malsLs aq& .~ ~U O! $~ ~O JJ ! paurnssm o s~ s s ! MOB mva~$sdn -~ossa~duro3 aql moJj Ls ~s Lmap L 1 uo us3 sapom 1squa$od aql '~ossa~duro3 ayl jo msaJlsuMop pus ma ~l sd n sp np q@ual aquyu! %u!mnsss 'lsyl Ljpads suo!llpuo3 L~spunoq aq& .uo!$spm~oj uralqo" anlsnua3!a us ol spsal Lllsuy suo!$rpuo3 L~spunoq qxa pus lap! 3u!Ljpads
modes. One eigenvalue is written as:
where a, and w, are the growth and rotation rates of the perturbation wave.
A positive growth rate means that the perturbation is growing exponentially with time and the compressor is unstable. If, on the other hand, the growth rate of the perturbation is negative, the perturbation amplitude decreases with time. If the growth rates of all modes is negative for all the perturbation harmonics, the compressor is dynamically stable. As shown by Castiella [I], the first harmonic of the least stable mode is generally the first one to become unstable. Considering the growth rate of this harmonic only suffices to assess compressor dynamic stability.
2.2.2 Stall Line Estimation
For a given rotor speed, the stall point is defined by the growth rate of the flow-field perturbations cr of zero. Hence, the stall point can be found by computing the compression system eigenvalues. For a first value of mass flow, the dynamic stability analysis provides the eigenvalues of the compression system. If the least stable eigenvalue is negative (if the compressor is stable), the mass flow is reduced; if the compressor is unstable, the mass flow is increased. The new mass flow defines a new point on the speed line and the process is repeated until it finds the neutral stability point of the speed line, at which point the real part of the least stable eigenvalue is zero.
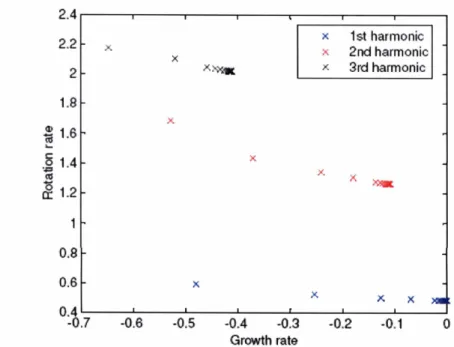
Figure 2.7 shows the eigenvalues of the least stable mode for harmonics 1, 2, and 3 as the mass flow converges towards the mass flow of the surge point. The first harmonic is the first
Gmwth rate
Figure 2.7: Eigenvalues of the harmonics 1, 2, and 3 for operating points at mass flow larger than the mass flow at surge point at design speed.
one to become unstable, and the neutral stability point is reached when the growth rate of this harmonic is zero.
To determine the stall line on the compressor map, stall points at several speeds (for example 40%, 47%, 59%, 71%, 79%, 91%, and 99% speed) are computed using the dynamic- stability model. Then interpolation is used to estimate the stall line on the compressor map.
Chapter
3
CFD Based Blade Performance Data-
3.1
Nature of the Issue
To evaluate the objective function for a given geometry defined by the optimizer, nu- merous points on the compressor map must be calculated. As seen in Chapter two, the calculation for a single operating point on the compressor map requires the computation of deviation angles and profile losses for all of the blade rows. The derivatives of profile loss with respect to axial and tangential velocities are needed as input to the dynamic-stability model. Depending on rotor speed and mass flow, the flow angle and inlet Mach number of each blade row vary. Therefore, to compute the entire compressor map, blade deviation angles and losses are needed for a large range of flow angles and Mach numbers.
Running MISES online with the optimizer for each blade profile defined during the op- timization process is too costly in computing time. Hence another approach needs to be found.
One possible approach is to create a database that gathers the required information. This database is created as follows:
o Develop a parametric description of the blade profiles.
range of possible variation around the datum value. Then discretize the corresponding domain of the possible blade geometries. For every point of this discrete domain, the blade profile is generated using the parametric description of blade profiles and MISES is run to determine blade performance.
During the optimization effort, blade performance for a specific blade geometry defined by the optimizer is calculated using a linear interpolation between the blade performance of the closest blade geometries present in the database.
3.2
Parametric Description of Blade Profiles
One description method needs to capture all of blade profiles defined by the optimizer during an optimization effort, especially the blade profiles of the datum compressor. Blade performance is sensitive to the leading edge of the blade profile and hence, the leading edge must be carefully described. The blade profile is constructed using a camber line to which a thickness distribution is added. Camber line and thickness distribution are parameterized using blade-geometry parameters such as blade angles, chord, and thickness, for example.
3.2.1 Blade-Profile Parametrization
Seven independent parameters are chosen to parameterize the blade camber line and thickness distribution. These parameters are presented schematically in Figure 3.1:
o Axial chord
o Camber angle (0)
0 Ratio unstaggered inlet metal angle tcl over camber angle (p parameter p = K ~ / O ) ~
o Blade maximum thickness in percentage of axial chord (t,)
o Location of maximum thickness in percentage of axial chord (x,)
o Solidity ( 0 )
:. f :*
..-\,!
'
Axial
cbord
i
Figure 3.1 : Blade profile parametrization
Figure 3.2 defines the flow angles and blade metal angles used in this thesis.
First the camber line is defined in terms of a third-order polynomial that uses information such as stagger angle and camber angle, axial chord, and p parameter. The axial chord and
2this parameter is necessary to determine the unstaggered inlet and exit blade angles from the camber angle
Rotation
Stator
Figure 3.2: Definition of the blade metal angles and flow angles used.
the stagger angle define the camber line endpoint location. The staggered blade-metal angles
p;
and ,8,* define the camber line slope at the two endpoints as follows:and
where nl and n2 are the unstaggered blade-metal angles.
3.2.2 Thickness Distribution
A thickness distribution is added to the camber line. The thickness distribution is defined
by four Bezier splines that depend on the maximum blade thickness
t,
and the location ofmaximum blade thickness in percentage of chord xm. The four Bezier splines are shown in
Different thickness distributions were tried to match original compressor-blade profiles, and Bezier splines provided the best result. Bezier splines are third-order polynomials defined by four parameters: two endpoints and the slope of the spline at each endpoint.
For each segment of the blade profile, t,, x,, and the camber line define the location of the two endpoints of the segment, and the two other parameters can be adjusted to fit the datum-blade profile. Eight parameters thus define the thickness distribution.
Figure 3.3: Bladeprofile parametrization: thickness distribution composed by four Bezier
segments. (Figure not to scale)
. . . -- - - - -
, As shown in Figure 3.4, the parameterized-blade profile compares well with the datum-
. - . - . . .
# .
blade profile. Note that the leading edge is well described. . - - - .
- . - , . . . <
-Each datum-blade profile is parameterized &ingka inique set of parameter values. During
the optimization effort, the optimizer can modify the stagger and camber angles of the blade rows, and all other parameters of the blade description are fixed to their datum values.
Figure 3.4: Blade-profile parametrization: comparison between datum-blade profile (in red) and parameterized-blade profile (in blue). The two contours are superimposed.
3.2.3 Assessment of Blade Profile Parametrization
Before the database is established, one must make sure that the blade-profile parametric description accurately represents the datum-blade profiles. To assess this, for each blade row MISES computations are conducted and the loss bucket of the parameterized-blade profile is compared to the loss bucket of to the datum-blade profile. Parameter values of the profile description are adjusted until the comparison between loss buckets yields errors less than 1% (Figure 3.5).
Figure 3.5: Comparison between computed (MISES) loss buckets of the parameterized-blade profile (in blue) and loss buckets of the datum-blade profile (in red). The two loss buckets compare well, and the blade parametrization is assessed. Loss is expressed in terms of loss coefficient versus flow angle.
Database
3.3.1 Optimization Parameter Choice
0.08 0.07 0.06. 0.05 0.04 0.03 0.02
The blade parameters that are changed in the optimization effort are the stagger angle and the camber angle. Stagger and camber angles govern the turning of the flow and thus have a major effect on the blade loading, loss, and deviation angle.
One could choose to let the optimizer alter more blade parameters during the optimization effort. However, doing so would increase the computing time required to compute the blade- performance database and run the optimization.
5" * T T ', . Mach = 0.1
:
. s 8 . ..
.
. - .**@tL
/
,
. . 0.04 0.035. 0.03. 0.025. 0.02. 0.015.3.3.2 Optimization Parameter Range
To limit the time required to compute a blade-row performance database, the number of values of stagger angle and camber angle in the database is limited to five. So a database for a single blade row consists of 25 data sets. For the stagger and camber angles, the possible values in the database are:
. Mach = 0.4 .
.
.
.
*Il,
J 0.035~ 0.03 0.025 0.015 . Mach = 0.6 - . ' .i:d?
where b is the datum-angle value and 6 is the bladeangle increment value.
For each blade row, 6 must be chosen taking into account the loss bucket's sensitivity to changes in blade angle. A large value of 6 increases the blade-angle range but decreases the database accuracy. However, a reduced value of
S
increases the database accuracy but limits the blade-angle range.Figure 3.6: Effects of a 4" variation in stagger angle (a) and camber angle (b) on loss buckets. On both plots, the blue bucket corresponds to the lower value of blade angle, and the red bucket corresponds to the higher value of blade angle.
Figure 3.6 shows the loss-bucket sensitivity to camber and stagger angles for Stator 3. On the left, the two loss buckets correspond to blade profiles with the same camber angle and a 4" difference in stagger angle. On the right, the stagger angle is the same for the two buckets, but there is a 4" difference in camber angle. The loss buckets are significantly different, and a 4" range seems large enough for stagger and camber angles. So the S value chosen for Stator 3 is 1". As will be seen later, the value of S ensures adequate database accuracy.


![Figure 1.5: Two compressors with the same growth rate of flow-field perturbations at point 1 but with different robustness (adopted from Castiella [I])](https://thumb-eu.123doks.com/thumbv2/123doknet/14029350.457989/27.918.246.621.233.504/figure-compressors-growth-perturbations-different-robustness-adopted-castiella.webp)