an author's http://oatao.univ-toulouse.fr/23302
Nasri, Mondher and Garnier, Christian and Abbassi, Fethi and Brault, Romain and Dalverny, Olivier and Zghal, Ali Experimental study of 48600 Carbons fabrics behavior using marks tracking technique method. (2016) In: 6th International Symposium on Aircraft Materials, ACMA 2016, 11 May 2016 - 13 May 2016 (Agadir, Morocco).
Experimental study of 48600 Carbons fabrics behavior using marks
tracking technique method
M. Nasri†, C. Garnier*, F. Abbassi†‡, R. Braut**, O. Dalverny*, A. Zghal†
†URMSSDT, ENSIT, University of Tunis, 5 Av. Taha Hussein, BP 56, Bâb Manara, 1008 Tunisia
*University of Toulouse, INP-ENIT/LGP, 47 Av. d’Azereix, 65016 Tarbes, France.
‡Mechanical Engineering Department, College of Engineering, Dhofar University, PO Box
2509, Postal Code 211 Salalah, Sultanate of Oman
**
Nimitech Innovation, 1 Av. des victimes du 11 juin 1944, 65200 Bagnères-de-Bigorre, France
Abstract
Lightweight and energy saving are the main challenges in the aircraft industry production, that explain the increase of composite demand and the diversity of its applications. The investigation of the shear behavior and stiffness of technical woven fabric are essential to guarantee the performance of the final product. In case of forming process (for example RTM process), the in-plane deformability of the woven fabric is necessary for forming without creating defects. The change of the fiber orientation (warp and weft) have a significant impact on final mechanical properties. In this study, the use of marks tracking technique allow the determination of the rigidity of 48600 C 1300 carbon fabrics, and allow calculation of their shear angle, lock angle during tensile and bias-extension tests.
1.
Introduction
In recent years, composite materials have been used increasingly in industries. Their technical specifications, as the ratio of strength /weight, corrosion resistance, and mechanical resistance will lead to major advances e.g. the decreasing of the weight of structures or the vibration damping. In the aerospace industry, the composite materials are used extensively. The forming process of woven composites can be classified under two categories: liquid composite molding (LCM) process and using process of semi-finished products (prepregs, compounds) .The choice of the manufacturing process in the industry is done by a high speed of production and a high quality of the final product. Several compression molding processes exist ( cold compression,
hot pressing )[1]. Double curvature parts of polymer matrix composites reinforced with woven
fabric can be elaborated using resin transfer molding (RTM) process, in which firstly, the dry woven reinforcements are formed and secondly, the resin is injected to obtain the final shape
[2, 3]. This method has several disadvantages according to different points of view: difficulty to control the final shape and the effective mechanical properties, high costs implementation, low rates production. Some others problems are related to the preform deformation draped: tensions fibers between longitudinal and transverse direction, fiber misorientations, wrinkling or local
buckles [5]. The quality of the preformed shape can be analyzed by the estimation of the woven
elongation, the shear angle and the final orientation of fibers. In order to understand the behavior of the carbon fabrics during preforming process, it is strongly recommended to carry out some basic mechanical tests. These tests lead to the determination of the physical properties of dry reinforcements (stiffness modulus, shear modulus, Poisson’s ratio, locking angle), which will be introduced in the forming simulations. In this context, we propose to study the 48600 carbon fabrics. Two mechanical tests are performed: a tensile test and a bias test. During this
tests, an advanced measurement method called ‘marks tracking technique’ is used to predict the displacement of yarns and their blocking angle. This optical method consists in tracking some specific points stated on the front face of sample. The recorded displacement of the points allows the determination of the shear angle and the strain of the samples. A comparison between measured and theoretical shear angles was done. The low shear rigidity of the 48600 fabric has
been evaluated in the results of the bias tests [6].
2.
Characterization methodologies of woven fabric
To characterize the shear behavior of the woven, several investigations can be conducted from various tests. The KES-F test (Kawabata Evaluation System for Fabrics), uses a woven specimen size of 200 mm x 50 mm. The sample is maintained by two opposed stop and a shear
load is applied at constant speed [7]. The “picture frame” test is a metal square articulated with
four arms, developed for woven textiles. This test consists in imposing a pin-joint restriction on the shear specimen in order to produce homogenous kinematics in the specimen. However, it is
extremely sensitive to specimen misalignment issues [8, 7]. The “bias test” or “bias extension
test” is used to characterize the shear properties of the fabrics. The shear solicitation is pure on
the specimen but non-homogenous along it[9]. For this test, the specimen is relatively
insensitive to misalignment. It is simple to implement, but some precautions are taken during
the preparing of the specimen, such as ensuring the correct orientation of the yarns(figure 1).
The advantage of bias test relative to the picture frame is the absence of tensile stress on yarns
in central of the specimen [10].
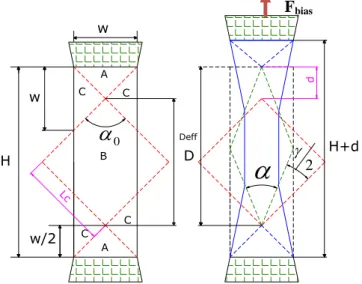
Figure 1: Schematics shapes of the bias extension test (undeformed and deformed) During bias extension tests, the angle α, between warp and weft, gradually decreases. Such case leads to a compaction of yarns followed by a locking until it reaches a threshold of shear angle
denotedlock [8]. The shear locking angle is defined as a limit angle before creation of defects.
After this threshold is reached, the formation of local wrinkles begins, producing a defect on
shaping composite parts [4]. In this test, three regions, called A, B and C (Figure 1), can be
clearly identified [7]. The first area ‘A’ corresponds to the attachment areas of the specimen
without shear. The second one ‘B’, located in the center of the specimen corresponds to the pure sheared area. Finally, several halves shear zones correspond to portions containing warp and
weft yarns of which both ends have free (partially sheared areas),as presented in Figure 1,(Zone
C).
0
2 Fbias H w w/2 H+d A B C C A C C D Deff w Lc dUsing a simple kinematic analysis, in the central area, the theoretical shear angle of zone B can be calculated [11]:
D
d
D
ar
2
cos
2
2
2
(1)Where D is the initial diagonal length of the zone B and d is the displacement of the mobile clamps of the tensile machine. This expression is only valid with the following hypotheses:
warp and weft yarns rotate without slipping and the strain of yarns is homogeneous partially.
The shear angle can be calculated in the central region using a fictive shear frame, according to
the extension of the test specimen, and its initial dimensions [10]. Hence, the sear angle is
calculated by the following formulae:
) 1 ( 2 2 cos 2 2 2 1 W H d
(2)3.
Experimental setup
3.1.
Material
To determine the behavior of woven carbon reinforcements, tensile and bias extension tests were carried out to following three directions (0°, 45° and 90°). In this work, the used carbon
fabric is the HexForce 48600 1300 C [6] .This fabric is a twill 2 × 2 weave with a 0.62 thickness
ply. This fabric is considered to be balanced (50% of yarns longitudinally and transversally). The fabric properties are presented in the Table 1.
Table1:Properties of the carbon fabric 48600 C 1300
Designation Weave style Type of yarns Nominal weight Nominal construction
48600 C 1300 Twill 2×2 T700SC 12K 50C 600 g/m2 3.7 yarns/cm
3.2.
Sample design
In the literature, there is no standard form of specimens for fabric characterization tests [8, 10].
Several studies specify the choice of specimen dimension in order to get a pure shear zone in the center of specimen: the ratio λ between the length and the width of the specimen should not be
smaller than 2 [10, 7]. In this study, this ratio is 3.The geometrical details are shown in figure 2.
L Total length 270±0.5mm
L1 Distance arm parts 150±0.5 mm
L2 Jaws distance 170±0.5 mm
L3 Plates length 60 mm
b Specimen width 50±0.5 mm
C Thickness of heels 5 mm
h Specimen thickness 0.62mm
3.3.
Displacement measurement by marks tracking method
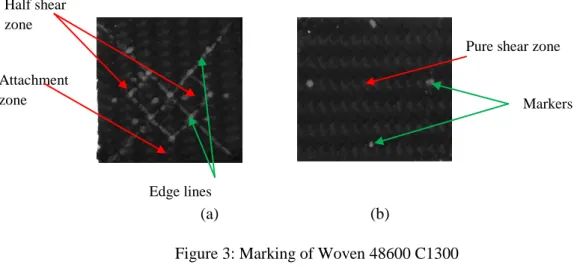
The fundamental principle of marks tracking method is to mark previously dry reinforcements
with painted points at strategic locations, as illustrated in Figure 3. This procedure allows the
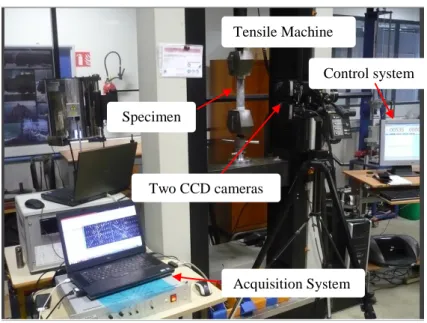
determination of the position of each markers for every configurations, and calculates the displacements of these points between initial and deformed configurations. The objective of such an apparatus is to follow, in real time, the behavior of yarns by tracking markers. Two CCD cameras are positioned to measure and systematically register two configurations, initial and final of yarns. In fact, the calculation of the 3D marker positions is done from a standard
network of markers whose positions of the left camera are known
xg,yg,zg
in the referenceright camera
(
X
d,
Y
d,
Z
d)
. The measurement of positions during loading is performed by astereo-image correlation system.
The used DIC system is the GOM ATOS system with the software Aramis. The numerical image acquisition is 1392 x 1040 pixels and the resolution of the measure of surface displacement is less than 15µm. Images are recorded during the test and analysed by the software Aramis, developed by GOM, in order to determine the full field displacements of
markers [12]. The focal length of objectives used is 35mm for the tests at 0°/90° and 12 mm for
the tests at 45°.
Figure 3: Marking of Woven 48600 C1300
4.
Mechanical Tests
4.1.
Test 0°/90°
Tensile tests along warp and weft directions (0 ° / 90 °) are carried out on samples presented in chapter 3.2. In order to avoid slipping between the specimen and the jaws, we have used dimensions steel plates for clamping (60 mm × 50 mm). The tests are performed at a test speed
of 10 mm/min on an Instron 550R testing machine (figure 5). The load cell is 100 kN, and the
controlled room temperature is 22 ° C. The fabric is placed without any pre-loading; the displacement and load are set to “0” as references of the test.
4.2.
Bias-extension test
Bias tests are used to characterize the shear mechanisms of fabric reinforcement. Considering the low values of the forces involved during this test, a 500 N load cell is used on the Instron
Pure shear zone
Markers Half shear zone Attachment zone Edge lines (a) (b)
550R tensile machine. These tests are carried at room temperature (22°C) at a test speed of 10
mm/min. and load–displacement diagrams are recorded. The sample length/width ratio
equalsto 3 and the initial angle between warp and weft is 90°.
5.
Results and discussion
5.1 Tensile tests results
The figure 5 shows the typical load–displacement curve for the 0° tensile test, which shows the variation of the force depending on the displacement of the clamping jaws. This curve is composed of three distinctive parts. In fact, the first one is nonlinear until displacement of 1.7 mm. This stage corresponds to the setting up of the woven, reducing the crimp phenomenum in this direction until the yarn is in tension. At the yarn strain beginning, the stiffness is non-linear and is increasing until a linear trend. The second part is linear and corresponds to the tension of the fabric until maximum load (around 9200 N). The last part is the progressive deterioration of specimen until full unweaving of the fabric. The stiffness of the fabric K is calculated using the
mean slope in part 2. In this case, Kfabric0° = 4897 N/mm.
Specimen
Control system
Two CCD cameras
Acquisition System Tensile Machine
5.2 Results of the bias extension
The response of the global fabric deformation 48600 C 1300 in the 45° direction is shown in
Figure 6. It is observed that the load recorded is very small. In fact, this load increases to a maximum value of 5.5 N, and then decreases progressively. As for the resultant displacement, it
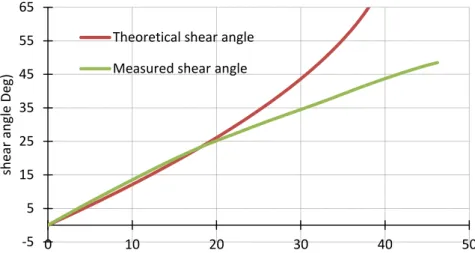
reaches 50 mm at failure. Figure 7 shows the evolution of the measured shear angle during the
test versus the displacement in the central area of specimen. This measured shear angle is
compared with the theoretical values calculated with Eq. (2). A good correlation is observed
between measured and calculated angle until 23°. After this value, a deviation between the theoretical shear angle and measured shear angle is observed, as a result of slipping at the frontier between the three areas of the specimen. In order to validate the tests, the evolution of
shear angles at seven positions, in three zones, are measured, as illustrated in figure 8. It can be
seen that the distribution of shear angles αi and βi measured in zone B is uniform, similar
observation of which can be found in [13]. Therefore, the slip appearance at the interface
between the zones allows stopping the increase of shear in the central area.
Figure 6: Results of bias test of 48600 C 1300
-1 0 1 2 3 4 5 6 0 10 20 30 40 50 60 70 Loa d (N) Displacment (mm) Mean curve of 48600 C 1300_Bias test
Figure 5 : : Results of tensile test of 48600 C 1300 in weft direction
-2000 0 2000 4000 6000 8000 10000 12000 0 1 2 3 4 5 Lo ad (N) Displacement (mm) Mean curve of 48600 C 1300_weft direction 1 2 3 Deformation of the specimens Failure of the specimens
6.
Conclusion
This paper presents an experimental study of mechanical characterization of fabric 48600 C 1300. Uniaxial tensile tests and bias-extension tests are carried out with the application of the marker tracking method. This technique has two interests: the visualization of the deformation of the yarns and the tracking of different markers during tests. This experimental setup allow the determination of the displacement fields and the calculation of fabric stiffness and shear angle. This experimental setup is validated by the calculation and the correlation of different shear angle in each area. Measured shear angle in area C is the half the shear angle in area B and the shear angle in area A is very low. These measurements validate the hypothesis of the bias tests.
-5 5 15 25 35 45 55 65 0 10 20 30 40 50 sh ear an gl e De g) Displacement machine (mm) Theoretical shear angle
Measured shear angle
0 10 20 30 40 50 60 0 10 20 30 40 50 60 Sh ear an gle (De g) Displacement machine (mm) beta1 alpha1 alpha4 alpha7 alpha5 alpha6
Figure 7: Theoretical shear angles and measured of 48600 C 1300