Contents lists available atScienceDirect
Sustainable Cities and Society
journal homepage:www.elsevier.com/locate/scsAnalysis tool for bioclimatic design strategies in hot humid climates
Shady Attia
a,⁎, Théo Lacombe
a,b, Hery Tiana Rakotondramiarana
c, François Garde
d,
GholamReza Roshan
eaSustainable Building Design Lab, Dept. UEE, Faculty of Applied Science, Université de Liège, Belgium bEPF Graduate School of Engineering, Sceaux, France
cInstitute for the Management of Energy (IME), University of Antananarivo, P.O. Box 566, Antananarivo 101, Madagascar dUniversité de la Reunion, Piment Laboratory, Le Tampon, Reunion, France
eDepartment of Geography, Golestan University, Gorgan, Iran
A R T I C L E I N F O Keywords:
Passive design Climate analysis Thermal comfort Sustainable building design Hot climates
Climate visualisation
A B S T R A C T
Housing projects design in cities should be based on an understanding of the urban local climate; selection of fit-to-purpose thermal comfort models and implementation corresponding design guidelines and best practices. In this context, we developed an analysis tool for bioclimatic design recommendations for architects in Madagascar. The aim of this tool is to support the decision-making process of architects and urban planners by proposing environmental design guidelines for Antananarivo and Toamasina, the two largest cities on the island. Firstly, we performed a climate zoning of the island based on altitude, solar irradiation and dry bulb temperature. Secondly, we developed a bioclimatic analysis based on temperature and humidity levels. The results show that ASHRAE adaptive comfort model is the best model for both cities because it can tolerate higher humidity limits of up to 80% or more. The natural comfort potential varies from 22 in Antananarivo to 45% in Toamasina. Results can be used to create informative bioclimatic analysis visualisations to better assess climate and determine thermal comfort models for other cities in hot-humid climates. The capabilities of the tool allow architects and urban planners to better understand the climate and propose practical design guidance.
1. Introduction
The Kyoto protocol recommendations for reducing greenhouse emissions have forced governments to focus on the reduction of energy consumption in cities. To achieve this goal city planners and architects require understanding recent climatic data to apply bioclimatic design principles and solution to existing and new buildings (Attia & Duchhart, 2011;Santamouris et al., 2001). It is widely accepted, that the present and future of sustainability in cities and societies is influenced by our understanding of climate at an urban and regional scale (Attia, Gratia, De Herde, & Hensen, 2012;Kim, Gu, & Kim, 2018;Stavrakakis et al., 2012). According toStavrakakis et al. (2012)climatic zoning and mi-croclimate conditions must be quantified and visualized before and after the architectural intervention. Wide-scale applicability of climate analysis tools in the design practice of cities and buildings are identified as essential conditions to set comfort boundaries and for making in-formed design decisions (Tejero-González, Andrés-Chicote,
García-Ibáñez, Velasco-Gómez, & Rey-Martínez, 2016 andZhang, Wang, & Zhou, 2017). However, there are relatively few tools to translating re-cent climate data into a form that an architect or urban planner can work with in association with simple comfort rules and best practice design recommendations. Although large amount of data exists on cli-mate, these data are stored in databases that can difficult to access. Furthermore, although analytical tools are available for quantifying the potential effectiveness of design strategies, such as Climate Consultant (Milne, Liggett, & Al-Shaali, 2007) and ECOTECT Weather Tool (Autodesk, 2018), many depend on static comfort models for fully space-conditioned buildings, do not cater for free-running buildings in hot humid climates and require significant analytical expertise. Archi-tects and urban planners need the ability to assess the potential of ap-plying bioclimatic design strategies in relation to adaptive comfort models within cities with hot humid climate at relevant urban and building scales.
Despite its importance being acknowledged in literature, so far, only
https://doi.org/10.1016/j.scs.2018.11.025
Received 5 July 2018; Received in revised form 15 November 2018; Accepted 15 November 2018
Abbreviations: ASHRAE, American Society of Heating, Refrigerating and Air-Conditioning Engineers; FGD, Focus Group Discussions; HR, humidity ratio; HVAC, Heating, Ventilation and Air Conditioning; GIS, geographical information system; MADEEHI, matière de maîtrise de l’Energie-Eau-Habitat-Informatique-Anthropologie à Madagascar; PMV, predicted mean vote; SRTM, Shuttle Radar Topography Mission; TMY, typical meteorological year
⁎Corresponding author.
E-mail address:[email protected](S. Attia).
Available online 16 November 2018
2210-6707/ © 2018 Elsevier Ltd. All rights reserved.
limited attention has been paid to the ability of architects to understand climatic data plotted on psychrometric charts. The psychrometric chart is helpful in illustrating climatic data and thermal comfort conditions. It is also widely used by engineers and other professionals in the HVAC field. However, the problem remains that the psychrometric chart can be difficult to comprehend by architects and even engineering under-graduate students (Attia, Gratia, & De Herde, 2013; Bhattacharya & Milne, 2009;Biasca, 2005). Most architects are confronted with the chart without understanding exactly what psychrometrics is. Section 2.1: State of the Art, provides a detailed literature review for this pro-blem. Providing explanation of how it relates dry bulb temperature, relative humidity, dew point temperature, and absolute humidity does not make it easier to understand. Requiring significant analytical ex-pertise to understand contribute to the controversial reputation of the psychrometric chart, which may be one of the reasons why the in-formative potential of such chart is largely unused in practice among architects.
Therefore, we present a climate analysis tool that can make climate analysis more accessible, practical and useful in hot climates. To tool was developed and tested with a focus on two Malagasy cities namely Antananarivo and Toamasina. To develop the tool, we performed a climate zoning of Madagascar based on altitude, solar irradiation and dry bulb temperature. The objective of this research is to develop an adequate climate comprehension of the island’s climate with a focus on Antananarivo and Toamasina. We established a link between altitude, solar radiation and outdoor temperature profiles to propose a simple mapping of the island while considering meteorological phenomenon. We worked with weather data provided by both the National Meteorological Services (DGMM 2018) and extrapolated by Meteonorm (Meteotest, 2017). Then, we developed a new climate analysis tool linked to the two major cities of Madagascar, Antananarivo and Toa-masina. In the paper, we show how the open-source tool provides de-signers a simplified method of climate zoning to create bioclimatic charts in a more convenient way for determining suitable design solu-tions. Moreover, we propose appropriate thermal comfort boundaries for these two cities based on similar thermal comfort models used in South-East Asia (see Section3.2). Finally, we present simple bioclimatic analysis charts for architects and urban planners prior to building de-sign to achieve comfort.
This study contributes to research efforts that analyses and visualise climatic data for sustainable cities development (Cicelsky & Meir, 2014; Gaspari, Fabbri, & Lucchi, 2018;Nguyen & Reiter, 2014;Stavrakakis et al., 2012). We provide a user friendly and freely available tool. This tool was designed with a range of architects in mind. For less technical users it provides access to simple comfort graphs analysis based on existing data. The tool is applied to two cities in hot humid climate (Toamasina and Antananarivo). The development of the new tool to analyse the climatic characteristics of Madagascar, was achieved through the creation of 7 climatic zones and selection of optimal comfort model using recent high-resolution weather data.
1.1. State of the art of climate analysis tools and climate zoning
This section presents the actual state of the art for Madagascar’s climate and the most commonly used thermal comfort models in hot humid climates. We introduce the reader to similar studies and identify the most relevant publications that have tried to characterize the cli-mate of Madagascar.
1.2. Similar studies
Our study is part of numerous studies that aim at developing climate analysis tools and thermal outdoor comfort models in hot climates. There are several tools that can be listed here including the work of Attia et al. (2012);Nguyen and Reiter (2014);Milne (2016)andKha, mbadkone, and Jain, (2017). However, to develop an effective climate
analysis tool, it should be based on accurate climatic zoning and locally adapted thermal comfort models. Bioclimatic zoning is essential to design comfort and energy-efficient buildings. Also, thermal comfort models require special attention because the most commonly used models do not prove to be adapted for hot and humid climates, as shown in the studies ofNicol (2004)andToe and Kubota (2013). The surveys conducted show that people tend to accept a higher and wider range of temperature in hot humid climates than predicted and this result in the use of air conditioning when not needed. Based on our literature review we can group the state-of-the-art publications into two categories.
The first category includes those studies that aim to classify and characterize the weather in hot and humid climates. By quantifying and classifying the climate statistically, using recent weather files, we can create realistic representations and understanding of local climate. The high data resolution of current weather files allows the avoidance of generalization and pseudo-perception about a city’s climate. For ex-ample, in North-East IndiaSingh, Mahapatra, and Atreya, (2007)used the ambient temperature, relative humidity and rainfall monthly average values for 30 years to establish four climate zones.Lau, Lam, and Yang, (2007)realized two classifications in China also according to solar radiation and thermal conditions. Then, they analysed the inter-section of each map to propose a recommendation. Also,Nguyen and Reiter (2014)created a climatic zone classification based on thermal perceptions of inhabitants in Vietnam. They developed a new method to assess the comfort zones based on typical meteorological year (TMY) files and comfort surveys of local inhabitants. They presented their results using a psychrometric chart suggesting a new comfort model.
The second group of publications found in literature aims to develop bioclimatic analysis tools. The most cited publications refer to Climate Consultant (Milne, 2016). Climate Consultant’s strongest feature is the visualization of weather data using a psychrometric chart while pro-viding design recommendations to architects. However, the tool is strongly biased toward American comfort models, with a focus on temperate and cold climates. Recently,Khambadkone and Jain (2017) developed a bioclimatic analysis tool suitable for a climate zone that was previously established. They based their work on TMY data from field measurements and made a seasonal analysis for climate. However, their tool is not suitable for use outside of India’s climate. Psychro-metric charts were also used by several authors includingMahmoud (2011), in Egypt, to analyse bioclimatic zones. The authors relied on ASHRAE Standard 55 to define a thermal comfort model. Based on the review above, we can realize that most existing climate analysis tools rely on comfort models developed from the northern hemisphere or cater for specific countries.
In the context of Madagascar, the study byRakoto-Joseph, Garde, David, Adelard, and Randriamanantany, (2009)developed a climate zoning scheme. However, the climatic characterization was done se-parately from providing a climate analysis tool. Therefore, there is a need to study the hot humid climate of Madagascar and develop thermal comfort models and tools based on the socio-economic condi-tions of local inhabitants.
1.3. Studies on the climate in Madagascar
The latest studies on climatic zoning of Madagascar were published byRakoto-Joseph et al. (2009), and Peel, Finlayson, and McMahon, (2007)published their studies based on Köppen − Geiger classification. The first study defined three climatic zones specific to Madagascar. The authors used temperature, wind speed and solar radiation to determine the existence of six major climatic zones. Their data were gathered during a period of 29 years but lack geographical precision. To propose a climate zoning for thermal building design, Rakoto-Joseph et al. (2009)based their final zoning on the average temperature and hu-midity of the hottest and coldest month values.
zoning based on rainfall, outdoor air temperature and temperature variations. Their results divided the island into nine climatic zones (shown inFig. 1). Compared to the work ofRakoto-Joseph et al. (2009), their study provided more detailed zoning. However, their climatic zoning lacks some weather parameters, such as the solar radiation and humidity, for establishing climate-responsive building design re-commendations. Also, differences between these climate zones have no significant impact on building design. Moreover, making specific re-commendations for nine zones is laborious. On the one hand, we have a classification with few zones that are generic and may not reflect actual climate. On the other, we have numerous zone classifications that may prove insignificant in terms of difference in building design. Our study, therefore, will propose a climate zoning with high resolution and sig-nificant building design zones. Our new climatic zoning builds up on both studies and goes beyond their limitations.
Finally, our review can be summarized under the following issues: 1 Up to now, and based on our literature review, we could not find any decision support method or tool that supports designers to create climate-responsive building designs for Madagascar. 2 Madagascar’s climate has been studied by a limited number of
re-searchers. The current increase in population and the accelerating urban sprawl requires detailed urban climate characterization. This includes the determinations of the heating degree days and cooling degree days.
3 Regarding the existing thermal comfort models found in the litera-ture, we could not identify a specific comfort model adapted to Madagascar’s urban climate.
The above-mentioned issues indicate a knowledge gap that requires being bridged. Without addressing these issues, we will not be able to provide accurate and climate-responsive design recommendations. The increasing urban population in Madagascar requires energy-efficient and the healthy planning and design of the built environment. Our study builds on the continuum described above and aims to reduce this knowledge gap.
2. Methodology
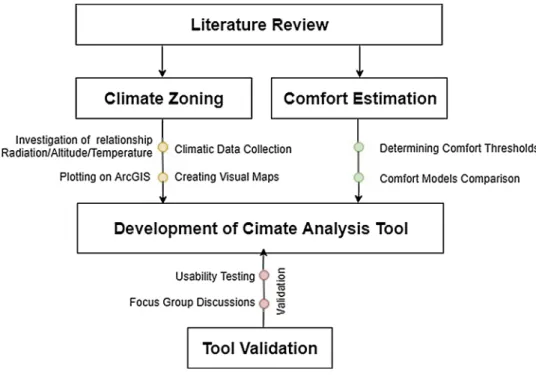
As a follow-up to the literature review continuum we developed a conceptual framework that summarizes and visualizes our research methodology. As shown inFig. 2our conceptual study framework is based on five axes that will be described in the following sections. To define climatic zones a quantitative analysis was performed. The aim of defining new climatic zones was to generate a more accurate climate sub-zoning that will benefit from the presence of recently published weather data by the National Meteorological Service of Madagascar (DGMM, 2016) and link it to a fit-to-climate thermal comfort model. To define the climatic zones the study focused on Madagascar as a whole, but the climate analysis tool and created climate analysis visualisations developed for Antananarivo and Toamasina.
2.1. Literature review
A literature review comprising more than 50 publications was conducted to identify elements found in literature relevant to biocli-matic design and climate characterization in Madagascar and hot humid climates. To elaborate the review, Google Scholar, Elsevier
Engineering Village and Web of Science database searches were con-ducted during May 2018. The aim was to collect articles and group them, exploring studies that can be valuable for our study. The litera-ture review presented in Section2identifies and describes a knowledge gap on climate classification and thermal comfort in Madagascar.
2.2. Defining climatic zones
Climate zones were defined by fixed boundaries that were estab-lished by the authors. Thus, we concentrated our effort on gathering new meteorological data in order to establish statistically re-presentative climatic characterization for the whole island. We selected hourly measured data represented into TMY3 for nine local meteor-ological stations available between 1991 and 2008 and located on Fig. 3. The data were provided by the National Meteorological Service of Madagascar (DGMM, 2016) for ambient temperatures, humidity, precipitation, and wind speed in nine real Malagasy cities. Meteonorm (Meteotest, 2017) was used to extrapolate any missing data in the weather file’s data set. Then, we pinpointed the location of those pre-cedent local stations on the SolarGis interactive map, available online (shown inFig. 3(left) for temperature andFig. 3(right) for solar ra-diation) to acquire more data value sources on solar radiation and air temperature (Fick & Hijmans, 2017). We linked the data on the So-larGIS interactive map to data from the World GIS map for global solar radiation and mean monthly temperature provided byFick and Hijmans (2017) for the nine selected cities (Solargis, 2018). In parallel, we combined that information with the topography from The Shuttle Radar Topography Mission SRTM (Farr et al., 2007).
To define the climatic zones boundaries, we decided to consider only three parameters, namely: 1) solar radiation; 2) temperature; and 3) altitude based on the work ofPrieto, Martínez-García, and García, (2009); Bristow and Campbell (1984) and Chandel, Aggarwal, and Pandey, (2005). We selected those key climatic parameters because we were convinced that they are the most influential parameters for thermal comfort in hot climates. The next step was to find a model that represents a causal relation between the three selected parameters. We reviewed the most highly cited studies that aimed to define the causal relationship between air temperature, solar radiation and altitude. We found the methodology proposed by Prieto et al. (2009)as the most
accurate model that matches our climate characterization aims. This model has a similar or better accuracy for determining causal re-lationship than the models used byBristow and Campbell (1984)and Chandel et al. (2005). Those two studies do not interpret exactly other factors that directly influence air temperature such as meteorological phenomenon. Prieto et al. (2009) [26] proposed an equation with proper dimensions with two computed coefficients (a and b) from measurements that should reflect other climatologic parameters, such as precipitation, wind speed or relative humidity.
= a z L G G T T ( )/ b ref 0 0.5 (1) Where
a and b = computed coefficient for meteorological characteristics z = altitude (m)
L = distance to sea (Km) =
Tref temperature of reference is the monthlyaverage minimum tem-perature °C
Finally, by selecting the model ofPrieto et al. (2009), we were able to establish the basis for our new climatic zoning based real data from Madagascar TMY3 weather files. The coefficients a and b mentioned in Equation 1could be determined for each specific location and asso-ciated with a combination of solar radiation and air temperature value. The Jenk optimization method was used on this map to divide it in classes. It aims to minimize the difference inside a class and maximize the difference between them. This method would thus highlight the possible differences in climate. Each class would include one major type of climate (see results in Section4).
In their study,Prieto et al. (2009)identified the parameters on the left side of the equation to calculate the parameters in the right side of the equation above. In our case, we reversed this approach. We already have all the values of the parameters on the right side of the equation. In fact, what we tried to calculate was the value of the left side of the equation. Fortunately, we had the z and L value on the left side of the equation, which makes the a and b factors the only unknown in our case. However, due to the difficulty to calculate the a and b factors separately we combined them together and calculate the combination of a and b factors. This calculation allowed us to resolve the equation through combing both parameters in one combined value.
2.3. Mapping and visualization
The next step after setting the mapping criteria was to map climatic zones of the island. We analysed our data using the software ArcGIS, which can generate customized maps according to the user’s criteria (ESRI, 2017). For the generation of the maps we used the Kriging method of interpolation for which the interpolated values are modelled by a Gaussian process governed by prior covariances. We found the Kriging method gives the best linear unbiased prediction of the inter-mediate values. Then, we used three raster data sets for solar radiation, temperature and altitude. The resolution for solar radiation and tem-perature was 2.5 min (∼4.5 km) and 250 m for the altitude. Each raster data set included the mean value for each of the 12 months of a year so that we could derive an annual mean. Those mean values were then classified. We classified solar radiation into five categories for Mada-gascar.
1 Category 1 (Csr1) includes values below 20.000 kJ/m²/days (about 230 W/m²)
2 Category 2 (Csr2) includes values between 20.001 kJ/m²/days and 21.000 kJ/m²/days
3 Category 3 (Csr3) includes values between 21.001 and 22.000 kJ/ m²/day
4 Category 4 (Csr4) includes values between 22.001 and 23.000 kJ/ m²/day
5 Category 5 (Csr5) includes values above 23.001 kJ/m²/days (about 280 W/m²).
For temperature we created five classes of values each ranging 4 °C, starting at 15 °C and below the annual mean temperature, and ending at 29 °C and above. We decided to determine a 250 m scale for the altitude from 0 to 1500 m and above (see results in Section4). The final map represents the calculated coefficient (a and b) mentioned in Eq.1. The
coefficients are sorted with Jenks optimization method (Jenks, 1967). Once we created our classification classes we used the nine weather files and integrated them into our analyses. Weather data was trans-formed into data sets under the new classification and five key figures were created as a result of our analysis using ArcGIS. The figures map the key study parameters and cross them in order to create the new climate zone map.
2.4. Estimating thermal comfort
To identify and develop bioclimatic design strategies for Madagascar the determination of thermal comfort is fundamental. The bioclimatic design approach for buildings requires that designers should take advantage of the surrounding environment during all times of the year in order to achieve the perfect state of comfort for occu-pants. The simple definition of thermal comfort is stated as: a neutral feeling towards temperature. EN 16,798 (formerly EN 15,251) and ASHRAE 55 standards are some of the most commonly used models worldwide. They rely on several charts to represent thermal comfort zones, depending on different variables. In the case of Madagascar, a limited number of studies investigated the most suitable comfort models that can be applied in new construction (Robelison & Lips, 2008).
2.5. Tool development
The climate analysis tool was developed to provide an initial as-sessment of climate based on the novel climate classification developed in the previous step. The tool should provide early stage design commendations for new building construction based on a re-presentative comfort model for hot humid climates. We identified a comfort zone for people living in a hot humid climate that can be embedded in the tool for the quantitative analysis. We decided to
Fig. 3. (left) Dry Bulb Temperature Map;Fig. 7(right) Solar Radiation Map. Criteria choice
compare different thermal comfort models on an hourly basis to have a better overview of thermal comfort requirement during the year in Madagascar. We comparedGivoni’s Model (1992),ASHRAE’s (2013) model andEN 16798’s (2017)models based on the formulas found in each standard for Antananarivo and Toamasina (seeFigs. 3 and 4).
Firstly, we avoided steady-state comfort models because they ne-glect the effect of humidity adaptation of people living in a hot humid climate. In Madagascar, air humidity hardly falls below 60%, which is around the upper limit of ASHRAE, EN 16,798 and ISO 7701 comfort zones (ASHRAE, 2013;EN 16798 2017,ISO 7730 2005). ASHRAE 55 steady-state standard specifies the upper humidity ratio limit at 0.012 kgwater/kgdry air; however, this limit is set to avoid condensation and
maintain hygienic conditions in Heating, Ventilation and Air Con-ditioning (HVAC) system ducts rather than for human thermal comfort (ASHRAE, 2013).
Secondly, we reviewed the study of Olgyay, who proposed 78% relative humidity and 28 °C with ventilation, and the study by Givoni who proposed 90% relative humidity and 30 °C and up to 93% relative humidity and 32 °C with ventilation (Olgyay, 1963andGivoni, 1969). However, neither study conducted large-scale field surveys to justify those comfort zone limits. Therefore, we determined the boundaries for comfort zones in terms of humidity and temperature for Madagascar’s urban climate, based on ASHARE’s Standard 55 adaptive model and the thermal sensation votes of 3054 people living in hot humid South-East Asia (ASHRAE, 2013;Nguyen, Singh, & Reiter, 2012). Humidity com-fort is established between 40% and 80% of humidity ratio.
Temperature comfort is established between 20 °C and 26 °C without ventilation. The maximum comfort range can increase up to 28 °C with the support of forced ventilation (e.g. ceiling fans). According to the study by Nguyen et al. (2012), the correlation and the regression coefficient between relative humidity and comfort temperature was found to be very low (Tcomf = 0.073 RH + 22.77, R² = 0.056) (Nguyen et al., 2012), revealing a minor effect of relative humidity on thermal perception. Therefore, for the proposed tool the relative hu-midity was established at 80% relative huhu-midity. The tool has a colour index that can facilitate the readability of the graphs. The comfort zone is demarcated with a thick dotted line for more visibility (see results in Section4). We developed the tool based on providing hourly data of outdoor air temperature (dry bulb temperature) and relative humidity by the user. Then, the data were plotted as follows:
1 Temperature (°C) in function of relative humidity (%).
Thirdly, we decided to visualize climatic data in a simple biocli-matic chart developed byDeKay and Brown (2014). DeKay and Brown’s graphical illustration redrew Givoni’s bioclimatic chart using the structure of Olgyay’s chart (1969) in a simple way. They implemented Milne-Givoni’s different and diverse strategy zones in Olgyay’s rectan-gular chart. In this chart, five cooling strategies and two heating stra-tegies are included. In the present study, we redrew the proposed bio-climatic chart of DeKay and Brown more precisely (DeKay & Brown, 2014) to investigate its potential, as shown in the results (Section4.2). We wanted to avoid the complexity of the psychrometric chart and make a simple tool for architects and designers during the early design (Horan & Luther, 2010).
2.6. Usability testing
Similar to the work ofHopfe (2009),Ward, Marsden, Cahill, and Johnson, (2002)andAttia et al. (2012, 2013), our research metho-dology created a randomized, controlled, architects-based usability testing for which architects from Madagascar were recruited.We per-formed a usability testing with 40 architects and urban planners to assess the usability of the tool and its interface (see Section 4.4.2). Usability testing has been carried out in February 2018 while simple paper-based questionnaires were distributed. The system usability scale was used to highlight the weakness and strength of the tool. The us-ability testing was useful to compare our proposed climate analysis chart to the psychrometric chart. We hypothesized that a comparative usability study might elicit more critical responses since the partici-pants had a chance to compare the two visualisations side-by-side during the same session. This enabled the updating of the tool’s inter-face and the psychrometric chart’s representation to be avoided and replaced with simple graphs, such as those shown in Section4.2. 3. Results
In this section, we present the study outcomes regarding the cli-matic zoning, climate analysis tool, comfort model recommendations, and bioclimatic design strategies.
3.1. Climate zoning of Madagascar
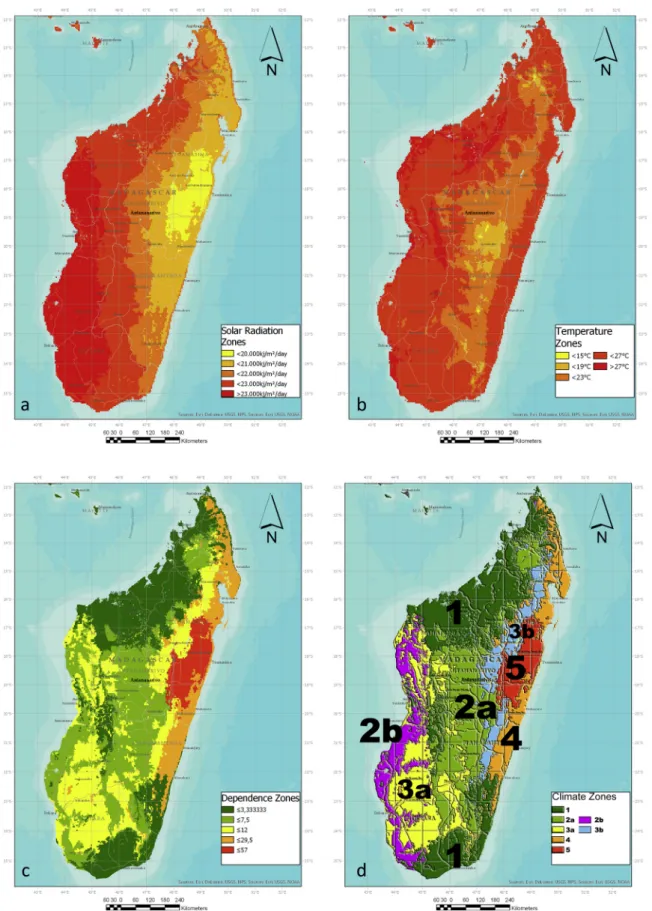
Key figures were created because of our analysis using ArcGIS. The figures map the key study parameters and cross them to achieve a novel climate zone map. The first map represents the altitude as shown in Fig. 4. The altitude has been considered using SRTM data for Mada-gascar’s topography.
Fig. 5a represents the solar radiation map with annual mean values. We see a gradient variation moving from the eastern coast to the western coast. The maximum value is 24,071 kJ/m²/day and the minimum value is 19,412 kJ/m²/day. Fig. 5b represents the annual
mean temperature zones. The highlands have lower temperature mean values than the coastal regions. The western regions present a slightly higher average temperature, especially in the north-west region. Most of the island has an average temperature of between 23 °C and 27 °C. Fig. 5c shows the results of applying Eq.1, which was described earlier
in Section2.2. The map represents the calculated coefficient (a and b) values sorted with Jenks optimization method (Jenks, 1967). We combined them together and calculate the combination of a and b factors. This calculation allowed us to resolve the equation through combing both parameters in one combined value. The advantage of this
approach is that we managed to provide a simple and comprehensive analysis for the climate to create the climatic zones illustrated in Fig. 5c. Without this simplification we could never have managed to come up with our climate analysis. Moreover, we found our approach unique and valid. By simplifying Prieto’s equation, we believe our cli-mate analysis can be reproducible and transferable to future clicli-mate zoning analysis in other regions in hot climates.
That way we ensure that classes are as consistent as possible and reflect true differences of climates. A higher coefficient value (red) means that solar radiations have less influence on temperature. Thus, other weather parameters weigh more in the temperature variation. A lower value means solar radiations have a higher impact on ambient temperature. We can see that the eastern coast distinguishes itself from the rest of the island with higher values. The extreme north and south areas present a high coefficient value between solar radiation and temperature. High plateaus in the central region present relatively high coefficient values but also distinguish themselves from the rest of the island. The south-west regions present a moderate relation. The im-plementation of altitude here permits the considering of the decreasing gradient of temperature in relation to altitude. Finally, the climate map shown inFig. 5d takes the coefficient values as well as air temperature, solar radiation and altitude to determine climate zones. Seven climate zones can be identified.Table 1shows the different characteristics of each climate zone in terms of temperature range and solar radiation average. Antananarivo is in Zone 3b and Toamasina in Zone 4.
3.2. Thermal comfort models
In the following sections we present the results of our comfort re-view to determine the most suitable comfort model for Madagascar and characterize the microclimate in its two largest cities.
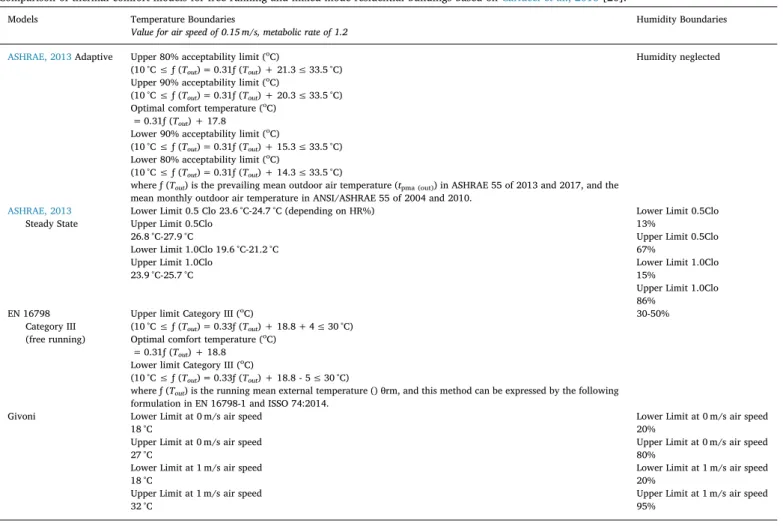
In order to select the fit-to-purpose comfort model in Antananarivo and Toamasina we compared several comfort models (Carlucci, Bai, de Dear, & Yang, 2018). By reviewing different models and their different ranges and thresholds we were able to suggest and recommend existing comfort models to both cities.Table 2includes a comparison of thermal boundaries for several indoor thermal comfort models. Humidity has been given less importance in ASHRAE 55 2013 (adaptive model) and EN 16,798 because they claim that the influence on thermal comfort is negligible. However, a very high value or a very low value of humidity can impact the comfort of building users causing, for example, wall condensation or skin dehydration.
To address this complexity, we decided to represent the climate of Antananarivo and Toamasina using different comfort models. The models’ representation can be found in the following sections. The
comfort models are represented using several psychrometric charts for the ASHRAE 55 2013 (steady-state model), EN 16,798 and Givoni’s models. For the adaptive comfort model we used a different type of chart.
3.3. Thermal comfort in Antananarivo
Antananarivo is the capital and largest city of Madagascar. The city's population is 1400,000 (UN 2014). Its geographical location is on the south and east hemisphere (Lat: 18.8792 °S, Long: 47.5079 °E). Antananarivo receives practically all of its average annual 1400 mm (55.1 in. of rainfall between November and April. The dry season is sunny, although somewhat chilly, especially in the mornings. Although frosts are rare in Antananarivo, they are common at higher elevations. This climate is considered to be Cwb (temperate with dry winter and warm summer) according to the Köppen − Geiger climate classification (Peel et al., 2007). In Antananarivo, the average annual temperature and humidity are 18.4.0 °C and 78%, respectively. The city is located in the central highlands at an average altitude of 1400 m. Antananarivo has a humid subtropical mild summer climate that is mild with dry winters, mild rainy summers and moderate seasonality. Throughout the year 1400 mm of rain falls in Antananarivo. In the warm season, An-tananarivo is affected by tropical cyclones, from November to mid-May, although they are more likely from late December to mid-April ( Rakoto-Joseph et al., 2009).
In a preparatory stage, data of 8760 days belonging to the statistical period from 1991 to 2008, from fourteen meteorological stations, were used to estimate the indoor thermal comfort for Antananarivo. The daily numerical value (output) for each one of the four thermal comfort indices was calculated based onTable 2. InFig. 6, the first observation we can make is that the climate of Antananarivo is relatively cold and has a very high humidity ratio (78% mean). The steady-state model of ASHRAE, represented inFig. 6a, has 19% predicted comfort, whereas, its adaptive option inFig. 6b, has 26% predicted comfort. The European EN 16,798 standard shown inFig. 6c, has the least suitable temperature boundaries for Antananarivo with 7%.Givoni’s Model (1992)shown in Fig. 6d has a predicted comfort of 31% with 1 m/s air speed Due to the 95% upper limit of humidity for Givoni’s, we finally selected the ASHRAE adaptive comfort model. We consider ASHRAE’s adaptive comfort the best available fit-to-context model that sets no limit for humidity, which is essential in Antananarivo and the coastal cities of Madagascar.
3.4. Thermal comfort in Toamasina
Toamasina is on the eastern Madagascar coast and the city's popu-lation is 206,373 (UN 2017). The geographical location of Toamasina is on the south and east hemisphere (Lat: 18.1443 °S, Long: 49.3958 °E). Toamasina has a tropical climate with significant precipitation even during the driest month. This climate is Af (Tropical Rainforest) ac-cording to the Köppen − Geiger climate classification (Peel et al., 2007). In Toamasina, the average annual temperature and humidity are 24.0 °C and 82%, respectively. The east coast has an equatorial climate; being most directly exposed to the trade winds it has the highest rainfall, averaging as high as 4000 mm annually. This city is notorious for a hot, humid climate in which tropical destructive cyclones occur during the rainy season, coming in principally from the direction of the Mascarene Islands (Rakoto-Joseph et al., 2009).
In a preparatory stage, data of 8760 days belonging to the statistical period from 1991 to 2008, from fourteen meteorological stations, were used to estimate the indoor thermal comfort for Toamasina. The daily numerical value (output) for each one of the four thermal comfort in-dices was calculated. From the psychrometric chart presented inFig. 7, we can see that Toamasina has a high temperature and high humidity. The two steady-state models are less suitable with less than 2% sa-tisfaction for ASHRAE 55 (Fig. 7a) and 32% for EN 16,798 (Fig. 7c). On
Table 1
Climate characteristics.
Zones Characteristics Locations
1 Low altitude > 23 °C average 22-23,000 kJ/
m²/day North and South plains
2a
2b High altitude < 15 - 23 °C average 21-22000 kJ/m²/day Low altitude 23 - 27 °C average > 23,000 kJ/m²/day Central Highlands South-West Coast 3a Medium altitude < 27 °C average > 23.000 kJ South-West 3b Medium altitude < 23 °C average
< 21,000 kJ/m²/day East Highlands 4 Low altitude
23 - 27 °C average < 21,000 kJ/m²/day
East Coast 5 Low to medium altitude
> 23-27 °C average < 20,000 kJ/m²/day
East Coast till Highlands
the other hand, the adaptive ASHRAE 55 model inFig. 7b shows that more than 50% of plotted hours fall within the comfort range. Givoni’s Model inFig. 7d might prove a better choice with an air speed of 1 m/s leading to 65% of thermal comfort satisfaction (10% at 0 m/s) (1992). However, we selected the adaptive ASHRAE 55 model because it tol-erates a rate of relative humidity up to 100%.
3.5. Climate analysis tool
The climate analysis tool is an open access tool programmed in Visual Basic (VB). The tool is available online by following this re-ference link (Attia & Lacombe, 2018). The aim of this simplification was to avoid the use of psychrometric charts, which are difficult to under-stand for many architects, according to the literature (Horan & Luther, 2010; Roshan, Farrokhzad, & Attia, 2017). This representation was inspired by the work ofDeKay and Brown (2014), as shown inFig. 8. Table 3shows the results presented inFig. 8, in a tabular format. The table enables the quantification of the potential of the corresponding passive design strategies in association with the used weather files of both cities.
We also added to the tool a comfort model comparison feature that enables visualization of the differences of applying different comfort models to the same weather file. Fig. 9 illustrates the outdoor air temperature value for a TMY for the two case studies. Antananarivo’ is heating-dominated during winter (between May and September). There is a discrepancy between the running mean temperature in the winter and the acceptable comfort conditions indoors. In light green, there are days when the outdoor reference temperature is out of the prescribed temperature domain specified by ASHRAE 55′s adaptive comfort lower
limit. We can observe that Antananarivo does not have a cooling period but some hours during summer that are above the thermal comfort zone limits. This matches the case of Antananarivo, which is located at an altitude of 1300 m above sea level. In the case of Antananarivo, we recommend using the ASHRAE 55 adaptive comfort model because it establishes a range of humidity levels that are considered comfortable by 80% or more. On the other hand, EN 16,798 standard sets an upper limit of 50% humidity, which is not feasible for free-running or mixed buildings in Madagascar, where people are more adapted to higher humidity values.
On the other hand, for Toamasina we can confirm that average temperatures are much higher than Antananarivo during the summer. The temperatures in winter are warm enough to avoid active heating and rely on passive design strategies. During the summer period the high temperature can cause discomfort in the absence of proper ven-tilation. Based on the focus group discussion with local experts from Toamasina, they considered that the overheating risk is high, and the residential buildings tend to be cooling-dominated. Therefore, we re-commend the use of the ASHRAE adaptive comfort model, which, si-milarly to Antananarivo, can tolerate higher humidity limits.
3.6. Climate tool validation
The final step of the research was to validate the tool’s output results and elaborate on the recommendations’ description based on practical experience of local stakeholders. After analysing the weather files of Antananarivo and Toamasina using the Climate Tool, stakeholders were asked to validate the suggested strategies.
Table 2
Comparison of thermal comfort models for free running and mixed-mode residential buildings based onCarlucci et al., 2018[20]. Models Temperature Boundaries
Value for air speed of 0.15 m/s, metabolic rate of 1.2 Humidity Boundaries
ASHRAE, 2013Adaptive Upper 80% acceptability limit (oC)
(10 °C ≤ ƒ (Tout) = 0.31ƒ (Tout) + 21.3 ≤ 33.5 °C)
Upper 90% acceptability limit (oC)
(10 °C ≤ ƒ (Tout) = 0.31ƒ (Tout) + 20.3 ≤ 33.5 °C)
Optimal comfort temperature (oC) = 0.31ƒ (Tout) + 17.8
Lower 90% acceptability limit (oC)
(10 °C ≤ ƒ (Tout) = 0.31ƒ (Tout) + 15.3 ≤ 33.5 °C)
Lower 80% acceptability limit (oC)
(10 °C ≤ ƒ (Tout) = 0.31ƒ (Tout) + 14.3 ≤ 33.5 °C)
where ƒ (Tout) is the prevailing mean outdoor air temperature (tpma (out)) in ASHRAE 55 of 2013 and 2017, and the mean monthly outdoor air temperature in ANSI/ASHRAE 55 of 2004 and 2010.
Humidity neglected
ASHRAE, 2013
Steady State Lower Limit 0.5 Clo 23.6 °C-24.7 °C (depending on HR%)Upper Limit 0.5Clo 26.8 °C-27.9 °C
Lower Limit 1.0Clo 19.6 °C-21.2 °C Upper Limit 1.0Clo
23.9 °C-25.7 °C
Lower Limit 0.5Clo 13%
Upper Limit 0.5Clo 67%
Lower Limit 1.0Clo 15%
Upper Limit 1.0Clo 86%
EN 16798 Category III (free running)
Upper limit Category III (oC)
(10 °C ≤ ƒ (Tout) = 0.33ƒ (Tout) + 18.8 + 4 ≤ 30 °C)
Optimal comfort temperature (oC) = 0.31ƒ (Tout) + 18.8
Lower limit Category III (oC)
(10 °C ≤ ƒ (Tout) = 0.33ƒ (Tout) + 18.8 - 5 ≤ 30 °C)
where ƒ (Tout) is the running mean external temperature () θrm, and this method can be expressed by the following
formulation in EN 16798-1 and ISSO 74:2014.
30-50%
Givoni Lower Limit at 0 m/s air speed 18 °C
Upper Limit at 0 m/s air speed 27 °C
Lower Limit at 1 m/s air speed 18 °C
Upper Limit at 1 m/s air speed 32 °C
Lower Limit at 0 m/s air speed 20%
Upper Limit at 0 m/s air speed 80%
Lower Limit at 1 m/s air speed 20%
Upper Limit at 1 m/s air speed 95%
Fig. 6. a: Thermal comfort during a year with AHSRAE Static 2013 model for Antananarivo; b: Thermal comfort during a year with AHSRAE Adaptive 2013 model for
Fig. 7. a: Thermal comfort during a year with AHSRAE Static 2013 model for Toamasina; b: Thermal comfort during a year with AHSRAE Adaptive 2013 model for
3.7. Focus group discussions
The focus group discussions allowed the tool’s sensitivity to be evaluated with reference to the local context of both cities. Experts agreed with the analysis provided by the tool at the first stage of dis-cussion. The tool can quantify the effect of passive heating and cooling
strategies as shown inFig. 8a. The tool indicates that 43% of the annual hours (8760) fall within the acceptable humidity limits (40%–80%), and more than 55% of the annual hours require dehumidification. As shown inFig. 8b, Antananarivo has 22% of its hours in the temperature comfort zone, the majority of the year it would need passive heating (18.5) coupled with high internal heat gains (35.5). As shown inFig. 8c,
Fig. 8. a: The figure highlights the humidity thresholds so that architects can focus only reading the humidity values (Antananarivo); b: The figure highlights the
temperature thresholds so that architects can focus only reading the temperature values (Antananarivo); c: The figure highlights the humidity thresholds so that architects can focus only reading the humidity values (Toamasina); d: The figure highlights the temperature thresholds so that architects can focus only reading the temperature.
Table 3
Potential passive cooling and heating strategies for both cities based onFig. 8.
Strategies Bioclimatic Chart Cooling and Heating Strategies Antananarivo Toamasina
S1 Conventional Heating 0% 0%
S2 Conventional Heating + Humidification 0% 0%
S3 Passive Solar Heating + Humidification 0% 0%
S4 Internal Gains + Humidification 0% 0%
S5 Humidification 0% 0%
S6 Passive Solar Heating 18.5% 0%
S7 Internal Gains 35.5% 14%
S8 Comfort 22% 45%
S9 Natural Ventilation 12% 15%
S10 Dehumidification 55% 81%
S11 Natural Ventilation + High Thermal Mass + Night Ventilation + Direct & Indirect Evaporative Cooling 0% 0%
S12 Direct & Indirect Evaporative Cooling + Thermal Mass + Night Ventilation 0% 0%
S13 Direct & Indirect Evaporative Cooling 0% 0%
Toamasina presents an extreme level of average humidity with more than 81% of the year that is above 80% of relative humidity. As shown inFig. 8d, the temperature average of Toamasina is 24 °C but the ma-jority of the year it still falls in the comfort zone; 45% of the hours are within the tool’s thermal comfort boundaries.
At the second stage of discussion experts developed more specific recommendations, shown in Table 3, that aim at improving thermal comfort and indoor air quality in buildings in both investigated cities. The experts reached consensus on the recommendations presented in Table 3.
3.8. Usability testing
To test the user interface and the tool’s friendliness, usability testing took place in February 2018 with 40 users comprising architects and urban planners. The usability testing included two test types.
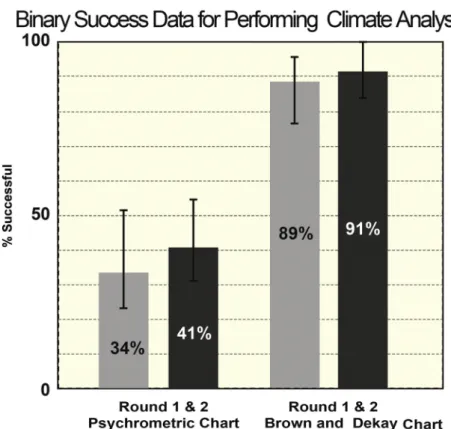
The first was a usability testing that measured a task’s success. The aim was to measure how effectively users are able to understand the climate characteristics of two cities (round 1: Ho Chi Minh City and round 2: Ha Noi) in Vietnam and identify the top 3 relevant climate
responsive strategies using Dekay and Brown’s chart versus the psy-chrometric chart. We explicitly selected two cities in Vietnam to make sure participants would not rely on their personal experience with Malagasy cities. We identified the top 3 relevant climate responsive strategies for both cities based on the work of Nguyen and Reiter (2014). The level of success was compared as shown inFig. 10. The figure shows that the use of Dekay and Brown’s chart had a higher success rate compared to using the psychrometric chart. The successful rate of climate analysis was increased by at least 50% by the 40 ar-chitects and urban planners. During the second round of performing climate analysis the successful rate was greater (55%) with 91% of participants succeeding to identify the climate responsive strategies of Ha Noi.
The second test was a satisfaction simple paper-based usability questionnaire. System Usability Scale (SUS), as defined by the standard, was used to enhance and validate the tool (ISO, 9241 andAttia & Andersen, 2013). To guarantee the internal validity of the test a set of eight ordinary (pre-defined) SUS questions were used. The analysis of the responses was based on the reporting framework (ISO, 9241). A paperbased survey was conducted using Likert scale. Users have
expressed their agreement with the questionnaire questions on a scale ranging from 1 to 5. (1=’strongly disagree’ - 5=strongly agree’). Scores were added and the total was multiplied by 2.5. A mean score was computed out of the chosen responses with a range between 0 and 100. The highest the score the more usable the website is. Any value around 60 and above is considered as good usability. As shown in Fig. 11, Brown and Dekay’s chart scored a very good usability for the eight questions, however, the psychrometric chart use was not satisfactory. Participants were interviewed after conducting the usability testing to follow up and get a valuable understanding of the psychrometric chart’s
limitations.
Overall, the reactions were particularly positive regarding the tool’s simplicity and effectiveness. Participants clearly preferred DeKay and Brown’s figure (Fig. 8) for climate data representation (DeKay & Brown, 2014). These clear visualisation preferences are interesting and in line with previous findings found in literature (Roshan et al., 2017). Within a few minutes of being introduced to our tool, participants got excited about the tool as it could clearly foresee how the visualisation would facilitate their understanding of climate conditions and required design strategies that can be effective in selected climate. Some participants
Fig. 10. Binary success data for performing climate analysis.
asked about the availability of the tool as they wanted to use it in their practice. From the analysis it emerged that there is great potential for the interface. From the open questions and post-testing interviews, users appreciated the comfort model’s comparison graph. Respondents were also particularly enthusiastic about the quantification of the effect of passive heating and cooling strategies, shown inTable 3. However, the post-usability testing interviews revealed other limitations. For example, many users indicated their need to translate the suggested passive strategies into market-available building solutions and products rather theoretical climate-responsive guidelines.
4. Discussion and conclusion
Madagascar is a developing country with rapidly increasing popu-lation. New constructions are growing at an even faster rate. Providing new housing projects that include the notion of bioclimatic design is important to improve the thermal comfort of the future occupant. Based on climatic analysis, the purpose of this study was to inform future designers on thermal comfort and various bioclimatic design measures for two cities in Madagascar. This paper proposes a climatic zoning of Madagascar Island based on yearly solar radiation and temperature average. We realized the map with the software ArcGIS as well as WorldClim data for the best resolution. We used TMY3 data from the National Meteorological Service and Weather stations and developed a new climate analysis tool based on a simple chart that allows weather files to be analysed and provided various bioclimatic design re-commendations.
4.1. Summary of main findings
The main findings of this paper are seven distinct climate zones on the island: the highly insolated and high-temperature zones in the north and the south; the central highlands with the lowest temperature average and moderate insolation; the southern and eastern highlands with average temperatures and medium solar radiation; the eastern coastal region with high temperatures and low solar radiation average; and finally, a singular zone going from the east coast to the central highlands with a very low radiation value and high temperatures.
Our climatic zoning allowed us to place Antananarivo in Zone 3b and Toamasina in Zone 4. This enables a quick determination of a passive solar design and the evaluation of their (passive design mea-sures) potential application for building designs in these major cities of Madagascar. Additionally, we developed a climate analysis application based on Visual Basics Language which can be used to compare the ASHRAE-55 state and adaptive models, the EN-16,798 steady-state model, and the Givoni model in the form of annual temperature profiles (seeFig. 9). The tool also represents temperature in terms of relative humidity with boundaries, where comfort boundaries have been defined for a hot humid climate. In the case of our tool, the temperature ranges from 20 °C to 26 °C and relative humidity from 40% to 80%.
Our climate analysis tool was found to promote and inform deci-sion-making for bioclimatic design in Antananarivo and Toamasina during the predesign stage. Participants who used the Climate Analysis Tool succeeded to perform and climate analysis and identify key passive design measures with the help of Dekay and Brown’s chart. The 40 architects and urban planners were significantly satisfied (91%) with the use of our tool and appreciated it’s easy to understand climate data visualisation. Our tool increases the knowledge about the climate spe-cific characteristics of cities in hot-humid climates. Architects and urban planners who used the tool reported a better understanding of the climate and appreciated the guided approach for sustainable building design. We consider this tool as a starting point for the development of a widely usable comfort model and design recommendations in Madagascar.
4.2. Strength and limitations of the study
This study proposes a more precise climatic zoning compared to the previous one found in the literature. The new climatic zoning presented inFig. 5d has much more sub-zoning than the Köppen-Geiger classifi-cation. Therefore, it remains specific and more articulate with a high-resolution classification. For this study, we proposed an efficient way of evaluating climate zones based on a triple parametric analysis. This method can be used globally to assess the use of solar passive design for buildings in hot climates. We even included Toamasina in our study, to extend the body of literature beyond Antananarivo. We used a 250 m resolution for altitude, while combining radiation and temperature variations. We reached a classification of seven climatic zones, which is a good compromise between the two previous studies presented (Rakoto-Joseph et al., 2009; Peel et al., 2007) in Section 2.2. The suggested seven categories were validated and found useful by archi-tects, allowing different architectural and construction strategies and techniques that are used in the different regions of the island to be identified. The horizontal resolution of 4.5 km is more precise than previous studies but is not accurate for determining climate conditions inside urban settlements on a building scale. It is important to note that the value measure inside new construction can be different due to urban-microclimate-related factors, such as air pollution, urban fabric, and the urban heat island effect.
Moreover, we used recent TMY files and a simple chart to create a user-friendly tool for climatic analysis and provide generic bioclimatic design recommendations. The tool represents and visualizes climate data, enabling users to understand the comfort requirements for the largest two cities of Madagascar. We designed the tools with architects in mind and the FGD confirmed that the tool is easy to use and allows understanding the climate in both cities as illustrated inFig. 9. Com-pared to the psychrometric chart our tool, which is based on the graphs ofDeKay and Brown (2014)allows users to straight read the graphs and understand the climatic conditions. Without any background in en-gineering, physics, or meteorology, architects succeeded to understand the nature if the weather and identify the most fit-to-climate bioclimatic design strategies that need to be applied for the design in both cities.
Despite the work of Nematchoua, Ricciardi, Reiter, Asadi, and Demers (2017)andNematchoua, Ricciardi, and Buratti (2017)[53-54], which focuses mainly on comfort perception in educational buildings in Madagascar, we are not aware of any study that has addressed thermal comfort for residential buildings during the early design stages. Also, participants generally found the climate analysis visualisation in-formative. Compared to the psychrometric chart participants showed a strong preference for our tool and the results revealed the importance of showing climate data to architects in the way they can understand. Therefore, we confirm that the tool can be used in other countries, and in hot climate regions.
On the other hand, there are some important limitations that require discussing. The temperature and solar radiation for the climatic zoning (Fig. 5) have been extrapolated in some places due to lack of data; we need to be careful about the liability of the extrapolation method used in our study. The data used for mapping is based on yearly averages, thus the solar-radiation value and temperature range may vary ac-cording to the month and the season. Only two variables and one constant were selected for the mapping (solar radiation, temperature and altitude), while several additional parameters could have influ-enced the climate classification and made it more accurate. Also, the nine analysed weather files are not well distributed at Madagascar’s level. In our case, we exhausted all available resources combining re-cent data sets from weather station and satellite maps.
Our climate analysis tool does not compensate building perfor-mance simulation. Our tool can be used in a prior step to design and during predesign stages to characterize the outdoor local climate. Designers should be aware that the climate scatter plots inFig. 8do not consider the influence of building envelope and internal gains. They are
meant to inform the designer but not to validate the building perfor-mance. Also, the thermal comfort limits are not based directly on the thermal comfort sensation of inhabitants of Madagascar but inhabitants of similar geographical locations, thus they could vary in Madagascar. Therefore, future studies should investigate thermal comfort on a na-tional basis in Madagascar.
4.3. Comparison between the psychrometric chart and Brown and Dekay’s chart
This is the first time, that a systematic and structured study com-pares the use of Givoni’s psychrometric chart with another chart for climate data visualisation. We are aware that usability testing can be a debatable issue, as users might be biased. However, we showed that architects and urban planners with basic knowledge on climatology and building physics have an increased understanding of climate data. The success rate of analysing weather files and identifying the most im-portant climate-responsive design strategies in two unknown cities (to users) achieved 91% in the tested participants sample in comparison with only 41% for those who used the psychrometric chart.
4.4. Implication for practice and future research
Our suggested tool is a starting point to provide guidance for design decisions to deliver comfortable and energy-efficient buildings in Madagascar. The tool helps designers understand Madagascar’s (urban) climate and provides guidance for the improved thermal comfort of occupants in sustainable housing. The next step is to benefit from this understanding and valorise vernacular and local solutions and re-sources that can be adapted by the construction sector through building performance simulation. Future research should capitalize on building performance simulation and building performance monitoring to better understand occupants’ needs and set formal building standards. Madagascar faces several challenges and its urban population require an improved quality of life, while increasing its population’s pro-ductivity in the built environment. Add to that the highly possible impacts of climate change and the increasing reliance on mechanical systems for heating, cooling and ventilation. We advise further in-vestigation into the most fit and proper thermal comfort models that could be suited to Toamasina and Antananarivo. We also recommend further studies defining thermal comfort boundaries for heating and cooling demand estimation in Madagascar’s urban settlements (Roshan et al., 2017). For Madagascar, there is a need to establish a legal fra-mework to regulate the comfort of occupants in free-running-mode housing. Also, there is a need to develop a national building efficiency standard. The next practical step for this research is the engagement with code officials to adopt and implement our findings and re-commendations in new Malagasy regulations and to study thermal comfort.
Based on our experience during the focus group discussions, we wish to expand the pool of architects and urban planners to confirm participant’s statements on the beneficial use of the tool. One can imagine other visualisations, specifically designed architects needs for climate data analysis and visualisation. More work is necessary to show generalizability of our climate analysis visualisation chart for archi-tects, urban planners and professionals in other building design do-mains.
Acknowledgement
This research was partially funded by the EU Erasmus+ Grant for MADEEHI project. We would like to acknowledge the Sustainable Building Design Lab for the use of data sets in this research and the valuable support during the analysis of data. The authors would like to gratefully acknowledge MADEEHI project for providing excellent re-search networking. The authors would like to acknowledge the support
of Institute of Technology (IST) in Antananario. We would like to thank all participants of the IST who helped to assess the tool through us-ability testing and focus group discussions.
References
ASHRAE (2013). ANSI/ ASHRAE standard 55-2013 thermal environmental conditions for human occupancy. American Society of Heating, Refrigerating and Air-Conditioning Engineers, Inc.
Attia, S., & Duchhart, I. (2011). Bioclimatic landscape design in extremely hot and arid climates. Proceedings of 27th Conference of Passive and Low Energy Architecture (PLEA) 2011..
Attia, S., Gratia, E., De Herde, A., & Hensen, J. L. (2012). Simulation-based decision support tool for early stages of zero-energy building design. Energy and Buildings, 49, 2–15.
Attia, S., Gratia, E., & De Herde, A. (2013). Achieving informed decision-making for net zero energy buildings design using building performance simulation tools. International journal of building simulation, Vol 6-1, Tsinghua-Springer Press3–21.
Attia, S., & Andersen, M. (2013). Measuring the usability and effectiveness of CAAD tools and applications. Proceeding of the Education and Research in Computer Aided Architectural Design in Europe Conference.
Attia, S., & Lacombe, T. (2018). Climate tool V1.0.0.xSlx. Available at:https://orbi.uliege. be/handle/2268/227384.
Autodesk (2018). Ecotect weather tool, version 8.
Bhattacharya, Y., & Milne, M. (2009). Psychrometric chart tutorial: A tool for under-standing human thermal comfort conditions. 38th American Solar Energy Society Conference, 11–16.
Biasca, K. L. (2005). Development of an interactive psychrometric chart tutorial. Age, 10, 1.
Bristow, K. L., & Campbell, G. S. (1984). On the relationship between incoming solar radiation and daily maximum and minimum temperature. Agricultural and Forest Meteorology, 31(2), 159–166.
Carlucci, S., Bai, L., de Dear, R., & Yang, L. (2018). Review of adaptive thermal comfort models in built environmental regulatory documents. Building and Environment.
Chandel, S. S., Aggarwal, R. K., & Pandey, A. N. (2005). New correlation to estimate global solar radiation on horizontal surfaces using sunshine hour and temperature data for indian sites. Journal of Solar Energy Engineering, 127(3), 417.
Cicelsky, A., & Meir, I. A. (2014). Parametric analysis of environmentally responsive strategies for building envelopes specific for hot hyperarid regions. Sustainable Cities and Society, 13, 279–302.
DGMM (2016). Direction générale de la Météorologique De Madagascar.
DeKay, M., & Brown, G. Z. (2014). Sun, wind, and light: Architectural design strategies. John Wiley & Sons.
EN 16798 (2017). Indoor environm ental input parameters for design and assessm ent of energy performance of buildings addressing indoor air quality, thermal environm ent, lighting and acoustics. EU for Standardization.
Environmental Systems Research Institute (ESRI) (2017). ArcGIS desktop 10.5.1.
Jenks, G. F. (1967). The data model concept in statistical mapping. International yearbook of cartography, 7, 186–190.
Farr, T. G., et al. (2007). The shuttle radar topography mission. Reviews of Geophysics (Washington, DC : 1985), 45, RG2004.
Fick, S. E., & Hijmans, R. J. (2017). WorldClim 2: New 1-km spatial resolution climate surfaces for global land areas. International Journal of Climatology.
Gaspari, J., Fabbri, K., & Lucchi, M. (2018). The use of Outdoor Microclimate analysis to support decision making process: Case study of Bufalini square in Cesena. Sustainable Cities and Society.
Givoni, B. (1992). Comfort, climate analysis and building design guidelines. Energy and Buildings, 18(1), 11–23.
Givoni, B. (1969). Man climate and architecture. Oxford: Elsevier.
Hopfe, C. J. (2009). Uncertainty and sensitivity analysis in building performance simulation for decision support and design optimization. PhD diss.Eindhoven University.
Horan, P., & Luther, M. B. (2010). Using the psychrometric chart in building measure-ments. ANZAScA 2010: On the Border: Architectural Science in Theory & Practice: Proceedings of the 44th Conference of the Architectural Science Association, 1–8.
ISO 7730 (2005). 7730: 2005. Ergonomics of the thermal environment-Analytical determi-nation and interpretation of thermal comfort using calculation of the PMV and PPD indices and local thermal comfort criteria. Switzerland: International Organization for Standardization.
ISO 9241-11:1998 (1998). Ergonomic requirements for office work with visual display terminals (VDTs) – Part 11: Guidance on usability. International Organization for Standardization.
Kim, H., Gu, D., & Kim, H. Y. (2018). Effects of urban heat island mitigation in various climate zones in the United States. Sustainable Cities and Society.
Khambadkone, N. K., & Jain, R. (2017). A bioclimatic analysis tool for investigation of the potential of passive cooling and heating strategies in a composite Indian climate. Building and Environment, 123(Supplement C), 469–493.
Lau, C. C., Lam, J. C., & Yang, L. (2007). Climate classification and passive solar design implications in China. Energy Conversion and Management, 48(7), 2006–2015.
Mahmoud, A. H. A. (2011). An analysis of bioclimatic zones and implications for design of outdoor built environments in Egypt. Building and Environment, 46(3), 605–620.
Meteotest (2017). Meteonorm v7.2.
Milne, M. (2016). Climate consultant v6. 0.
Milne, M., Liggett, R., & Al-Shaali, R. (2007). Climate consultant 3.0: A tool for visualizing building energy implications of climates. Proceedings of the Solar Conference, Vol. 1,
466.
Nematchoua, M. K., Ricciardi, P., Reiter, S., Asadi, S., & Demers, C. M. (2017). Thermal comfort and comparison of some parameters coming from hospitals and shopping centers under natural ventilation: The case of Madagascar Island. Journal of Building Engineering, 13, 196–206.
Nematchoua, M. K., Ricciardi, P., & Buratti, C. (2017). Adaptive approach of thermal comfort and correlation between experimental data and mathematical model in some schools and traditional buildings of Madagascar under natural ventilation. Sustainable Cities and Society.
Nguyen, A. T., Singh, M. K., & Reiter, S. (2012). An adaptive thermal comfort model for hot humid South East Asia. Building and Environment, 56, 291–300.
Nguyen, A. T., & Reiter, S. (2014). A climate analysis tool for passive heating and cooling strategies in hot humid climate based on Typical Meteorological Year data sets. Energy and Buildings, 68, 756–763.
Nicol, F. (2004). Adaptive thermal comfort standards in the hot–humid tropics. Energy and Buildings, 36(7), 628–637.
Olgyay, V. (1963). Design with climate. New Jersey: Princeton University Press.
Peel, M. C., Finlayson, B. L., & McMahon, T. A. (2007). Updated world map of the Köppen-Geiger climate classification. Hydrology and Earth System Sciences Discussions, 4(2), 439–473.
Prieto, J. I., Martínez-García, J. C., & García, D. (2009). Correlation between global solar irradiation and air temperature in Asturias, Spain. Solar Energy, 83(7), 1076–1085.
Rakoto-Joseph, O., Garde, F., David, M., Adelard, L., & Randriamanantany, Z. A. (2009). Development of climatic zones and passive solar design in Madagascar. Energy Conversion and Management, 50(4), 1004–1010.
Robelison, S., & Lips, B. (2008). Influence thermique de l’emplacement du toit en chaume sous le toit en tôle d’un habitat à Antananarivo-Madagascar. Afrique Science Revue Internationale Des Sciences et Technologie, 4(3).
Roshan, G. R., Farrokhzad, M., & Attia, S. (2017). Defining thermal comfort boundaries
for heating and cooling demand estimation in Iran’s urban settlements. Building and Environment, 121, 168–189.
Santamouris, M., Papanikolaou, N., Livada, I., Koronakis, I., Georgakis, C., Argiriou, A., et al. (2001). On the impact of urban climate on the energy consumption of buildings. Solar Energy, 70(3), 201–216.
Singh, M. K., Mahapatra, S., & Atreya, S. K. (2007). Development of bio-climatic zones in north-east India. Energy and Buildings, 39(12), 1250–1257.
Solargis (2018). Solargis IMAPS, interactive solar potential maps. Available from: . Accessed: 28.10.2018https://solargis.com/products/imaps/overview/.
Stavrakakis, G. M., Tzanaki, E., Genetzaki, V. I., Anagnostakis, G., Galetakis, G., & Grigorakis, E. (2012). A computational methodology for effective bioclimatic-design applications in the urban environment. Sustainable Cities and Society, 4, 41–57.
Tejero-González, A., Andrés-Chicote, M., García-Ibáñez, P., Velasco-Gómez, E., & Rey-Martínez, F. J. (2016). Assessing the applicability of passive cooling and heating techniques through climate factors: An overview. Renewable and Sustainable Energy Reviews, 65, 727–742.
Toe, D. H. C., & Kubota, T. (2013). Development of an adaptive thermal comfort equation for naturally ventilated buildings in hot–humid climates using ASHRAE RP-884 da-tabase. Frontiers of Architectural Research, 2(3), 278–291.
United Nations, Department of Economic and Social Affairs, Population Division (2017). World Population Prospects: The 2017 Revision, Key Findings and Advance Tables ESA/P/ WP/248. Available athttps://esa.un.org/unpd/wpp/Publications/Files/WPP2017_ KeyFindings.pdf.
Ward, R. D., Marsden, P. H., Cahill, B., & Johnson, C. (2002). Physiological responses to Well-designed and poorly designed interfaces. In Proceedings of CHI 2002 Workshop on Physiological Computing. Minneapolis.
Zhang, H., Wang, H., & Zhou, X. (2017). Applicability research on passive design of re-sidential buildings in hot summer and cold winter zone in China. IOP Conference Series: Earth and Environmental Science.