HAL Id: hal-00806426
https://hal.archives-ouvertes.fr/hal-00806426
Submitted on 31 Mar 2013HAL is a multi-disciplinary open access archive for the deposit and dissemination of sci-entific research documents, whether they are pub-lished or not. The documents may come from teaching and research institutions in France or abroad, or from public or private research centers.
L’archive ouverte pluridisciplinaire HAL, est destinée au dépôt et à la diffusion de documents scientifiques de niveau recherche, publiés ou non, émanant des établissements d’enseignement et de recherche français ou étrangers, des laboratoires publics ou privés.
Influence of global warming on durability of corroding
RC structures: A probabilistic approach
Emilio Bastidas-Arteaga, Franck Schoefs, Mark G. Stewart, Xiaoming Wang
To cite this version:
Emilio Bastidas-Arteaga, Franck Schoefs, Mark G. Stewart, Xiaoming Wang. Influence of global warming on durability of corroding RC structures: A probabilistic approach. Engineering Structures, Elsevier, 2013, 51, pp.259-266. �10.1016/j.engstruct.2013.01.006�. �hal-00806426�
Influence of global warming on durability of corroding RC structures:
a probabilistic approach
Emilio Bastidas-Arteaga1*, Franck Schoefs1, Mark G. Stewart2 and Xiaoming Wang3
1
LUNAM Université, Université de Nantes-Ecole Centrale Nantes, GeM, Institute for Research in Civil and Mechanical Engineering/Sea and Littoral Research Institute, CNRS UMR 6183/FR 3473, Nantes, France
2
Centre for Infrastructure Performance and Reliability, The University of Newcastle, NSW, Australia
3
CSIRO Climate Adaptation Flagship and CSIRO Ecosystem Sciences, Highett, Vic, Australia
Abstract:
Chloride ingress and carbonation cause corrosion of reinforced concrete (RC) structures affecting its operational life. Experimental evidence indicates that these deterioration processes are highly influenced by CO2 emissions and climatic conditions in the surrounding environment
–i.e. temperature, humidity, etc. Since studies on global warming announce changes in climate, the impact of changing climate on RC durability should also be considered. This paper links RC deterioration mechanisms to CO2 emissions and global warming. Based on various studies on
climate change, models for estimating the effect of CO2 emissions and temperature/humidity
changes due to global warming are described. Furthermore, various scenarios of global warming that can be used to assess the effect of climate change in structural reliability are proposed. The proposed approach is then illustrated with a numerical example that calculates the probability of failure of a RC bridge beam for future climate scenarios. The paper then outlines some adaptation strategies, particularly focusing on the needs for risk-based selection of optimal adaptation measures.
Keywords: corrosion; reinforced concrete; chloride ingress; carbonation; global warming; reliability.
1. Introduction
Reinforced concrete (RC) structures are subjected to environmental actions affecting their performance, serviceability and safety. Among these actions, chloride ingress and carbonation lead to corrosion of reinforcing bars that reduces the service life of RC structures. Experimental evidence indicates that carbonation and chloride ingress are
* Corresponding author: Emilio Bastidas-Arteaga. Address: 2, rue de la Houssinière BP 92208, 44322
Nantes Cedex 3, France. Phone: +33 (0) 2 51 12 55 24. Fax: +33 (0) 2 51 12 55 57. Email: [email protected]
highly influenced by environmental and climatic conditions of the surrounding environment –i.e. atmospheric CO2 concentration, temperature, and humidity [1].
According to the International Panel of Climate Change (IPCC), the uncertainty of climate projections is high. The annual carbon dioxide concentration growth rate has increased from 1.4 ppm per year during the period 1960–2005 to 1.9 ppm per year during the period 1995–2005 [2]. Following the current patterns, studies have estimated that environmental CO2 concentration could increase from 379 ppm in 2005 over 1000
ppm by the year 2100 [2]. The changes in environmental temperature, relative humidity and carbon dioxide concentration can increase corrosion risks resulting in more widespread corrosion damage and loss of structural safety. Consequently, the effect of atmospheric CO2 concentration change and global warming on both chloride ingress
and carbonation should be considered the long-term management of RC structures. Climate change could affect directly or indirectly human communities and ecosystems in different ways – e.g., sea-level rise, increase in frequency and/or intensity of many extreme climate events, more frequent heat waves, increases in rainfall, etc. The impact of climate change on the performance of structures is becoming an important research issue from an engineering point of view. Moreover, risk-based methods are highly suited to assess the cost-effectiveness of climate adaptation measures. For instance, Bjarnadottir et al. [3] proposed a framework to refine hurricane risk assessment considering the impacts climate change on hurricane intensity and/or frequency. For RC structures, Bastidas-Arteaga et al. [4] proposed a stochastic approach to study the influence of global warming on chloride ingress, but this study only focused on the effect of climate change on the corrosion initiation stage. Stewart and Peng [5] carried out a preliminary risk and cost-benefit study on adaptation measures to mitigate the effects of carbonation of RC structures. Recent work also focused on the assessment of climate change on the durability of concrete structures in specific locations. Stewart
et al. [6,7] and Wang et al. [8] studied the impact of climatic change on
corrosion-induced damage in Australia. They proposed a probabilistic approach to assess corrosion damage (cracking and spalling) taking into account the influence of climate change on areas characterized by different geographical conditions. Talukdar et al. [9] estimated the effects of climate change on carbonation in Canadian cities (Toronto and Vancuver). They found potential increases in carbonation depths over 100 years of approximately 45%. However, this work did not consider the uncertainties related to climate, materials and models, nor did it predict the effect of carbonation on damage and safety of concrete infrastructure.
Within this context, the objective of this paper is to describe a new methodology for estimating the effect of increasing CO2 concentrations and global warming induced
changes in temperature and humidity on the durability and structural safety of RC structures. The first part of the paper presents models of chloride ingress and carbonation that could be used towards this aim. The following section focuses on modelling of effects of global warming on the environmental actions that affect the rates of chloride penetration and carbonation and RC corrosion. This section also includes the projected changes in temperature and humidity in relation to global warming scenarios. The paper then illustrates the effects of global warming on the structural reliability
(collapse limit state) of a RC bridge girder under chloride penetration. The final part of the study outlines some adaptation strategies for design and repair of RC structures accounting for climate change. The results presented in this study are based on the projections of global warming found in the literature [2,10–12]. In the regard, the conclusions outlined herein are not general. Instead, they should be interpreted as overall tendencies for given climate change scenarios.
2. Time-dependent performance of corroding RC structures
The assessment of corrosion effects on RC structures is a difficult task because several deterioration mechanisms interact in the process; ingress of the corroding agent –i.e., chlorides or carbon dioxide, corrosion of reinforcing steel and concrete cover cracking. The ingress of the corroding agent induces corrosion of the reinforcing bars. Corrosion reduces the structural capacity and the accumulation of corrosion products in the steel/concrete interface generates concrete cover cracking. The corrosion process is divided into two stages namely ‘corrosion initiation’ and ‘corrosion propagation’.
2.1. Time to corrosion initiation induced by chloride ingress
The adopted chloride ingress model considers the interaction between three physical processes: chloride ingress, moisture diffusion and heat transfer. Each phenomenon is represented by a partial differential equation (PDE) expressed in the following general form [13]: ζ∂ψ ∂t = div| {z }J diffusion + divJ0 | {z } convection (1)
where ! represents the studied parameter, t is the time and the correspondence between
", J, J' and the terms for the physical problem is presented in Table 1.
For chloride ingress, Cfc is the concentration of free chlorides, h is the relative
humidity and Dc* and Dh* represent the apparent chloride and humidity diffusion
coefficients, respectively: D∗ c = Dc,ref f1(T )f2(t)f3(h) 1 + (1/we) (∂Cbc/∂Cf c) (2) D∗ h = Dh,ref g1(h)g2(T )g3(te) 1 + (1/we) (∂Cbc/∂Cf c) (3)
where Dc,ref and Dh,ref are reference diffusion coefficients measured to standard
conditions [1], we is the evaporable water content, and fi and gi are correction functions
to account for the effects of temperature, relative humidity, aging and degree of hydration of concrete. These functions are detailed in [13]. The term !Cbc/!Cfc
represents the binding capacity of the cementitious system which relates the free and bound chlorides concentration at equilibrium. A Langmuir isotherm is used in this
work.
For moisture diffusion, the humidity diffusion coefficient Dh is estimated by
accounting for the influence of the parameters presented in eq. (3). The term !we/!h
(Table 1) represents the moisture capacity which relates the amount of free water, we,
and the pore relative humidity, h. For a given temperature this relationship has been determined experimentally by adsorption isotherms. According to the Brunauer-Skalny-Bodor (BSB) model, the adsorption isotherm depends on temperature, water/cement ratio, w/c, and the degree of the hydration attained in the concrete, te. This work adopts
the BSB model to represent the moisture capacity.
Finally, for heat transfer (Table 1) #c is the concrete density, cq is the concrete
specific heat capacity, $ is the thermal conductivity of concrete, and T is the temperature inside the concrete after time t.
The boundary conditions at the exposed surfaces consider the flux of " crossing the concrete surface, qψ0s (Robin boundary condition) [1]:
qsψ = Bψ(ψs− ψenv) | {z } diffusion + ψenvqψ0s | {z } convection (4) where B" is the surface transfer coefficient, "s is the value of " at the exposed surface
and "env represents the value of " in the surrounding environment for each physical
problem. The terms in eq. (4) are also presented in Table 1. By fitting experimental data, Saetta et al. [1] reported that BCfc varies between 1 and 6 m/s. Typical values of Bh
are in the range of 2.43-4.17"10-7 m/s [14]. Finally, Khan et al. [15] observed that BT
fluctuates between 6.2 and 9.3 W/(m2 ºC).
The flow of chlorides into concrete is estimated by solving simultaneously the system of equations described by eq. (1) and Table 1. The numerical approach used to solve the coupled system of PDEs combines a finite element formulation with finite difference to estimate the spatial and temporal variation of Cfc, h and T. Then, the time
to corrosion initiation, tini, is estimated by comparing the chloride concentration at the
cover depth, ct, with a threshold concentration for corrosion initiation Cth.
2.2. Time to corrosion initiation induced by carbonation
The carbonation depth (xc in cm) may be predicted from Erreur ! Source du renvoi introuvable., but corrected to allow for kurban as:
xc(t) = r 2DCO2(t) a kurbanCCO2t ✓ to t ◆nm DCO 2(t) = D1t −nd a = 0.75CeCaOαHMCO2 MC aO (5)
where CCO2 is the mass concentration of ambient CO2 (10-3kg/m3); kurban is a factor to
account for increased CO2 levels in urban environments; DCO2(t)is a time-dependent
is the age factor t0 is one year; Ce is cement content (kg/m3); CaO=0.65; %H is a degree
of hydration; MCaO=56 g/mol and MCO2=44 g/mol. The age factor for microclimatic
conditions (nm) associated with the frequency of wetting and drying cycles is nm=0 for
sheltered outdoor conditions.
While eq. (5) was used by Yoon et al. [16] to predict carbonation depths for increases in CO2 concentrations it needs to be recognised that eq. (5) is a point-in-time
predictive model –i.e., the carbonation depth at time t assumes that CCO2 is constant for all times up to time t. This will overestimate carbonation depth as CO2 concentration
will be gradually increasing with time up to the peak value. Stewart et al. (2002) considered this phenomenon and calculated carbonation depths due to enhanced greenhouse CO2 conditions using the average CO2 concentration over the time period,
and not the peak value at time t –i.e., CCO2(t). As such, eq. (5) can be rewritten as [6]:
xc(t) ' s 2fT(t)DCO2(t) a kurban Z t 1 CCO2(t)dt ✓ 1 t ◆nm (6) where fT(t) considers the effect of temperature on carbonation using the Arrhenius Law
[16,17]. A higher temperature will cause an increase in diffusion coefficient leading to increased carbonation depths. To be sure, Eqs. (5) or (6)are approximations, and there is a need for an improved carbonation model that considers the time-dependent effect of CO2 concentration and other parameters such as temperature or humidity.
2.3. Corrosion propagation
After corrosion initiation, the diameter reduction of reinforcing bars induced by corrosion can be estimated in terms of a change in the volumetric rate by using Faraday’s law: du(t) = d0− 0.0232 Z t tini icorr(t)dt p(t) = 0.0116α Z t tini icorr(t)dt (7)
where du(t) is the residual diameter of the reinforcing bar at time t for uniform corrosion
in mm, d0 is the initial diameter of the bar in mm, and p(t) is the pit depth at time t in
mm, % is the ratio between pitting and uniform corrosion depths, and icorr(t) is the
time-variant corrosion rate (µA/cm2). The remaining cross-sectional area of steel for pitting corrosion is computed herein considering the relationships proposed by Val and Melchers [18]. Given the complexity of the corrosion process, icorr depends on many
factors such as concrete pH and availability of oxygen, and water in the corrosion cell. For instance, the optimum relative humidity for corrosion is 70-80%. This study considers the following time-variant corrosion rate model that takes into account the effect of temperature changes [17,19]:
i
corr(t) = icorr,20[1 + Kc(T (t) − 20)] (8)
where icorr,20 is the corrosion rate at 20 ºC, T(t) is the temperature at time t (in ºC) and Kc
is a factor that depends on the value of T(t). For instance, Kc = 0.025 if T(t) < 20ºC or Kc
= 0.073 if T(t) > 20ºC. Corrosion rates are obtained from various sources [20]. For more details of carbonation-induced corrosion due to a changing climate see [5,6].
The LIFECON project proposes a more realistic model for corrosion rate that accounts for the actual concrete resistivity, the influence of chloride content, the galvanic effects and the availability of oxygen [21]. Given that the quantification of various parameters of such a model is partly missing, this work used the DuraCrete model to avoid including more model uncertainties into the problem. However, once more information becomes available, this model could improve the assessment of climate change effects on the corrosion propagation because it includes, among others, the effect of relative humidity variations.
3. Modelling global warming actions
3.1. Effects on climate: temperature and humidity
As mentioned previously, chloride penetration and carbonation are governed by diffusion coefficients that depend, among other factors, on the surrounding humidity and temperature. Therefore, it is necessary to implement a comprehensive model of weather (humidity and temperature). The basic science of weather modelling, including the greenhouse effect, is well understood and has been widely discussed. Nevertheless, given the difficulties of integrating a fully coupled model of weather with chloride ingress and carbonation phenomena, a simplified model of climate is presented in this section. It accounts for the following aspects:
• influence of global warming, • seasonal variations, and
• random nature of weather within a season.
The change of temperature and humidity produced by global warming for the upcoming years is modelled by a linear time-variant function. By denoting ! as the weather parameter (humidity or temperature), the annual mean value of ! for a period of analysis ta (i.e., ta = 100 years) is:
¯ φ(t) = φ0+ ✓ φta− φ0 ta ◆ t (9)
where !0 and !a are the values of the annual means of humidity or temperature at the
beginning of the analysis (t = 0 yr) and at the end of the reference period (t = ta yr),
respectively. To take seasonal variations of humidity and temperature into consideration, the model divides the year into two seasons: hot and cold for temperature, and wet and dry for humidity. Actual forecasts of global warming also
indicate that the droughts increase the length of hot (or wet) seasons, Lh, with respect to
the length of cold (or dry) seasons, Lc [2]. By defining R0 as the normalized duration of
the cold (or dry) season for t=0, i.e. R0 =Lc/( 1 year), and Rta as the normalized duration
of the cold or dry season for t=ta (Lc in yr); it is possible to linearly estimate the
normalized duration of the cold or dry season R for a given t:
R(t) = R0+✓ Rta − R0
ta
◆
btc (10)
where
! "
t represents the floor function. Thus by using a sinusoidal formulation tosimulate the seasonal variation of ! around the linear trend (eq. (9), the seasonal mean of ! for hot of wet seasons is:
¯ κ(t) = ¯φ(t) + φmax− φmin 2 sin ✓ t− btc 1 − R(t)π ◆ (11)
and for cold or dry seasons:
¯ κ(t) = ¯φ(t) − φmax− φmin 2 sin ✓ t− btc 1 − R(t)π ◆ (12)
where &max and &min are respectively the maximum and minimum values taken by &
during one year and t is expressed in years.
To further improve the predictability of the assessments, it is important to implement a model that reproduces realistically temperature and humidity. Therefore, stochastic processes were used to represent the random nature of the weather parameters within a season. Taking into account the simplicity of the implementation and the computational time, the Karhunen-Loève expansion is appropriate to represent the weather variables. Let '(t, () be a random process, which is a function of time t and defined over the domain D with ( belonging to the space of random events !; '(t, () can thus be expanded as follows [22]:
κ(t, θ) ' ¯κ(t) + nkl X i=1 p λiξi(θ)fi(t) (13)
where! is the mean of the process (eqs. (11) and (12)), )i(() is a set of normal random
variables, nKL is the number of terms of the truncated discretization, fi(t) are a complete
set of deterministic orthogonal functions, and $i are the eigenvalues of the covariance
function C(t1,t2). Since closed-form solutions for fi(t) and $i are obtained for an
exponential covariance [22], this study assumes that the processes of temperature and humidity have this kind of covariance.
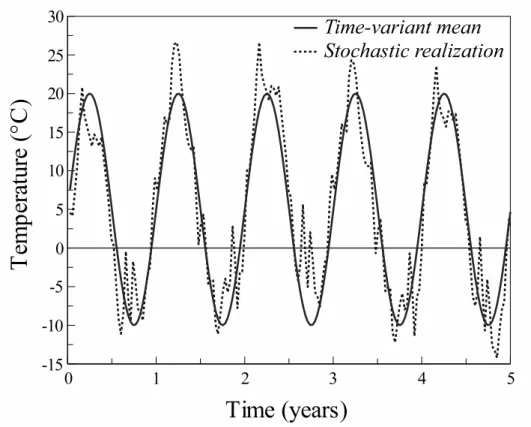
Figure 1 presents a realisation of the stochastic process representing temperature, T, where the parameters for the time-variant mean (eqs. 8 to 11) are T0 =
5ºC, Tta= 7.5ºC, Tmin = –10ºC, Tmax = 20ºC, ta =100 years, R0 = 50%, and Rta = 40%.
highlight that although the stochastic realization follows the tendency of the time-variant mean, it includes the appearance of extreme values during the exposure time. This behaviour has been observed for real exposure conditions, and may contribute to higher corrosion damage.
This climate model can be used to represent the temperature or relative humidity for a given location. However, on real structures, structural components could be exposed to different climate exposures (solar radiation, wind, etc.) that will also affect deterioration. Although a comprehensive evaluation of climate change effects for a real structure should account for these microclimatic variations, this study focuses on the study of various exposure conditions and climate change scenarios for single components.
3.2. Increase of carbon dioxide emissions
The increase of actual atmospheric CO2 concentration is difficult to model because it
depends on several factors that differ for a particular problem. For instance, Stewart et
al [23] found that the environmental CO2 concentration in an urban environment could
be approximately 5 – 10 % higher than CO2 concentrations in a rural environment. CO2
concentration in urban environments also depends on different factors such as: combustion of fossil fuels from traffic, domestic heating, power generation, etc. [5]. On the other hand, future carbon dioxide emissions will be determined by different socio-technical and political factors such as: population growth, economy, use of clean technology, etc. To account for these factors, the IPCC [2] defined four scenarios families of global warming (i.e., A1, A2, B1 and B2).
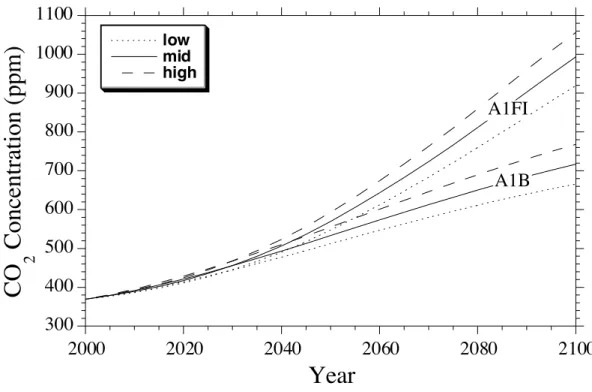
Figure 2 presents a projection from 1990 of atmospheric carbon dioxide concentrations for various global warming scenarios. This projection is based on the Model for Assessment of Greenhouse-gas Induced Climate Change [24]. The scenario A1F1 assumes a rapid economic growth, a stabilization of population growth in the mid-century, a rapid introduction of clean technologies and an intensive introduction of fossil sources of energy. The scenario A1B has similar assumptions excepting that there is a balance between consumption of fossil and non-fossil sources of energy. The values presented in Figure 2 show the IPCC predicted mean and 10th and 90th percentiles of CO2 concentration to 2100, which can be used in eq. (5) for lifetime durability
assessment for RC structures subject to carbonation.
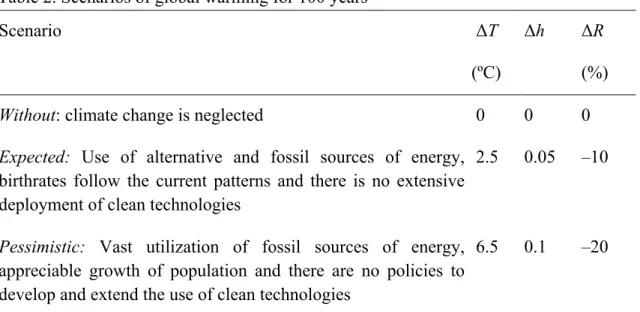
3.3. Climate scenarios of global warming
This analysis defines three possible scenarios of global warming: without, expected and
pessimistic global warming. The characteristics of the selected scenarios gather the
information currently available and make consistent assumptions when needed [2,10– 12]. A complete description of these considerations is given in [4]. The most important factors considered in such a study are: carbon dioxide, methane and nitrous oxide emissions; global population growth; introduction of new and clean technologies leading to the reduction of CO2 emissions; and use of fossil sources of energy. Thus,
each scenario is defined in terms of:
• the difference between the annual means of temperature for the initial year T(t0)
and the year of the end of the forecast T(ta), #T,
• the difference between the annual mean of relative humidity for h(t0) and h(ta),
#h, and
• the difference between the normalized durations of cold seasons for R(t0) and
R(ta), #R.
By taking as reference a period of analysis of 100 years –i.e., ta = 100 yr, the
features and the values of #T, #h and #R for each scenario are given in Table 2.
4. Numerical example
4.1. Problem description
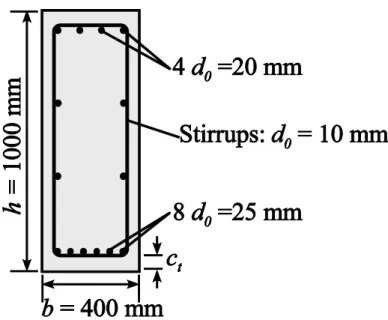
This example evaluates the influence of realistic environmental conditions including global warming on the structural reliability of a simply supported RC girder placed in various chloride-contaminated environments. This girder has a span of 10 m and is subjected to a point (concentrated) wheel load placed in the middle of the span. Figure 3 presents the characteristics of the cross-sectional section that has been designed according to Eurocode 2 [25]. Its material design properties are described in Table 3 and the climatic conditions are defined by:
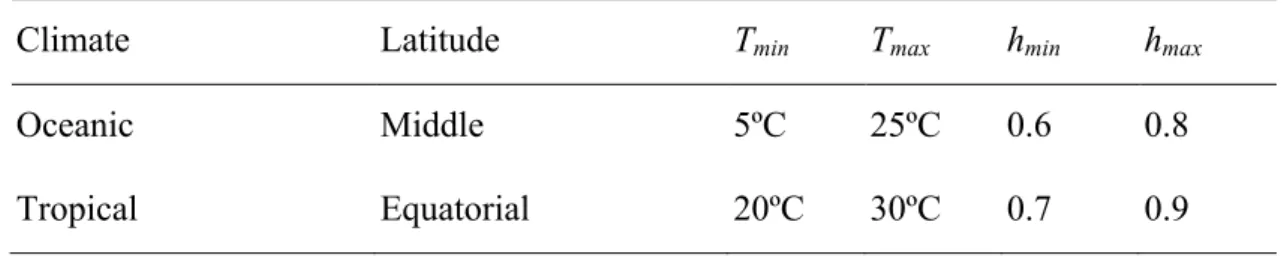
• two environments: oceanic and tropical (Table 4);
• three scenarios of global warming: without, expected and pessimistic (Table 2); and
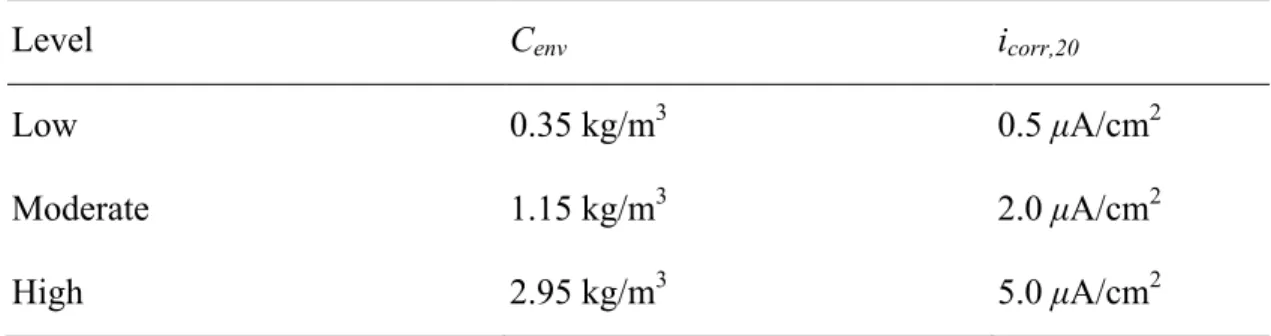
• three levels of corrosion aggressiveness: low, moderate and high (Table 5). The time to corrosion initiation considers flow of chlorides in one dimension where the Langmuir isotherm is used to account for chloride binding. The constants of the isotherm are %L=0.1185 and *L=0.09.
4.2. Probability of failure
The integration of the deterioration models presented in section 2 into a suitable probabilistic framework is necessary to perform efficient probabilistic lifetime assessments and reliability analysis. The cumulative distribution function (CDF) of the time to failure, tf, is:
Ftf(t) = Pr{tf ≤ t} =
Z
tf≤t
f(x)dx (14)
where x is the vector of random variables to be taken into account, and f (x) is the joint probability density function (PDF) of x. The cumulative failure probability, pf, is then
pf =
Z
g(x,t)≤0
f(x)dx (15)
where g(x, t) is the limit state function. Defining failure in terms of the limit state of bending, g(x, t) becomes:
g(x, t) = Mf(As(t), x) − Me(P, x) (16)
where As(t) is the residual cross-sectional area of reinforcement at time t, P is the
applied load, x is the vector of random variables (i.e. concrete compressive strength, f’c,
yield stress, fy, etc.), Mf (As(t), x) is the bending moment capacity, and Me (P, x) is the
bending moment due to the load P.
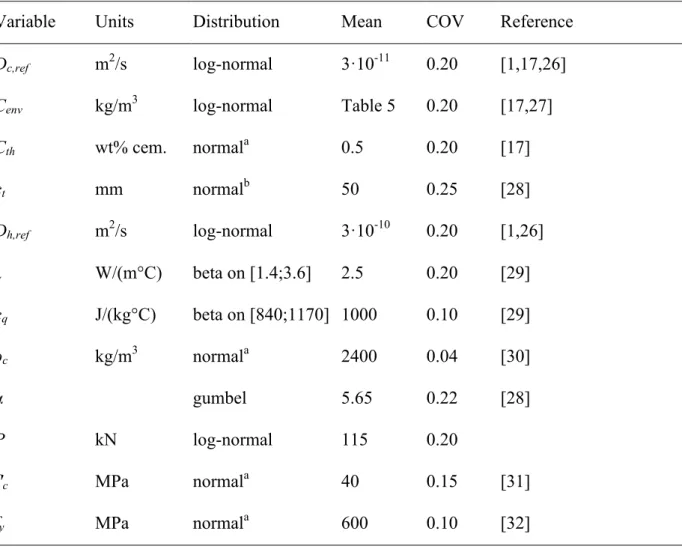
Closed-form solutions for both the CDF of the time to failure and the failure probability are very difficult to obtain. Therefore, Monte Carlo simulations and Latin hypercube sampling are used herein to deal with this problem. The probabilistic models used to estimate both failure probability and PDF of the time to failure are presented in Table 6. It is assumed that all the random variables are statistically independent. Probabilistic loading P is modelled by a random wheel load placed at the middle of the span.
For illustrative purposes, this example focused on the study of the effects of climate change under several environmental conditions defining failure only in terms of the limit state of bending. The study of the influence of other failure modes is beyond the scope of the paper. However, the results of the evaluation of the effects of climate change could change when the limit state function is defined in terms of other failure modes [4,6–8]. Therefore, although similar trends could be obtained for other failure modes, it is important to highlight that the conclusions of section 4.3 are only valid for the limit state function presented by eq. (16).
4.3. Results
The effect of three types of weather models are considered:
1. Constant: temperature and humidity are constant within any one year and adopts its annual mean value for modelling –e.g, from Table 4, T = 15ºC and h = 0.7. 2. Time-variant: uses eqs. (11) and (12) to consider the seasonal mean variations
of temperature and humidity.
3. Stochastic: accounts for the randomness of temperature and humidity within a season (eq. (13)).
The effect of weather models on the probability of failure is presented in Figure 4. These curves, obtained for the oceanic environment and the high level of corrosion aggressiveness, but do not consider the effect of global warming. In general, the failure probability is highly dependent on the type of weather model. Constant and time-variant models underestimate failure probabilities. For instance, a constant level of failure probability (i.e., pf =0.5) is reached at 62, 77 and 120 years for stochastic, time-variant
and constant models, respectively. The time to failure is highly dependent on the time to corrosion initiation which is influenced by the type of weather model. Therefore, the selection of an appropriate weather model becomes a paramount issue in the computation of failure probability. These results support the use of a comprehensive model of chloride ingress including realistic weather models for an optimum lifetime assessment.
Figure 5 shows the failure probability of the beam for the tropical and the oceanic environments, and the three levels of corrosion aggressiveness for the stochastic weather model ignoring global warming. It is observed that the failure probability increases, in all cases, when the level of corrosion aggressiveness is higher. This increment is caused by higher concentrations of chlorides and corrosion rates in aggressive environments. If failure probabilities are evaluated for a lifecycle length of 50 years, the structural reliabilities are very low for the high level of corrosion aggressiveness. By considering that the failure probability should be lower than a critical value to ensure a safety level –i.e., pf < pft =10-4, the studied structural
configuration only guarantees this condition for moderate and low levels of aggressiveness. These results are not surprising because in real structures close to the sea as ports or quays, appreciable levels of deterioration have been reported after only 15 or 20 years of exposure. The results are similar for both environments. However, the failure probabilities are lower for the oceanic environment where the lower temperature and humidity delay corrosion initiation. This behaviour indicates that a sophisticated model of chloride ingress calibrated with experimental observations and monitored with inspections should be included in the management of structures to assure appropriate levels of serviceability and safety during its lifecycle.
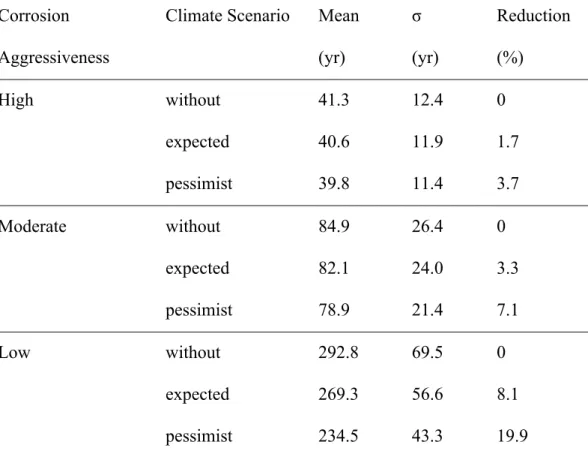
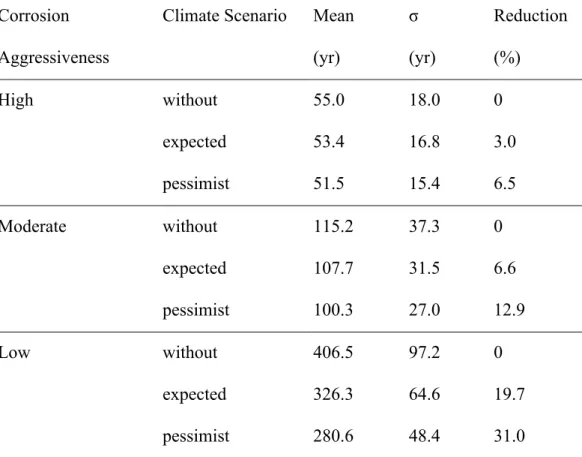
The effects of weather and global warming on the PDF of time to failure are then evaluated. The PDFs for all the studied cases were adjusted from the Monte Carlo results where the selection criterion was the Kolmogorov-Smirnov test with a level of significance of 5%. For all cases, the best fitting corresponds to lognormal distributions. Tables 7 and 8 present the computed mean and standard deviation of the time to failure for the studied cases, for three climate scenarios using the stochastic weather model. It is observed that the mean time to failure decreases for more aggressive environments. The mean time to failure is lower for tropical than for oceanic environments. This behaviour seems logical because tropical environments are characterized by higher temperature and humidity that accelerate chloride ingress reducing corrosion initiation time. By taking as reference the scenarios without global warming, it is also noted that the effect of global warming is more important for structures located in oceanic environments. While for the tropical environment global warming induced reductions varying from 1.7% to 19.9% in the mean time to failure, for the oceanic environment this reduction ranges between 3% and 31%. It can be concluded that global warming has more influence in environments where humidity and temperature are characterized by important seasonal variations.
This example showed that climate change could lead to considerable reduction to the predicted time to failure. Other works have shown that climate change can
increase damage risks by up to 460% for carbonation-induced corrosion, and up to 15% for chloride-induced corrosion [4,8].
5. Adaptation strategies
Climate adaptation in terms of the enhancement of adaptive capacity can be done by developing new technologies and materials to counter the impact of increasing corrosion risk under a changing climate. On the other hand, there is a wide range of existing and ‘low-tech’ options that can enhance the durability of concrete structures and these can be applied to reduce the adverse affects of climate change. The design options generally include the selection of cover, concrete mix, surface coating barriers, extraction, and cathodic protection. In addition to reducing environmental exposure as much as possible, practical adaptation solutions in a new design may come from increasing cover and strength grade, or any approaches that reduce material diffusion coefficient without compromising the reliability and serviceability of concrete. Adaptation measures for new and existing concrete structures may include:
(1) Surface treatments, (2) Realkanization, (3) Extra design cover,
(4) Increase concrete durability,
(5) Stainless or galvanised steel reinforcement, (6) Corrosion inhibitors,
(7) Cathodic protection, and
(8) Replace existing cover with new concrete.
The time of application is highly variable and dependent on extent and location of corrosion damage. Some adaptation strategies will be applied at time of construction (coatings/surface treatments, reinforcement), and others at time of corrosion initiation (realkanization, chloride extraction). Clearly, it is preferable to use adaptation strategies that are implemented during design and construction rather than in-service (e.g., when corrosion damage occurs) as the latter will be much more costly in terms of direct costs and inconvenience/user delays and other indirect costs (e.g., Stewart et al. [7]).
These adaptation strategies will have varying degrees of effectiveness and cost. Some will require regular maintenance over the life of the structure, such as surface treatments, which will increase their lifecycle cost. Given that there are many millions of new and existing concrete infrastructure in many countries the cost of adaptation can be immense. For this reason, a risk-based approach is needed to assess the optimal level, if any, of adaptation measures. This includes the cost, location, timing and extent of adaptation measures.
The increase in cover thickness can increase the time of carbonation and chloride ingress to reach concrete reinforcement and in turn delay carbonation and chloride-induced corrosion. It is therefore one of the most obvious and simplest adaptation options in the design of concrete infrastructure under a changing climate to
maintain structural durability and serviceability. While the change of cover is considered as the most straightforward design approach to reduce the impact of changing climate, other options may also include the selection or design of concrete materials to reduce the diffusion coefficient of deleterious substances –i.e. slow the ingress of those substances, and hence delay corrosion of concrete reinforcement. In practice, selection of a higher strength grade of concrete is one approach to reduce the diffusion coefficient, in addition to enhancing its mechanical properties.
Stewart and Peng [5] have conducted a preliminary lifecycle cost assessment to assess the cost-effectiveness of increasing design cover as an adaptation measure to mitigate the effects of carbonation of concrete. The lifecycle cost analysis considered costs associated with extra design cover and expected maintenance/repairs for typical RC structures and elements over the next 100 years considering several IPCC atmospheric CO2 emission scenarios. The preliminary analysis found that lifecycle costs
for the current situation (‘do nothing’ – use existing covers) are lower than lifecycle costs for proposed increases in design cover. This suggests that although enhanced greenhouse conditions will lead to increased carbonation-induced corrosion of RC structures it may not be cost-effective to increase design covers. However, a more detailed assessment of risks, costs, benefits of adaptation measures and environmental impact may reveal a different conclusion. What is important is the need to estimate time-dependent changes in damage risks, the effectiveness and cost of one or more adaptation measures, costs of repairing damage, and other criteria needed to assess the optimal level of adaptation measures both now and into the future.
6. Conclusions
This paper presented some considerations to assess the effects of global warming on the durability of corroding RC structures subjected to chloride ingress or carbonation. The first part of this paper described the deterioration models that can be used for modelling this interaction. Afterwards, the discussion focused on modelling the effects of global warming on the environmental factors that could alter the kinematics of the deterioration process (temperature, humidity and CO2 concentrations). The proposed
methodology is illustrated with a numerical example that studies the effects of climate change on the structural reliability and time to failure of a RC bridge girder placed in a chloride-contaminated environment. The results showed that global warming can reduce the time to failure by up to 31%, or shorten service life by up to 15 years for moderate levels of aggressiveness. The final part of the paper outlined different adaptation strategies that can be used to mitigate the effect of deterioration processes and global warming on structural safety. It is concluded that an optimal adaptation strategy should be selected by considering its risks, costs, benefits and environmental impact.
Acknowledgements
Some of this work was undertaken while the Professor Mark G. Stewart was visiting the Institute for Research in Civil and Mechanical Engineering at the University of Nantes. The support of the University of Nantes and the LiRGeC (Institut Ligérien de Recherche en Génie Civil et Construction) for funding this position of Visiting Scholar is gratefully acknowledged.
References
[1] Saetta A, Scotta R, Vitaliani R. Analysis of chloride diffusion into partially saturated concrete. ACI Materials Journal 1993;90:441–451.
[2] IPCC. Climate Change 2007: The Physical Science Basis. Contribution of Working Group I to the Fourth Assessment Report of the Intergovernmental Panel on Climate Change. Cambridge, United Kingdom and New York, NY, USA: Cambridge University Press, 2007.
[3] Bjarnadottir S, Li Y, Stewart MG. A probabilistic-based framework for impact and adaptation assessment of climate change on hurricane damage risks and costs. Structural Safety 2011;33:173–185.
[4] Bastidas-Arteaga E, Chateauneuf A, Sánchez-Silva M, Bressolette P, Schoefs F. Influence of weather and global warming in chloride ingress into concrete: A stochastic approach. Structural Safety 2010;32:238–249.
[5] Stewart MG, Peng JX. Life-cycle cost assessment of climate change adaptation measures to minimise carbonation-induced corrosion risks. International Journal of Engineering Under Uncertainty 2012;35–46.
[6] Stewart MG, Wang X, Nguyen MN. Climate change impact and risks of concrete infrastructure deterioration. Engineering Structures 2011;33:1326–1337.
[7] Stewart MG, Wang X, Nguyen MN. Climate change adaptation for corrosion control of concrete infrastructure. Structural Safety 2012;35:29–39.
[8] Wang X, Stewart MG, Nguyen M. Impact of climate change on corrosion and damage to concrete infrastructure in Australia. Climatic Change 2012;110:941– 957.
[9] Talukdar S, Banthia N, Grace JR, Cohen S. Carbonation in concrete
infrastructure in the context of global climate change: Part 2, Canadian urban simulations. Cement and Concrete Composites 2012;34:931–935.
[10] Allen MR, Ingram WJ. Constraints on future changes in climate and the hydrologic cycle. Nature 2002;419:224–232.
[11] Sperling FN, Washington R, Whittaker R. Future climate change of the
subtropical north atlantic: implications for the cloud forests of Tenerife. Climatic Change 2004;65:103–123.
[12] Vuille M, Bradley RS, Werner M, Keimig F. 20th century climate change in the tropical Andes: observations and model results. Climatic Change 2003;59:75–99. [13] Bastidas-Arteaga E, Chateauneuf A, Sánchez-Silva M, Bressolette P, Schoefs F.
A comprehensive probabilistic model of chloride ingress in unsaturated concrete. Engineering Structures 2011;33:720–730.
[14] Akita H, Fujiwara T, Ozaka Y. A practical procedure for the analysis of moisture transfer within concrete due to drying. Magazine of Concrete Research
1997;49:129–137.
[15] Khan A, Cook W, Mitchell D. Thermal properties and transient thermal analysis of structural members during hydration. ACI Materials Journal 1998;95:293–303. [16] Yoon I-S, Copuroglu O, Park K-B. Effect of global climatic change on
carbonation progress of concrete. Atmospheric Environmentn.d.;41:7274–7285. [17] Duracrete. Statistical quantification of the variables in the limit state functions,
DuraCrete - Probabilistic Performance based Durability Design of Concrete Structures, EU - Brite EuRam III, Contract BRPR-CT95-0132, Project BE95-1347/R9. 2000.
[18] Val DV, Melchers RE. Reliability of deteriorating RC slab bridges. Journal of Structural Engineering ASCE 1997;123:1638–1644.
[19] Duracrete. Probabilistic calculations. DuraCrete—probabilistic performance based durability design of concrete structures. EU—brite EuRam III. Contract BRPR-CT95-0132. Project BE95-1347/R12-13. 2000.
[20] Duracrete. Modelling of Degradation, DuraCrete - Probabilistic Performance based Durability Design of Concrete Structures, EU - Brite EuRam III, Contract BRPR-CT95-0132, Project BE95-1347/R4-5. 1998.
[21] Lay S, SchieBl P. Service Life Models: Instructions on methodology and application of models for the prediction of the residual service life for classified environmental loads and types of structures in Europe. LIFECON project, deliverable D3.2. Contract G1RD-CT-2000-00378. 2003.
[22] Ghanem RG, Spanos PD. Stochastic Finite Elements: A Spectral Approach. New York, USA: Springer, 1991.
[23] Stewart MG, Teply V, Kralova H. The Effect of Temporal and Spatial Variability of Ambient Carbon Dioxide Concentrations on Carbonation of RC Structures, in: 9th International Conference on Durability of Building Materials and
Components, CSIRO, 2002.
[24] Wigley TML, Richels R, Edmonds JA. Economic and environmental choices in the stabilization of atmospheric CO2 concentrations. Nature 1996;379:240–243. [25] European standard. Eurocode 1 and 2: Basis of design and actions on structures
and design of concrete structures. AFNOR. 2004.
[26] Val D, Trapper P. Probabilistic evaluation of initiation time of chloride-induced corrosion. Reliability Engineering and System Safety 2008;93:364–372.
[27] Vu KAT, Stewart MG. Structural reliability of concrete bridges including improved chloride-induced corrosion. Structural Safety 2000;22:313–333. [28] Val DV, Stewart MG. Life-cycle analysis of reinforced concrete structures in
marine environments. Structural Safety 2003;25:343–362.
[29] Neville A. Properties of Concrete (3rd ed.). Longman Scientific & Technical, 1981.
[30] JCSS (Joint committee of structural safety). Probabilistic model code. 2001. [31] Pham L. Reliability Analysis of Reinforced Concrete and Composite Column
Sections Under Concentric Loads. Civil Engineering Transactions 1985;1:68–72. [32] Mirza SA, Hatzinikolas M, MacGregor JG. Statistical Descriptions of Strength of
List of Tables
• Table 1. Correspondence between eq. (1) and the governing differential equations
• Table 2. Scenarios of global warming for 100 years • Table 3. Design load and material constants
• Table 4. Description of the studied environments • Table 5. Corrosion aggressiveness levels
• Table 6. Probabilistic models of the random variables
• Table 7. Mean and standard deviation of the time to failure for the tropical environment
• Table 8. Mean and standard deviation of the time to failure for the oceanic environment
List of Figures
• Figure 1. Time-variant and stochastic modelling of temperature • Figure 2. CO2 concentrations for various global warming scenarios • Figure 3. Configuration of the bridge girder
• Figure 4. Influence of the type of weather model on the failure probability for a high level of corrosion aggressiveness
Table 1. Correspondence between eq. (1) and the governing differential equations Physical Process! " ! J J’ q0sψ Chloride ingress Cfc 1 D∗ c − ! r Cf c Cf cD∗ h − ! r h qsh Moisture diffusion h !we/!h D∗ h − ! r h 0 0 Heat transfer T #c cq λ−!r T 0 0
Table 2. Scenarios of global warming for 100 years
Scenario #T #h #R
(ºC) (%)
Without: climate change is neglected 0 0 0
Expected: Use of alternative and fossil sources of energy,
birthrates follow the current patterns and there is no extensive deployment of clean technologies
2.5 0.05 –10
Pessimistic: Vast utilization of fossil sources of energy,
appreciable growth of population and there are no policies to develop and extend the use of clean technologies
Table 3. Design load and material constants
Variable Value
Characteristic design load, Pk! 150 kN
Elastic modulus of steel, Est 200 GPa
Characteristic concrete compression strength, f’ck 30 MPa
Characteristic steel strength, fyk 500 MPa
Table 4. Description of the studied environments
Climate Latitude Tmin Tmax hmin hmax
Oceanic Middle 5ºC 25ºC 0.6 0.8
Table 5. Corrosion aggressiveness levels
Level Cenv icorr,20
Low 0.35 kg/m3 0.5 µA/cm2
Moderate 1.15 kg/m3 2.0 µA/cm2
Table 6. Probabilistic models of the random variables
Variable Units Distribution Mean COV Reference
Dc,ref m2/s log-normal 3$10-11 0.20 [1,17,26]
Cenv kg/m3 log-normal Table 5 0.20 [17,27]
Cth wt% cem. normala 0.5 0.20 [17] ct mm normalb 50 0.25 [28] Dh,ref m2/s log-normal 3$10-10 0.20 [1,26] $ W/(m°C) beta on [1.4;3.6] 2.5 0.20 [29] cq J/(kg°C) beta on [840;1170] 1000 0.10 [29] #c kg/m3 normala 2400 0.04 [30] % gumbel 5.65 0.22 [28] P kN log-normal 115 0.20 f'c MPa normala 40 0.15 [31] fy MPa normala 600 0.10 [32] a truncated at 0, btruncated at 10mm
Table 7. Mean and standard deviation of the time to failure for the tropical environment
Corrosion Climate Scenario Mean % Reduction
Aggressiveness (yr) (yr) (%)
High without 41.3 12.4 0 expected 40.6 11.9 1.7 pessimist 39.8 11.4 3.7 Moderate without 84.9 26.4 0 expected 82.1 24.0 3.3 pessimist 78.9 21.4 7.1 Low without 292.8 69.5 0 expected 269.3 56.6 8.1 pessimist 234.5 43.3 19.9
Table 8. Mean and standard deviation of the time to failure for the oceanic environment Corrosion Climate Scenario Mean % Reduction
Aggressiveness (yr) (yr) (%)
High without 55.0 18.0 0 expected 53.4 16.8 3.0 pessimist 51.5 15.4 6.5 Moderate without 115.2 37.3 0 expected 107.7 31.5 6.6 pessimist 100.3 27.0 12.9 Low without 406.5 97.2 0 expected 326.3 64.6 19.7 pessimist 280.6 48.4 31.0
300 400 500 600 700 800 900 1000 1100 2000 2020 2040 2060 2080 2100 low mid high
CO
2Con
ce
nt
ra
ti
on
(pp
m
)
Year
A1FI A1BFigure 4. Influence of the type of weather model on the failure probability for a high level of corrosion aggressiveness

![[PDF] Support d’introduction à Adobe Illustrator pour débutant | Cours informatique](data:image/gif;base64,R0lGODlhAQABAIAAAP///wAAACH5BAEAAAAALAAAAAABAAEAAAICRAEAOw==)