Freshwater sample preservation for the analysis of dissolved low molecular
mass thiols
Maxime Leclerc1, Dolors Planas2 and Marc Amyot1*
AUTHOR ADDRESSES
1GRIL, Département de sciences biologiques, Université de Montréal, C.P. 6128, Succursale
Centre-Ville, Montréal, Québec, Canada, H3C 3J7
2GRIL, Département de sciences biologiques, Université du Québec à Montréal, C.P. 8888,
Succursale Centre-Ville, Montréal, Québec, Canada H3C 3P8
*CORRESPONDING AUTHOR
Marc Amyot, GRIL, Département de sciences biologiques, Université de Montréal, C.P. 6128, Succursale Centre-ville, Montréal, Québec, Canada, H3C 3J7; email : m.amyot@umontreal.ca; phone : 514-343-7496
RUNNING HEAD
Preservation of thiols from freshwater samples
KEYWORDS
thiols, thioglycolic acid, cysteine, cysteine-glycine, glutathione, degradation, lakes, rivers 1 2 3 4 5 6 7 8 9 10 11 12 13 14 15 16 17 18
Abstract
Low molecular mass (LMM) thiols are ubiquitous organosulfur peptides that play key roles in biogeochemical element cycling. These LMM thiols, found at low concentrations in the water column, are highly sensitive to oxidation and degradation processes which may lead to problems with detection and analysis. Natural water samples should be stored and handled appropriately to reduce thiol loss in the time period from sampling to analysis. Storage temperatures were investigated for optimal preservation of four thiols species. Thiol degradation varied between species and was generally slower in samples stored at -80 and 4 °C compared to -20 and 21 °C. Two natural freshwater matrices were tested, one from a fluvial lake subject to agricultural inputs and one from an oligotrophic pristine lake. After 6 days of storage at -20 °C, the most affected thiol species was glutathione with a degradation rate (kD) of (3.0 ± 0.5) × 10-3 h
-1 in the fluvial lake water and L-cysteine-L-glycine (CYS-GLY) with a k
D of (3.8 ± 0.8) × 10-3 h-1
in the oligotrophic lake water. Argon purging of samples did not prevent thiol degradation or oxidation after storage for 7 days. Pre-concentration by freeze-drying techniques led to significant loss for every thiol species tested (up to 65% for cysteine). We recommend improving storage methods by using temperatures of -80 or 4 °C. The use of correction factors to estimate initial thiol concentrations is possible but should be used with caution due to highly site-specific kD in natural waters. 19 20 21 22 23 24 25 26 27 28 29 30 31 32 33 34 35 36
Introduction
Thiols are ubiquitous cellular compounds associated with protein structures or found as low molecular mass (LMM) peptides (< 1kDa) involved in several intracellular pathways. For most microorganisms, LMM thiols play detoxifying roles protective against reactive oxygen species (Noctor and Foyer 1998; Fahey 2001) and metallic stress (Ahner et al. 2002; Kawakami et al. 2006b). These LMM thiols can be found in the extracellular space of aquatic environments, originating mostly from cell lysis or exudation (Leal et al. 1999; Dupont and Ahner 2005). Once outside the cell, dissolved thiols become important compounds in the sulfur biogeochemical cycle and for metal complexation, as they are transition molecules between inorganic and organic sulfur forms (Andreae and Jaeschke 1992; Pohlabeln and Dittmar 2015) and prime ligands controlling chalcophilic metal speciation and mobility (Smith et al. 2002; Szczuka et al. 2015; Swarr et al. 2016).
In recent decades, many laboratory studies have investigated these important roles of extracellular LMM thiols in several biogeochemical cycles (Hsu-Kim et al. 2013; Zheng et al. 2013; Manceau et al. 2015; Si and Ariya 2015; Walsh et al. 2015). However, despite their presumed importance in element cycling, there is currently little evidence linking laboratory observations to natural processes. Dissolved LMM thiols have rarely been studied in natural freshwater environments, especially in surface waters. The lack of scientific literature may result from several logistical constraints related to the detection of low concentrations, the complexity of analytical procedures, the redox sensitivity of thiols, and their susceptibility to degradation (Kawakami et al. 2006a). For instance, compared to intracellular concentrations which are usually reported above micromolar levels, individual dissolved LMM thiol species are usually found below 10 nM in oxic layers of the water column (Tang et al. 2000a; Hu et al. 2006; Liem-37 38 39 40 41 42 43 44 45 46 47 48 49 50 51 52 53 54 55 56 57 58 59
Nguyen et al. 2015) which may lead to an absence of detection, as observed by Pohlabeln and Dittmar (2015) who used mass spectrometry techniques in oceanic waters.
Recent analytical advances, based on voltammetric methods, now allow direct in situ measurements of some thiol species (Laglera et al. 2014). However, analytical methods using derivatization with fluorescent probes followed by separation with liquid chromatography usually have greater sensitivity and selectivity for different thiol species. Chromatography methods, coupled with the use of reducing reagent during derivatization, allow for computation of LMM thiols under reduced and oxidized forms (Rijstenbil and Wijnholds 1996; Dupont et al. 2006; Kawakami et al. 2006a; Liem-Nguyen et al. 2015). This is of interest for studies on metal speciation or oxidative stress, but can lead to sample preservation issues. The sensitivity of LMM thiols to oxidation and degradation processes is an important constraint for field studies requiring sample storage before analysis. The standard advice is to treat samples with derivatization reagent to stabilize thiol compounds and then perform analysis as soon as possible after sampling (Hu et al. 2006). However, large-scale sampling campaigns in remote areas may not allow for rapid sample treatment or analysis within a reasonable time (Swarr et al. 2016) and therefore sample storage conditions must be optimized. For example, thiols are sensitive to photodegradation by ultraviolet radiation and should be kept away from light (Laglera and van den Berg 2006; Moingt et al. 2010). Storage temperature has also been shown to influence thiol degradation (England and Wilkinson 2011). The strong binding capacity of thiols to metal ions and their susceptibility to enzymatic activities are also likely to modify degradation rates of stored thiols (Dupont et al. 2006; Kawakami et al. 2006a). Furthermore, the water chemistry from where the thiols are sampled should be considered as thiol oxidation and degradation are 60 61 62 63 64 65 66 67 68 69 70 71 72 73 74 75 76 77 78 79 80 81
influenced by pH (Winterbourn and Metodiewa 1999), the presence of free radicals (Forlano et al. 1997) and metal ions (Hsu-Kim 2007; Moingt et al. 2010), for instance.
In contrast to the many studies on biological samples (blood or intracellular content) (e.g. Lobo et al. 2007), there is limited data on LMM thiol analysis for natural water samples. Therefore, the overall aim of this study is to establish the optimal storage conditions and proper handling of natural water samples. We verified the effect of storage temperatures over time and the impact of freeze-drying as well as inert gas bubbling on water samples. We also tested the hypothesis that water chemistry could affect thiol degradation during storage by contrasting degradation rates in two chemically distinct natural freshwater samples: one from an oligotrophic pristine lake and one from a fluvial lake subjected to agricultural inputs. These two matrices were amended with different concentrations of thiol solutions containing four LMM species commonly studied in the literature, namely thioglycolic acid (TA), cysteine (CYS), L-cysteine-L-glycine (CYS-GLY), and L-glutathione (GSH). Lake water was also sampled in summer and winter to compare the seasonal differences within a natural system. Studies using contrasting natural water matrices such as this one are necessary to reflect the complex chemical processes that are not observed in artificial water matrices (Moingt et al. 2010). Finally, we outline proper storage and manipulation techniques for dissolved LMM thiol analyses in natural water samples using liquid chromatography techniques. We propose a simple method applicable for field studies at remote sites which uses a correction factor for the unavoidable decrease of thiols concentrations over time.
82 83 84 85 86 87 88 89 90 91 92 93 94 95 96 97 98 99 100 101 102
Materials and Procedures
Study sites and sampling procedures
Experiments were conducted using water from two different freshwater sites in Québec (Canada): Lake St. Pierre (LSP) and Lake Croche. Lake St. Pierre (46°09’36”N, 72°49’25”W) is a 375 km2 widening of the St. Lawrence River and the water was collected in late summer 2013
within dense beds of macrophytes located on the eutrophic south shore of this fluvial lake. Lake Croche (45°59’34”N, 74°00’26”W) is a 0.19 km2 oligotrophic pristine Precambrian Shield lake
where summer (Lake Crochesummer) and winter (Lake Crochewinter) sampling occurred between
2013 and 2015. For Lake Croche, samples were collected in the littoral and the pelagic zones. General water characteristics are shown in Table 1 for both sample sites.
All Teflon and glassware used for sampling was carefully acid washed (45% HNO3; 5%
HCl) overnight, as was plasticware (10% HCl), then rinsed three times with Milli-Q water. Water samples were collected at 1 m depth using a peristaltic pump with Norprene and Teflon tubing cleaned with 10% HCl solution and rinsed with site water. Summer samples were filtered in the field with a high capacity GWV groundwater sample filter (0.45 µm pore size; Pall) whereas winter samples were collected under ice and filtered in the laboratory with cellulose nitrate filters of 47 mm diameter and 0.45 µm pore size (Whatman). Milli-Q water was also used for controls.
Experimental design
Experiments were conducted using natural water amended with thiol solutions diluted in acetate buffer (5 mM sodium acetate, 0.1 mM ethylenediaminetetraacetic acid (EDTA), 4.0 pH adjusted with acetic acid) for final concentrations ranging from 10 to 100 nM each of TA, CYS, 103 104 105 106 107 108 109 110 111 112 113 114 115 116 117 118 119 120 121 122 123 124
CYS-GLY, and GSH in 1 L Teflon bottles. After thiol addition and homogenization, samples were aliquoted in 30 mL high-density polyethylene (HDPE) bottles. Thiol analyses were then immediately conducted on a subset of bottles (time zero, t0 samples) while the remaining aliquots
were stored in the dark under different storage temperatures until analysis. Once removed from storage, frozen samples were left in warm water to melt in the dark for 30 min before derivatization.
Storage temperature
The effect of storage temperature was first investigated using water from Lake Crochewinter
amended with 100 nM thiol solution. Samples were kept at -80 °C, -20 °C, 4 °C, and 21 °C for 7 days. A similar test was conducted at -80 °C and -20 °C for up to 15 days using Milli-Q water as a control and a natural water matrix from Lake Crochesummer.
Water chemistry
The impact of matrix water chemistry for natural waters on the loss of thiols was investigated using LSP and Lake Crochesummer water amended with 100 nM thiol solutions. The degradation of
GSH as a source for smaller thiol species was tested using lake water spiked with a 100 nM GSH solution. Samples were kept at -20 °C for up to 52 days of storage.
Purging oxygen
The effect of purging oxygen was tested on Lake Crochewinter water amended with 100 nM
thiol solutions. Both water samples and acetate buffer were purged using argon gas (UHP Grade, Praxair, Mississauga, Canada) for 15 minutes. Bottles were sealed carefully, headspaces were filled up with argon to minimize oxygen inputs, and bottles were stored at -20 °C for 7 days. To measure redox state, thiols under reduced form were measured without reducing agent (Tris(2-125 126 127 128 129 130 131 132 133 134 135 136 137 138 139 140 141 142 143 144 145 146
carboxyethyl) phosphine hydrochloride; TCEP) and oxidized thiols were calculated as the difference between total and reduced thiols, as shown by Kawakami et al. (2006a).
Freeze-drying
Freeze-drying effects were tested with Lake Crochewinter water amended with 10 nM thiol
solutions. Samples were aliquoted into 1.5 mL polypropylene microcentrifuge tubes or 30 mL HDPE bottles and immediately stored at -80 °C in a low-temperature freezer. Replicates were treated in a freeze-dry system until completely dry (6 to 48 h), and then diluted in Milli-Q water. Control samples were kept in at -80 °C until analysis.
Initial concentration
The influence of initial thiol concentration was also tested using Lake Crochesummer water. The
water matrix was amended with thiol solutions for final concentrations of 10, 50 and 100 nM. Samples were stored at -20 °C for up to 12 days.
Materials and instruments
7-fluorobenzofurazan-4-sulfonic acid ammonium salt (SBD-F), TA, CYS-GLY, and GSH were purchased from Sigma-Aldrich (≥ 98%, except for CYS-GLY ≥ 85%). TCEP (98%), CYS (99.5%), methanesulfonic acid (MSA; 70%), sodium acetate, boric acid, EDTA, potassium hydroxide (KOH), acetic acid, and methanol (HPLC grade) were obtained from Fisher Scientific. All solutions were prepared using Milli-Q water (ultra-pure 18.2 MΩ cm filtered water, EMD Millipore). Glassware used for preparation was acid washed (45% HNO3; 5% HCl) overnight
then rinsed three times with Milli-Q water.
High performance liquid chromatography (HPLC) 1200 system (Agilent, Santa Clara, CA) equipped with a fluorescent detector (operating at 385 nm excitation and 515 nm emission) and an Agilent ZORBAX Eclipse Plus C18 column (4.6 mm × 100 mm × 3.5 µm) were used for 147 148 149 150 151 152 153 154 155 156 157 158 159 160 161 162 163 164 165 166 167 168 169
HPLC-fluorescence detection of thiols with acetate buffer (0.1 M, pH 5.0) and methanol as solvents. A Freezon 6 freeze-dry system (Labconco, Kansas City, MO) was used for pre-concentration experiments.
Thiol analyses
LMM thiol analytical protocol was based on the method used by Tang et al. (2000b) and modified by Zhang et al. (2004) where concentrations of total LMM thiols were measured in wetland interstitial water. This method uses TCEP as a reducing agent converting thiols from oxidized to reduced forms through cleavage of the disulfide bond. Total thiol concentrations including oxidized and reduced forms are measured. Briefly, 500 µL of samples were processed in chromatographic glass vials. Samples were buffered to pH 10.5 through the addition of 200 µL of potassium borate buffer (1 M boric acid, 0.02 mM EDTA, pH 10.5 adjusted with KOH). Reduction of thiols was then performed by adding 25 µL of 20 mM TCEP which reacted for 15 min at room temperature. Derivatization was then achieved by adding 100 µL of 2.1 mM SBD-F (1 g of SBD-F dissolved in 2 mL potassium borate buffer) followed by a 60 °C incubation in the dark for 1 h. After SBD-F derivatization, samples were stabilized with 100 µL of 1 M MSA. Derivatized samples were stored at 4 °C in the dark before HPLC analyses. After derivatization, thiol-SBD-F adducts remained stable for a period of two weeks when kept under conditions (results not shown), as previously reported by Tang et al. (2000b) and Hu et al. (2006).
Thiols were analyzed using HPLC-fluorescence where solvent A was acetate buffer and methanol was used as solvent B with a flow rate for the solvent pump of 1.0 mL min-1. The
composition of the gradient was: 10–15 min 0–20% B; 15–25 min, 20–100% B; 25–30 min, 100% B; 30–35 min, 100–0% B for a total run time of 40 min. All measurements were done in triplicate. Calibration curves were performed using spiked thiol solutions diluted in acetate 170 171 172 173 174 175 176 177 178 179 180 181 182 183 184 185 186 187 188 189 190 191 192
buffer (5 mM, pH 4.0, with 0.1 mM EDTA). The detection limit was defined as three times the standard deviation of 10 low concentration standards (< 5 nM) for every thiol species giving 1.1 nM for TA, 1.0 nM for CYS, 0.4 nM for CYS-GLY, and 1.0 nM GSH.
Thiol degradation rates
Degradation rates (kD) were calculated following the decreasing concentration of each
thiol over time of storage with kinetics of an apparent first-order reaction: ln[thiol]t = ln[thiol]0 - kD1 t (eq. 1)
where [thiol]0 is the initial thiol concentration of a single thiol species, [thiol]t is the
concentration after time t of storage, and kD1 is the rate constant of degradation of ln[thiol] over
time.
For the application of a correction factor to predict initial thiol concentrations, a second equation is proposed as the degradation curve rapidly reaches asymptotic plateau after few days. Degradation rates were calculated for longer storage periods following decreasing concentration of thiol over time where the two variables (thiol concentrations and time) underwent a natural logarithmic transformation:
ln[thiol]t = ln[thiol]0 - kD2ln[t + 1] (eq. 2)
where [thiol]0 is the initial thiol concentration, [thiol]t is the concentration after time t of storage,
and kD2 is the rate constant of degradation of ln[thiol] over ln[time + 1].
Statistical analyses
Statistical analyses were conducted with R software (R Core Team 2016). Treatment means were compared using analysis of variance (ANOVA) paired with post-hoc Tukey’s test and Kruskal-Wallis. Analysis of covariance (ANCOVA) was used to compare significant kD
193 194 195 196 197 198 199 200 201 202 203 204 205 206 207 208 209 210 211 212 213 214
slopes, with Bonferonni’s correction for multiple comparisons [anova(), aov(),TukeyHSD(), and kruskal.test() functions were used]. The lm() function was used for linear regressions to calculate kD and treatments were compared with Student’s t-test [t.test()].
Assessment
Effect of storage temperature on thiol degradation
A first preservation test was conducted at different storage temperatures using water from Lake Crochewinter amended with thiol solution. After 7 days, samples stored at -20 and 21 °C were
the most degraded (Fig. 1). Final concentrations represented 58 ± 6% and 69 ± 7% of initial TA concentrations, 54 ± 5% and 39 ± 41% of CYS, 100 ± 4% and 84 ± 13% of CYS-GLY, 94 ± 17% and 81 ± 23% of GSH for storage at -20 and 21 °C, respectively. Storage temperatures of -80 °C and 4 °C led to the best thiol preservation after 7 days (Fig. 1) with recoveries of 74 ± 5% and 75 ± 6% for TA, 93 ± 2% and 93 ± 3% for CYS, 100 ± 1% and 99 ± 2% for CYS-GLY, 99 ± 3% and 100 ± 3% for GSH, respectively.
Therefore, both -80 °C and 4 °C storage temperatures seem to maintain original levels of LMM thiols over medium to long term storage, and a temperature of -20 °C should be avoided. In the short term, a one-day storage at room temperature (i.e. 21 °C) may be adequate, but not for longer periods. After 7 days, concentrations of thiols at room temperature were lower and variations within replicates were high with relative standard deviation (standard deviation divided by mean) of 0.10 for TA, 1.08 for CYS, 0.16 for CYS-GLY, and 0.29 for GSH. Due to this variation, statistical tests applied to GSH data after 7 days of storage did not show significant differences between temperature treatments. Our results indicate that degradation varies between species, with CYS-GLY and GSH reaching nearly 100% recoveries for some temperatures, whereas approximately 25% of TA was lost during the 7 d timespan. Further, for CYS and TA, 215 216 217 218 219 220 221 222 223 224 225 226 227 228 229 230 231 232 233 234 235 236 237
storage temperatures of -20 and 21 °C are not adequate for a conservation period exceeding a few days.
A second temperature-dependent storage test was conducted to assess temperature effects under a longer storage period of 15 days. The test was undertaken at -80 °C (low degradation) and -20 °C (high degradation) using water from Lake Crochesummer and Milli-Q water as the
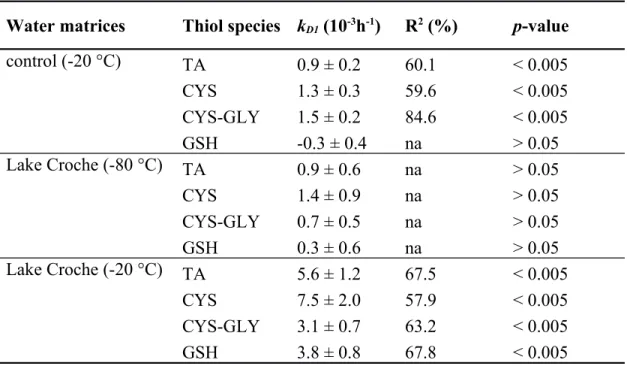
control matrix. After about 15 days of storage, concentration of thiols in Lake Croche water stored at -80 °C were the least affected with results similar to control (Fig. 2). Cysteine was the most degraded thiol species with loss of 24 ± 4%. No significant differences were found between -80 °C Lake Croche and control water kD1 (p > 0.05) for every thiol (Table 2). For Lake Croche
water kept at -20 °C, thiol concentrations decreased more rapidly, with final losses of 49 ± 3% for TA, 64 ± 2% for CYS, 39 ± 1% for CYS-GLY, and 41 ± 1% for GSH after 15 storage days (Fig. 2). Compared to the other treatments, the natural water matrix stored at -20 °C was significantly different (p < 0.05), with greater kD1 for every thiol species (Table 2).
An effect of temperature was observed on the preservation of LMM thiols with degradation rates up to 10 times lower in Lake Croche samples stored at -80 °C than samples stored at -20 °C for every studied thiol species. Similar observations have been reported by England and Wilkinson (2011) working on the preservation of phytochelatins, polypeptides composed of an elongation of GSH. They noted important phytochelatins degradation in storage at -20 °C, 1 °C, and room temperature. In both studies, the majority of thiol loss was occurring during the first few hours after storage and at a temperature of -20 °C. Overall, water samples must be stored at appropriate temperatures based on the expected time period before laboratory analyses. 238 239 240 241 242 243 244 245 246 247 248 249 250 251 252 253 254 255 256 257 258 259
Besides storage temperature effects, Fig. 2 and Table 2 show that intrinsic characteristics of the studied water matrix may also affect LMM thiol kD1. In fact, Milli-Q and Lake Croche
water samples have significantly different kD1 despite both being stored at -20 °C. This suggests
that water chemistry changes may impact degradation during storage.
Thiol degradation in different water matrices
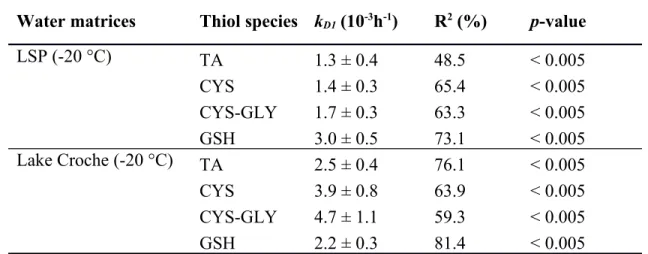
To compare the effect of water matrix chemistry on thiol degradation, experiments were conducted on LSP and Lake Croche samples stored at -20 °C to measure the greatest loss and to maximize differences between water matrices and thiol species. A rapid degradation of thiols occurred in LSP water after the first 6 days of storage (Fig. 3a); then concentrations tended to stabilise until the end of the experiment. Glutathione was the thiol species which was most rapidly degraded, followed by CYS-GLY, CYS, and TA to a lesser extent (Table 3). After 6 days of storage, GSH lost 39 ± 5% of its initial concentration (Fig. 3a) and ended with a loss of 49 ± 4% after 52 days of storage (results not shown). Water from LSP displayed losses of 17 ± 7%, 14 ± 6% and 25 ± 5% of the initial concentrations for TA, CYS, and CYS-GLY respectively, after 6 days of storage (Fig. 3a). At the end of the 52 days, losses were of 27 ± 8%, 28 ± 8%, and 36 ± 4% for TA, CYS, and CYS-GLY, respectively (results not shown).
The degradation trends in Lake Croche water were different: CYS and CYS-GLY were the most degraded thiols and GSH was the least affected (Fig. 3b). As in LSP water, the largest thiol losses occurred in the first 6 days, followed by a slower decrease until the end of experiment. After 52 days, TA, CYS, CYS-GLY, and GSH lost respectively 38 ± 5%, 58 ± 2%, 66 ± 1%, and 32 ± 1% of their initial concentrations (results not shown). Degradation rates were 260 261 262 263 264 265 266 267 268 269 270 271 272 273 274 275 276 277 278 279 280 281
significantly (p < 0.05) higher in Lake Croche than LSP water for CYS and CYS-GLY, but not for GSH and TA.
Water matrix composition may therefore impact both thiol degradation rates and the sensitivity of different thiol species to degradation, as shown in this experiment where GSH was the least affected by degradation in Lake Croche water and the most sensitive in LSP water. Furthermore, kD1 from experiments conducted with Lake Croche water (Table 2 and 3) from two
sampling campaigns were not the same, neither were relative concentrations after a given time period (Fig. 1 and 2) for most thiols. For instance, CYS-GLY preserved at -20°C was degraded about 30% faster in samples collected from Lake Croche in summer (Fig. 2) than in winter (Fig. 1) after 7 days of storage. These temporal variations in kD1 could be related to changes in the
organic ligand pool and future works on water chemistry effects on thiol degradation are necessary.
To better understand degradation processes during storage, it is therefore important to consider the chemical composition of water samples. Our results indicate that thiol degradation during storage in a given sample cannot be corrected by using degradation results from another sampling site.
Production of thiols through GSH degradation
Since some thiols are substrates of others, at least for those involved in the biosynthesis of GSH, it is likely that their degradation leads to the formation of smaller peptides. The degradation of GSH as a potential source for other thiol species was investigated using LSP and Lake Croche water amended with a 100 nM GSH solution and stored at -20 °C for several days. Glutathione concentration dropped rapidly in the first 6 days of storage for both water matrices (Fig. 4), with a kD1 of (4.5 ± 1.2) × 10-3 h-1 (R2 = 53.1%, p < 0.005) and (3.7 ± 0.9) × 10-3 h-1 (R2 =
282 283 284 285 286 287 288 289 290 291 292 293 294 295 296 297 298 299 300 301 302 303 304
59.0%, p < 0.005) for LSP and Lake Croche, respectively. After 24 hours of storage, a net increase of 2.8 ± 0.6 nM for CYS and of 3.6 ± 0.6 nM for CYS-GLY was observed in LSP water while TA concentrations stayed under the detection limit (Fig. 4a). Similar increases of CYS and CYS-GLY were not observed for Lake Croche water (Fig. 4b). Thus, the degradation of GSH (formed of CYS, glycine and glutamate) may lead to formation of CYS-GLY, CYS or glutamyl-L-cysteine, three LMM thiols commonly reported in the aquatic environment. Detected concentrations were low and increased only after the first day of storage, overlapping the period of greatest GSH loss. It was expected to find a conserved thiol pool, where the sum of CYS, CYS-GLY and GSH concentrations would be nearly equivalent to GSH concentration initially measured at t0, however this was not the case. Increases of CYS and CYS-GLY were much
smaller than losses of GSH, implying either that most of the GSH was degraded into other undetected compounds or that CYS and CYS-GLY are subject to constant degradation during storage. An exhaustive monitoring of the sulfur balance in future studies is necessary in order to confirm these cascading degradation processes involving LMM thiols or other molecules in preserved water samples.
Thus, observation of smaller thiols in water samples collected from field studies may originate from the degradation of larger peptides during sample storage rather than their actual presence in the environment, even if their low concentrations suggest they can often be ignored.
Effect of oxygen purging
Despite yielding lower kD1 than natural water matrices, Milli-Q water samples still
displayed substantial thiol losses (Fig. 2). These losses could come from interactions between thiols and oxygen species, a likely explanation in a control water matrix which is free of potential catalytic ligands or proteins. The effect of oxygen stripping by argon bubbling before 305 306 307 308 309 310 311 312 313 314 315 316 317 318 319 320 321 322 323 324 325 326 327
storage was investigated on Lake Crochewinter samples which were then stored at -20 °C for 7
days. No significant difference (p > 0.05) on thiol recovery was observed between purged and argon-free controls for all thiol species (Fig. 5). As previously observed (Fig. 1), CYS-GLY did not suffer of significant degradation after 7 days of storage contrary to TA, CYS, and GSH for both treatments (Fig. 5). Neither the portion of degraded, reduced, or oxidized thiols was significantly different from one treatment to another (p > 0.05).
Simple purging does not seem to be necessary or adequate for thiol analysis in natural water from oxic zones as it does not prevent thiol loss. Further research could be conducted on the effect of oxygen purging on reactive oxygen species known to interact with thiols in sunlit portions of the water column.
Differences between k
Dused
So far the calculated kD were derived from slopes obtained by the linear regression of
thiol concentration with a natural logarithmic transformation over time (apparent first-order reaction), for the first days of storage (kD1). For a longer period of storage, for samples stored 52
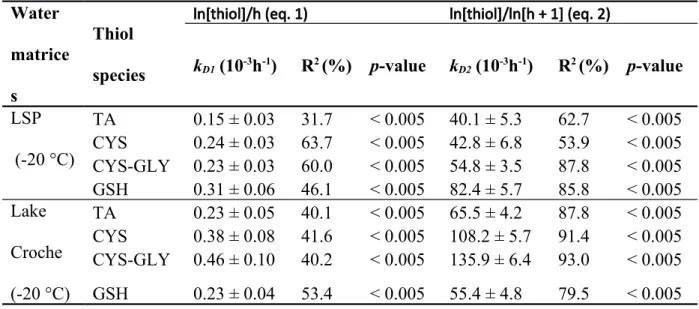
days for instance, curve fitting using first-order kinetics was less successful in modeling thiol degradation. Another set of regressions was applied using thiol concentrations plotted over time where both y- and x-axis values were expressed on a natural logarithmic form to calculate a second degradation rate value (kD2) for longer storage. As shown in Table 4, slopes R2 are always
higher for the determination of kD2, except for CYS in LSP where kD1 slope R2 had a better fit.
Moreover, kD1 in Table 4 tend to be smaller than those previously calculated for shorter
time intervals (Table 3), and would lead to an underestimation of the initial thiol concentrations by the application of the correction factor, as the intercept of the regression was lower. 328 329 330 331 332 333 334 335 336 337 338 339 340 341 342 343 344 345 346 347 348 349
Therefore, kD1 should be used for short period of storage not exceeding a week and kD2 should be
advocated for longer period for a better match.
In order to validate this correction method, half of samples were randomly taken from the 52-d experiment for the determination of kD2 from Lake Croche and LSP matrices. The other half
was used for the prediction of t0 concentrations using eq. 2. This was repeated ten times through
random permutation. The means of the initial concentrations calculated this way approached 100% of the concentrations (t0) measured immediately after the addition of thiols solution in
water matrices (i.e. 99 ± 4% for TA, 97 ± 5% for CYS, 94 ± 6% for CYS-GLY, and 102 ± 4% for GSH in the lake Croche matrix, and 99 ± 8% for TA, 106 ± 10% for CYS, 99 ± 9 for CYS-GLY, and 97 ± 12% for GSH in LSP). These corrected concentrations are therefore more indicative of the actual initial ones than uncorrected values of degraded samples which represented as low as 44 ± 1% of t0 after 52 days of storage at -20 °C in Lake Croche matrix.
Effect of thiol concentrations on degradation
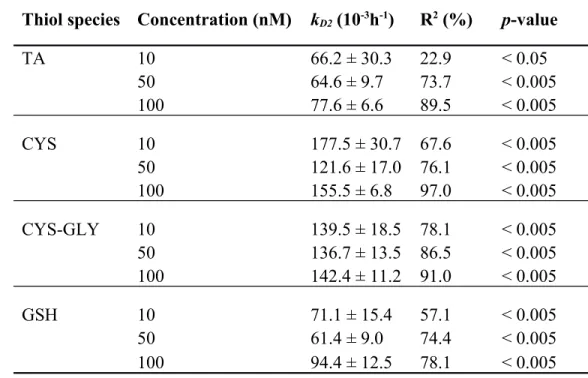
Thiol solutions of 10, 50 and 100 nM were added to Lake Croche water and stored at -20 °C to assess if thiol degradation was a function of initial thiol concentrations. To compare the different treatments, thiol concentrations were measured as a ratio of the initial concentrations and thiol kD2 were calculated. All thiol degradation slopes were significant (Table 5; p > 0.05).
For the three concentration levels, no significant differences (p > 0.05) were found between kD2
for each of the four thiol species based on an analysis of covariance.
Overall, these results indicate that thiol degradation during storage is not a function of initial thiol concentrations and therefore it confirms the possibility to apply a correction factor to a given sample after calculating the kD2 of the associated water matrix.
350 351 352 353 354 355 356 357 358 359 360 361 362 363 364 365 366 367 368 369 370 371
Effect of freeze-drying on thiol concentrations
Dissolved LMM thiols in natural aquatic environments are typically found at low concentrations. In order to better detect these low concentrations, a pre-concentration step using freeze-drying was suggested by Zhang et al. (2004). We tested the impact of such method on Lake Crochewinter water amended with thiol solution using different sample volumes (1.5 and 30
mL). Thiols seemed to be differently affected depending on the species and the sample volume considered. The most affected species were CYS and CYS-GLY, with concentrations dropping significantly in both volumes tested (p < 0.05, up to 65 ± 2% for CYS) compared to controls while TA loss were insignificant (Fig. 6). GSH concentrations were not different (p > 0.05) from controls in 1.5 mL tubes but suffered significant loss in 30 mL HDPE bottle (p < 0.05, 45 ± 2%, Fig. 6). Concentrations measured in 30 mL freeze-dried HDPE bottles tend to be lower than those in 1.5 mL microcentrifuge tubes for every thiol species tested. These gaps between both methods may either come from the required time for complete drying (i.e. 6 hours for microtubes and 48 hours for HDPE bottles), from the sealing technique (where microcentrifuge tube caps were pierced with three small holes and HDPE bottles were simply covered with a light tissue), or from a larger adsorption’s surface area of the containers. In any case, recovery yields from microtubes were higher.
From these results it is possible to conclude that freeze-drying is an adequate pre-concentration method for some thiols (TA and GSH) when performed on small volumes in microcentrifuge tubes but measurements of others (CYS and CYS-GLY) should be interpreted with care, since freeze-drying could lead to an underestimation.
372 373 374 375 376 377 378 379 380 381 382 383 384 385 386 387 388 389 390 391 392 393
Discussion
Storage and handling for thiol conservation
In this study, differences observed in thiol degradation rates clearly indicate an effect of temperature on the preservation of LMM thiols, as previously reported for phytochelatins (England and Wilkinson 2011). These authors proposed that ice formation could have led to increased degradation at -20°C. However, our experimental design included lower temperatures and samples stored at -80 °C showed no significant differences with 4 °C storage, as both temperatures resulted in the lowest observed degradation. It is possible that thiol degradation at -20°C is related to the slow rate of ice formation and/or to the structure of ice crystals, a problem avoided through faster solidification at -80 °C. Thing et al. (2010) observed loss of tocionic acid, a hexapeptide (cyclo-S-Cys-Tyr-Ile-Gln-Asn-Cys-(S)), occurring with freezing and storage. These authors suggested adsorption to the ice surface as a justification for molecule changes, allowing hydrophobic or hydrogen-bonding interactions. In the case of this study, to test whether the observed degradation of TA and CYS can be avoided or reduced, colder temperatures of storage and flash freeze technique could be tested in future studies using liquid nitrogen for instance. Thiol degradation observed for stored natural samples could be attributed to the chemical interaction of thiols with compounds present in the water matrix. However, degradation was shown to be limited with storage temperature of -80 and 4 °C, where thiol concentrations in natural water matrix were closer to the initial levels.
Purging of oxygen from water samples had no significant effect on thiol preservation. These results are consistent with those reported by Simmons et al. (2009), working on algal extracts. These authors similarly observed that oxygen stripping had no effect on GSH 394 395 396 397 398 399 400 401 402 403 404 405 406 407 408 409 410 411 412 413 414 415
concentrations, although they reported a positive effect for phytochelatin preservation over 7 hours. Another study used N2 on sediment and pore water samples to prevent thiol oxidation
(Liem-Nguyen et al. 2015). Sediments and pore waters are two compartments which are often hypoxic and should be handled with special care, compared to samples from the upper water column. More stringent oxygen stripping protocols such as the use of a glove box filled with N2
could be tested and may have an impact on preservation. However, such protocols are not easily implemented under field conditions.
Finally, as previously reported by a few studies (Zhang et al. 2004; Hu et al. 2006; Liem-Nguyen et al. 2015), dissolved LMM thiols are found at low concentration levels in freshwater environment and pre-concentration process may be necessary for accurate detection (Zhang et al. 2004). Effects of freeze-drying were observed over some thiol concentrations with greatest degradation for CYS and CYS-GLY. Similar observations were made for tocionic acid where it was completely consumed during lyophilisation with most of the loss occurring in the initial freezing step (Zhang et al. 2009). Therefore, using freeze-drying techniques to concentrate natural samples can lead to an underestimation of the actual environmental concentrations and this should be taken into account especially for concentrations near the analytical detection limit. Optimization and improvement of detection techniques should be considered before resorting to using pre-concentration techniques.
Water matrix effects on thiol degradation
Overall, the comparison of LSP and Lake Croche water indicates that degradation did not occur at the same rate in the two matrices, varying with the thiol species and the water matrix used. For instance, GSH kD1 was greater in LSP than Lake Croche water. Differences in the water
chemistry such as pH, sulfur-containing molecules, dissolved organic carbon levels and 416 417 418 419 420 421 422 423 424 425 426 427 428 429 430 431 432 433 434 435 436 437 438
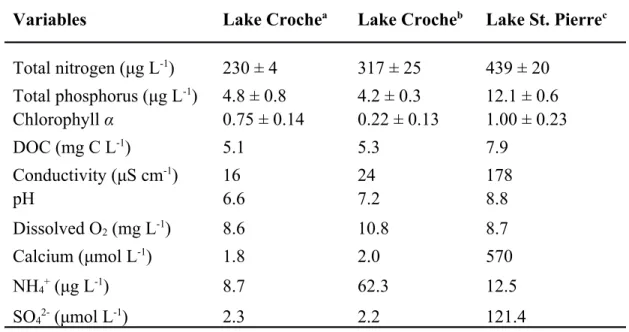
composition could explain these differences. The most notable differences between both sampled waters (LSP and Lake Crochesummer respectively) were pH (8.8 and 6.6), calcium (570.0 and 1.8
μmol L-1), SO
42- (121.4 and 2.3 μmol L-1), with higher general indications of eutrophication for
LSP. It has been reported that the presence of organic ligands may induce GSH degradation through the production of reactive oxygen species (Kawakami et al. 2006a; Latch and McNeill 2006). Trace metals, such as copper and nickel, can also promote the degradation of GSH through oxidation whereas for other metals such as mercury, the formation of metal-GSH complex can prevent such loss (Krezel et al. 2003; Moingt et al. 2010). Moreover, although the water samples were pre-filtered through 0.45 µm membranes, the action of catalytic enzymes remaining in solution could be causing degradation (Rellan-Alvarez et al. 2006). In this regard LSP water would be more likely to induce thiol degradation which may explain kD1 differences
with Lake Croche matrices.
On the other hand, degradation rates observed for CYS and CYS-GLY are lower in LSP than Lake Croche water, whereas the opposite is observed for GSH. Since CYS and CYS-GLY are GSH degradation by-products, it is likely that degradation of GSH acts as a source for these thiol species. This hypothesis could explain lower concentrations of CYS and CYS-GLY measured in Lake Croche water considering the lower degradation of GSH as a source of these by-products. However, an exhaustive monitoring of the sulfur-containing molecules was not carried out in the current study. Such studies are still needed, especially in natural environments, to enhance our understanding of the thiol cycle in the dissolved phase. Nevertheless, our results indicate that degradation of GSH should not induce high CYS and CYS-GLY production and that storage of natural samples under suitable conditions should not lead to significant over-estimation of these by-product thiols.
439 440 441 442 443 444 445 446 447 448 449 450 451 452 453 454 455 456 457 458 459 460 461
Correction of thiol levels using k
DDegradation rates of the four LMM thiol species were not significantly different for all tested concentrations (10 to 100 nM) in a given water matrix. Hence, thiol kD from storage of
samples from a given site would be the same, for a specific thiol species, independently of its initial concentration. In this regard, from a practical point of view, a correction factor could be applied regardless of the initial concentration for thiol undergoing storage degradation over time. Predicted concentrations could therefore be improved using site-specific preservation tests and pseudo first-order kinetics (kD1; eq. 1). In the case of longer storage period, beyond a week, kD2
should be calculated instead of kD1 and eq. 2 should be used to apply a correction factor in order
to predict initial thiol concentrations. However, as the present study has demonstrated, thiol degradation is a complex process. The use of such correction factors requires considerable effort in laboratory after sampling and should be interpreted with caution as the rates of degradation seem to be sensitive to subtle changes in the chemistry of the water matrix. Significant changes were observed between kD for the same site sampled in different seasons and years. Therefore,
calculated kD are site-specific and will fluctuate through time indicating the precariousness of
such correction method.
Comments and recommendations
As thiols are sensitive to oxidation and degradation processes, samples should be analyzed as soon as possible after sampling. Analysis of dissolved LMM thiols using sampling methods requiring long storage periods should be performed with caution. If rapid analysis is not possible, the derivatization steps (e.g. using SBD-F and MSA) should be performed on the field and samples should be properly stored for a period of less than two weeks. If such required 462 463 464 465 466 467 468 469 470 471 472 473 474 475 476 477 478 479 480 481 482 483
caution is not possible, in remote areas for instance, suitable storage conditions should be applied for any delays of more than 24 hours after sampling. Although some species of thiol seem to be less sensitive to temperature, deep-freezing at -80 °C or storage at 4 °C is recommended as it has shown the best preservation yields with lesser variability over time for every thiol tested. Furthermore, -20 °C storage should always be avoided for both short and long-term storage. As a last resort, thiol samples that underwent degradation can be corrected with the calculation of a correction factor. However, these corrected values must be considered with care given the complexity of degradation processes which are site-specific and will vary through time. The approach to be recommended remains a proper storage and rapid analysis of samples in optimized conditions Finally, emphasis should be placed on attaining better detection limits before using pre-concentration methods such as freeze-drying for low-level thiol samples.
484 485 486 487 488 489 490 491 492 493 494 495
References and Citations
Ahner, B. A., L. Wei, J. R. Oleson, and N. Ogura. 2002. Glutathione and other low molecular weight thiols in marine phytoplankton under metal stress. Mar. Ecol. Prog. Ser. 232: 93-103. doi: 10.3354/meps232093
Andreae, M. O., and W. A. Jaeschke. 1992. Exchange of Sulphur between Biosphere and
Atmosphere over Temperate and Tropical Regions, p. 27-61. In R. W. Howarth, J. W. B. Stewart and M. V. Ivanov [eds.], Sulphur Cycling on the Continents: Wetlands,
Terrestrial Ecosystems and Associated Water Bodies. Wiley.
Dupont, C. L., and B. A. Ahner. 2005. Effects of copper, cadmium, and zinc on the production and exudation of thiols by Emiliania huxleyi. Limnol. Oceanogr. 50: 508-515. doi: 10.4319/lo.2005.50.2.0508
Dupont, C. L., J. W. Moffett, R. R. Bidigare, and B. A. Ahner. 2006. Distributions of dissolved and particulate biogenic thiols in the subartic Pacific Ocean. Deep Sea Res., Part I 53: 1961-1974. doi: 10.1016/j.dsr.2006.09.003
England, R., and K. J. Wilkinson. 2011. Determination of phytochelatins in algal samples using LC-MS. Int. J. Environ. Anal. Chem. 91: 185-196. doi: 10.1080/03067319.2010.491913 Fahey, R. C. 2001. Novel thiols of prokaryotes. Annu. Rev. Microbiol. 55: 333-356. doi:
10.1146/annurev.micro.55.1.333
Forlano, P., J. A. Olabe, J. F. Magallanes, and M. A. Blesa. 1997. The mechanism of oxidation of 3-mercaptopropionic acid. Can. J. Chem. 75: 9-13. doi: 10.1139/v97-002
Hsu-Kim, H. 2007. Stability of metal-glutathione complexes during oxidation by hydrogen peroxide and Cu(II)-catalysis. Environ. Sci. Technol. 41: 2338-2342. doi:
10.1021/es062269+ 496 497 498 499 500 501 502 503 504 505 506 507 508 509 510 511 512 513 514 515 516 517 518
Hsu-Kim, H., K. H. Kucharzyk, T. Zhang, and M. A. Deshusses. 2013. Mechanisms regulating mercury bioavailability for methylating microorganisms in the aquatic environment: a critical review. Environ. Sci. Technol. 47: 2441-2456. doi: 10.1021/es304370g
Hu, H., S. E. Mylon, and G. Benoit. 2006. Distribution of the thiols glutathione and
3-mercaptopropionic acid in Connecticut lakes. Limnol. Oceanogr. 51: 2763-2774. doi: 10.4319/lo.2006.51.6.2763
Kawakami, S. K., M. Gledhill, and E. Achterberg. 2006a. Determination of phytochelatins and glutathione in phytoplankton from natural waters using HPLC with fluorescence detection. TrAC, Trends Anal. Chem. 25: 133-142. doi: 10.1016/j.trac.2005.06.005 Kawakami, S. K., M. Gledhill, and E. P. Achterberg. 2006b. Effects of metal combinations on
the production of phytochelatins and glutathione by the marine diatom Phaeodactylum tricornutum. BioMetals 19: 51-60. doi: 10.1007/s10534-005-5115-6
Krezel, A., W. Szczepanik, M. Sokolowska, M. Jezowska-Bojczuk, and W. Bal. 2003.
Correlations between complexation modes and redox activities of Ni(II)-GSH complexes. Chem. Res. Toxicol. 16: 855-864. doi: 10.1021/tx034012k
Laglera, L. M., J. Downes, A. Tovar-Sanchez, and D. Monticelli. 2014. Cathodic
pseudopolarography: a new tool for the identification and quantification of cysteine, cystine and other low molecular weight thiols in seawater. Anal. Chim. Acta 836: 24-33. doi: 10.1016/j.aca.2014.05.026
Laglera, L. M., and C. M. G. van den Berg. 2006. Photochemical oxidation of thiols and copper complexing ligands in estuarine waters. Mar. Chem. 101: 130-140. doi:
10.1016/j.marchem.2006.01.006 519 520 521 522 523 524 525 526 527 528 529 530 531 532 533 534 535 536 537 538 539 540
Latch, D. E., and K. McNeill. 2006. Microheterogeneity of singlet oxygen distributions in irradiated humic acid solutions. Science 311: 1743-1747. doi: 10.1126/science.1121636 Leal, M. F. C., M. T. S. D. Vasconcelos, and C. M. G. van den Berg. 1999. Copper-induced
release of complexing ligands similar to thiols by Emiliania huxleyi in seawater cultures. Limnol. Oceanogr. 44: 1750-1762. doi: 10.4319/lo.1999.44.7.1750
Liem-Nguyen, V., S. Bouchet, and E. Bjorn. 2015. Determination of sub-nanomolar levels of low molecular mass thiols in natural waters by liquid chromatography tandem mass spectrometry after derivatization with p-(hydroxymercuri) benzoate and online preconcentration. Anal. Chem. 87: 1089-1096. doi: 10.1021/ac503679y
Lobo, G.-A. M. and others 2007. Determination of total reduced thiol levels in plasma using a bromide substituted quinone. Electroanalysis 19: 2523-2528. doi:
10.1002/elan.200703977
Manceau, A. and others 2015. Formation of mercury sulfide from Hg(II)-thiolate complexes in natural organic matter. Environ. Sci. Technol. 49: 9787-9796. doi:
10.1021/acs.est.5b02522
Moingt, M., M. Bressac, D. Belanger, and M. Amyot. 2010. Role of ultra-violet radiation, mercury and copper on the stability of dissolved glutathione in natural and artificial freshwater and saltwater. Chemosphere 80: 1314-1320. doi:
10.1016/j.chemosphere.2010.06.041
Noctor, G., and C. H. Foyer. 1998. Ascorbate and glutathione: keeping active oxygen under control. Annu. Rev. Plant Physiol. Plant Mol. Biol. 49: 249-279. doi:
10.1146/annurev.arplant.49.1.249 541 542 543 544 545 546 547 548 549 550 551 552 553 554 555 556 557 558 559 560 561 562
Pohlabeln, A. M., and T. Dittmar. 2015. Novel insights into the molecular structure of non-volatile marine dissolved organic sulfur. Mar. Chem. 168: 86-94. doi:
10.1016/j.marchem.2014.10.018
R Core Team. 2016. R: A language and environment for statistical computing. R Foundation for Statistical Computing, Vienna, Austria.
Rellan-Alvarez, R., L. E. Hernandez, J. Abadia, and A. Alvarez-Fernandez. 2006. Direct and simultaneous determination of reduced and oxidized glutathione and homoglutathione by liquid chromatography-electrospray/mass spectrometry in plant tissue extracts. Anal. Biochem. 356: 254-264. doi: 10.1016/j.ab.2006.05.032
Rijstenbil, J. W., and J. A. Wijnholds. 1996. HPLC analysis of nonprotein thiols in planktonic diatoms: pool size, redox state and response to copper and cadmium exposure. Mar. Biol.
127: 45-54. doi: 10.1007/bf00993642
Si, L., and P. A. Ariya. 2015. Photochemical reactions of divalent mercury with thioglycolic acid: formation of mercuric sulfide particles. Chemosphere 119: 467-472. doi: 10.1016/j.chemosphere.2014.07.022
Simmons, D. B., A. R. Hayward, T. C. Hutchinson, and R. J. Emery. 2009. Identification and quantification of glutathione and phytochelatins from Chlorella vulgaris by RP-HPLC ESI-MS/MS and oxygen-free extraction. Anal. Bioanal. Chem. 395: 809-817. doi: 10.1007/s00216-009-3016-1
Smith, D. S., R. A. Bell, and J. R. Kramer. 2002. Metal speciation in natural waters with emphasis on reduced sulfur groups as strong metal binding sites. Comp. Biochem. Physiol., Part C: Toxicol. Pharmacol. 133: 65-74. doi: 10.1016/s1532-0456(02)00108-4 563 564 565 566 567 568 569 570 571 572 573 574 575 576 577 578 579 580 581 582 583 584
Swarr, G. J., T. Kading, C. H. Lamborg, C. R. Hammerschmidt, and K. L. Bowman. 2016. Dissolved low-molecular weight thiol concentrations from the U.S. GEOTRACES North Atlantic Ocean zonal transect. Deep Sea Res., Part I 116: 77-87. doi:
10.1016/j.dsr.2016.06.003
Szczuka, A., F. M. M. Morel, and J. K. Schaefer. 2015. Effect of thiols, zinc, and redox conditions on Hg uptake in Shewanella oneidensis. Environ. Sci. Technol. 49: 7432-7438. doi: 10.1021/acs.est.5b00676
Tang, D., C.-C. Hung, K. W. Warnken, and P. H. Santschi. 2000a. The distribution of biogenic thiols in surface waters of Galveston Bay. Limnol. Oceanogr. 45: 1289-1297. doi: 10.4319/lo.2000.45.6.1289
Tang, D., L.-S. Wen, and P. H. Santschi. 2000b. Analysis of biogenic thiols in natural water samples by high-performance liquid chromatographic separation and fluorescence detection with ammonium 7-fluorobenzo-2-oxa-1,3-diazole-4-sulfonate (SBD-F). Anal. Chim. Acta 408: 299-307. doi: 10.1016/s0003-2670(99)00880-6
Thing, M., J. Zhang, J. Laurence, and E. M. Topp. 2010. Thiol-disulfide interchange in the tocinoic acid/glutathione system during freezing and drying. J. Pharm. Sci. 99: 4849-4856. doi: 10.1002/jps.22206
Walsh, M. J., S. D. Goodnow, G. E. Vezeau, L. V. Richter, and B. A. Ahner. 2015. Cysteine enhances bioavailability of copper to marine phytoplankton. Environ. Sci. Technol. 49: 12145-12152. doi: 10.1021/acs.est.5b02112
Winterbourn, C. C., and D. Metodiewa. 1999. Reactivity of biologically important thiol
compounds with superoxide and hydrogen peroxide. Free Radic. Biol. Med. 27: 322-328. doi: 585 586 587 588 589 590 591 592 593 594 595 596 597 598 599 600 601 602 603 604 605 606 607
Zhang, J., F. Wang, J. D. House, and B. Page. 2004. Thiols in wetland interstitial waters and their role in mercury and methylmercury speciation. Limnol. Oceanogr. 49: 2276-2286. doi: 10.4319/lo.2004.49.6.2276
Zhang, L., T. D. Williams, and E. M. Topp. 2009. Reversibility and regioselectivity in thiol/disulfide interchange of tocinoic acid with glutathione in lyophilized solids. J. Pharm. Sci. 98: 3312-3318. doi: 10.1002/jps.21516
Zheng, W., H. Lin, B. F. Mann, L. Liang, and B. Gu. 2013. Oxidation of dissolved elemental mercury by thiol compounds under anoxic conditions. Environ. Sci. Technol. 47: 12827-12834. doi: 10.1021/es402697u 608 609 610 611 612 613 614 615 616 617 618
Acknowledgment
We would like to thank the Groupe de Recherche Interuniversitaire en Limnologie et en environnement aquatique (GRIL) for the sharing of environmental data. This project was financially supported by NSERC Discovery and ISI-FRQ-NT grants to MA and DP. MA acknowledges support from the Canada Research Chair program. ML received scholarships from the FRQ-NT/GRIL strategic network. We acknowledge laboratory assistance from Dominic Bélanger, sampling assistance from Valérie René, Stéphanie Massé and Mélissa Khadra, comments and corrections on the manuscript by Gwyneth MacMillan. We thank the staff of Station de biologie des Laurentides (U. de Montréal) for housing and equipment.
619 620 621 622 623 624 625 626 627
Figure legends
Fig. 1. Thiol concentrations in Lake Croche water spiked with 100 nM thiol solutions shown as a
percentage of initial concentration (t0, grey bars) after 1 and 7 days of storage at -80 °C (orange),
-20 °C (blue), 4 °C (yellow), or 21 °C (green) for a) TA, b) CYS, c) CYS-GLY, and d) GSH. Bars are averaged values from triplicate, error bars represent standard deviation and asterisks values significantly different from t0 (p < 0.05).
Fig. 2. Thiol concentrations in Lake Croche (-80 °C storage in orange, -20 °C storage in blue)
and control water (-20 °C storage in white) spiked with 100 nM thiol solutions shown as a percentage of initial concentration (t0) over time, where points are averaged values from triplicate
and error bars represent standard deviation.
Fig. 3. Natural logarithm of thiol concentrations (nM) over time and kD1 slopes (all significant; p
< 0.05) from a) LSP and b) Lake Croche water matrices. Where TA (orange circles), CYS (yellow scares), CYS-GLY (blue triangles), and GSH (green circles) are shown as averaged values from triplicate and error bars represent standard deviation.
Fig. 4. Thiol concentrations (nM) plotted over storage time from a) LSP and b) Lake Croche
water, where TA (orange circles), CYS (yellow scares), CYS-GLY (blue triangles), and GSH (green circles) are shown as averaged values from triplicate and error bars represent standard deviation. Insets: the first 4 days of storage for TA, CYS, and CYS-GLY concentrations.
Fig. 5. Oxidized (orange), reduced (blue) and degraded (white) thiol concentrations in Lake
Croche water shown as a percentage of initial (t0) total thiol concentrations after 7 days of
storage at -20 °C. Samples were purged with argon (Ar) or left in presence of ambient air (O2)
and stacked bars are averaged values from triplicate. 628 629 630 631 632 633 634 635 636 637 638 639 640 641 642 643 644 645 646 647 648 649
Fig. 6. Percentages of initial thiol concentrations after freeze-drying treatment using 1.5 mL
microcentrifuge tubes (black bars) and 30 mL HDPE bottles (white bars). Bars are averaged values from triplicate, error bars represent standard deviation and lowercase letters indicate significant differences for each thiol between volumes tested (p < 0.05).
650 651 652 653 654 655
Tables
Table 1. Water chemistry of the natural water matrices.
Variables Lake Crochea Lake Crocheb Lake St. Pierrec Total nitrogen (μg L-1) 230 ± 4 317 ± 25 439 ± 20 Total phosphorus (μg L-1) 4.8 ± 0.8 4.2 ± 0.3 12.1 ± 0.6 Chlorophyll α 0.75 ± 0.14 0.22 ± 0.13 1.00 ± 0.23 DOC (mg C L-1) 5.1 5.3 7.9 Conductivity (μS cm-1) 16 24 178 pH 6.6 7.2 8.8 Dissolved O2 (mg L-1) 8.6 10.8 8.7 Calcium (μmol L-1) 1.8 2.0 570 NH4+ (μg L-1) 8.7 62.3 12.5 SO42- (μmol L-1) 2.3 2.2 121.4
a: Water sampled at 1 m depth near shore in summer
b: Water sampled at 1 m depth at the deepest point of the lake in winter
c: Water sampled at 1 m depth near shore and agricultural tributaries in summer
656 657 658 659 660 661
Table 2. Thiol degradation rate constants (kD1; Means ± Standard error) for control and Lake
Croche water matrices stored at different temperatures with slope R2 and p-values after 4 days of
storage.
Water matrices Thiol species kD1 (10-3h-1) R2 (%) p-value
control (-20 °C) TA 0.9 ± 0.2 60.1 < 0.005 CYS 1.3 ± 0.3 59.6 < 0.005 CYS-GLY 1.5 ± 0.2 84.6 < 0.005 GSH -0.3 ± 0.4 na > 0.05 Lake Croche (-80 °C) TA 0.9 ± 0.6 na > 0.05 CYS 1.4 ± 0.9 na > 0.05 CYS-GLY 0.7 ± 0.5 na > 0.05 GSH 0.3 ± 0.6 na > 0.05 Lake Croche (-20 °C) TA 5.6 ± 1.2 67.5 < 0.005 CYS 7.5 ± 2.0 57.9 < 0.005 CYS-GLY 3.1 ± 0.7 63.2 < 0.005 GSH 3.8 ± 0.8 67.8 < 0.005 662 663 664 665 666
Table 3. Thiol degradation rate constants (kD1; Means ± Standard error) for LSP and Lake
Croche water matrices stored at -20 °C with slope R2 and p-values after 6 days of storage.
Water matrices Thiol species kD1 (10-3h-1) R2 (%) p-value
LSP (-20 °C) TA 1.3 ± 0.4 48.5 < 0.005 CYS 1.4 ± 0.3 65.4 < 0.005 CYS-GLY 1.7 ± 0.3 63.3 < 0.005 GSH 3.0 ± 0.5 73.1 < 0.005 Lake Croche (-20 °C) TA 2.5 ± 0.4 76.1 < 0.005 CYS 3.9 ± 0.8 63.9 < 0.005 CYS-GLY 4.7 ± 1.1 59.3 < 0.005 GSH 2.2 ± 0.3 81.4 < 0.005 667 668 669 670
Table 4. Thiol degradation rate constants (kD1 and kD2; Means ± Standard error) with slope R2
and p-values for Lake Croche and Lake St. Pierre matrix after 52 days of storage using different value transformations for kD calculation.
Water matrice s
Thiol species
ln[thiol]/h (eq. 1) ln[thiol]/ln[h + 1] (eq. 2)
kD1 (10-3h-1) R2 (%) p-value kD2 (10-3h-1) R2 (%) p-value LSP (-20 °C) TA 0.15 ± 0.03 31.7 < 0.005 40.1 ± 5.3 62.7 < 0.005 CYS 0.24 ± 0.03 63.7 < 0.005 42.8 ± 6.8 53.9 < 0.005 CYS-GLY 0.23 ± 0.03 60.0 < 0.005 54.8 ± 3.5 87.8 < 0.005 GSH 0.31 ± 0.06 46.1 < 0.005 82.4 ± 5.7 85.8 < 0.005 Lake Croche (-20 °C) TA 0.23 ± 0.05 40.1 < 0.005 65.5 ± 4.2 87.8 < 0.005 CYS 0.38 ± 0.08 41.6 < 0.005 108.2 ± 5.7 91.4 < 0.005 CYS-GLY 0.46 ± 0.10 40.2 < 0.005 135.9 ± 6.4 93.0 < 0.005 GSH 0.23 ± 0.04 53.4 < 0.005 55.4 ± 4.8 79.5 < 0.005 671 672 673 674 675
Table 5. Thiol degradation rate constants (kD2; Means ± Standard error) with slope R2 and
p-values for Lake Croche water matrix initially amended with thiol solutions of 10, 50 and 100 nM after 12 days of storage.
Thiol species Concentration (nM) kD2 (10-3h-1) R2 (%) p-value
TA 10 66.2 ± 30.3 22.9 < 0.05 50 64.6 ± 9.7 73.7 < 0.005 100 77.6 ± 6.6 89.5 < 0.005 CYS 10 177.5 ± 30.7 67.6 < 0.005 50 121.6 ± 17.0 76.1 < 0.005 100 155.5 ± 6.8 97.0 < 0.005 CYS-GLY 10 139.5 ± 18.5 78.1 < 0.005 50 136.7 ± 13.5 86.5 < 0.005 100 142.4 ± 11.2 91.0 < 0.005 GSH 10 71.1 ± 15.4 57.1 < 0.005 50 61.4 ± 9.0 74.4 < 0.005 100 94.4 ± 12.5 78.1 < 0.005 676 677 678 679