DIAL • 4, rue d’Enghien • 75010 Paris • Téléphone (33) 01 53 24 14 50 • Fax (33) 01 53 24 14 51 E-mail : dial@dial.prd.fr • Site : www.dial.prd.fr
D
OCUMENT DE
T
RAVAIL
DT/2009-07
Decomposing Gender and
Ethnic Earnings Gaps in Seven
West African Cities
Christophe NORDMAN
Anne-Sophie ROBILLIARD
François ROUBAUD
DECOMPOSING GENDER AND ETHNIC EARNINGS GAPS
IN SEVEN WEST AFRICAN CITIES
Christophe Nordman Anne Sophie Robilliard François Roubaud
IRD, DIAL, Paris IRD, DIAL, Dakar IRD, DIAL, Hanoï
nordman@dial.prd.fr robilliard@dial.prd.fr roubaud@dial.prd.fr
Document de travail DIAL Octobre 2009
Abstract
In this paper, we analyse the size and determinants of gender and ethnic earnings gaps in seven West African capitals (Abidjan, Bamako, Cotonou, Dakar, Lome, Niamey and Ouagadougou) based on a unique and perfectly comparable dataset coming from the 1-2-3 Surveys conducted in the seven cities from 2001 to 2002. Analysing gender and ethnic earnings gaps in an African context raises a number of important issues that our paper attempts to address, notably by taking into account labour allocation between public, private formal and informal sectors which can be expected to contribute to earnings gaps. Our results show that gender earnings gaps are large in all the cities of our sample and that gender differences in the distribution of characteristics usually explain less than half of the raw gender gap. By contrast, majority ethnic groups do not appear to have a systematic favourable position in the urban labour markets of our sample of countries and observed ethnic gaps are small relative to gender gaps. Whatever the “sign” of the gap, the contribution of differences in the distribution of individual characteristics varies markedly between cities. Taking into account differences in sectoral locations in the decomposition of gender earnings gaps provides evidence that within-sector differences in earnings account for the largest share of the gender gap and that the differences in sectoral locations are always more favorable to men than to women. By contrast, concerning ethnic earnings gaps, the full decomposition indicates that sectoral location sometimes plays a “compensating” role against observed earnings gaps. Looking at finer levels of ethnic disaggregation confirms that ethnic earnings differentials are systematically smaller that gender differentials.
Key words: earnings equations, gender wage gap, ethnic wage gap, West Africa Résumé
Dans cette étude nous analysons le poids et les déterminants des différentiels de rémunérations entre genre et groupes ethniques dans sept métropoles d’Afrique de l’Ouest (Abidjan, Bamako, Cotonou, Dakar, Lomé, Niamey and Ouagadougou), en mobilisant une base de données unique et parfaitement comparable, provenant des enquêtes 1-2-3 réalisées dans les sept villes en 2001 et 2002. Cette question soulève un certain nombre de questions méthodologiques que nous tentons de traiter en détail, notamment en tenant compte des différences de composition ethnique et de genre entre les secteurs public, privé formel et informel qui sont susceptibles de jouer sur les écarts de revenus. Les résultats mettent en évidence l’existence d’un déficit systématique de rémunération pour les femmes, les caractéristiques des emplois expliquant moins de la moitié de ces écarts. A contrario, les groupes ethniques majoritaires ne semblent pas bénéficier d’une situation avantageuse et les écarts de revenus suivant le groupe ethnique sont relativement faibles par rapport à ceux que l’on observe suivant le genre. Quel que soit le signe de ce différentiel (positif ou négatif), la contribution expliquée par les caractéristiques observées de l’emploi varie très sensiblement d’une ville à l’autre. Les estimations montrent qu’une grande partie de l’écart de revenu selon le genre provient de l’allocation sectorielle, et que cette dernière est toujours défavorable aux femmes. En revanche, dans le cas des écarts suivant le groupe ethnique, la distribution par secteur institutionnel joue parfois de façon positive dans le sens d’une réduction des écarts. Finalement, une désagrégation plus fine des groupes ethniques, au-delà de la partition majoritaire/minoritaire, confirme que l’entrée ethnique est systématiquement moins significative sur les revenus du travail que le genre.
Mots-clé : Equation de gain, écart de salaire, décomposition, genre, Ethnie, Afrique de l'Ouest JEL Classification: J31, J71, O15, O55
Contents
1. INTRODUCTION ... 4
2. DATA, CONCEPTS AND METHODOLOGY... 6
2.1. Data and concepts ... 6
2.2. Wage gap decomposition techniques ... 7
2.2.1. Earnings determination ... 7
2.2.2 Oaxaca and Neumark’s traditional earnings decompositions ... 9
2.2.3 Earnings decompositions with sample selectivity ... 10
2.2.4 A full sectoral decomposition ... 11
2.2.5. Earnings gap decomposition for ethnic groups ... 12
3. RESULTS ... 14
3.1. A Neumark decomposition of gender and ethnic earnings gaps ... 14
3.2. A full decomposition of the gender earnings gap ... 15
3.3. Ethnic earnings differentials ... 17
4. CONCLUSION ... 19
REFERENCES ... 20
APPENDICES ... 29
Appendix 1. Ethnicity in West African countries (1-2-3 Surveys) ... 29
Appendix 2. Number of working individuals in the sample with non zero earnings ... 30
List of figures
Figure 1: Herfindhal concentration indices of Ethnolinguistic fractionalization (ELF) ... 23List of tables
Table 1: Neumark decompositions of gender and ethnic earnings gaps ... 24Table 2: Full decomposition of the gender earnings gap without correcting for selectivity ... 25
Table 3: Full decomposition of the gender earnings gap accounting for selectivity ... 25
Table 4: Full decomposition of the ethnic earnings gap without correcting for selectivity ... 26
Table 5: Full decomposition of the ethnic earnings gap accounting for selectivity ... 26
Table 6a: Ethnic Earnings Differentials ... 27
1. Introduction
Many studies have shown that women and ethnic minorities may face unequal treatment in the labour markets of both developed and developing countries compared to men or majority ethnic groups (Altonji and Blank, 1999). In the case of Africa, there is in fact little known about inequalities in labour market outcomes and enhancing the gender and ethnic gap literature on the poorest countries is important for several reasons. First, there are manifest shortcomings of studies on African countries, particularly due to the shortage of available data (Bennell, 1996). Second, gender and ethnic inequalities are likely to be greater when markets do not function efficiently and the states lack resources for introducing corrective policies. Third, understanding the roots of inequalities between the sexes and ethnic groups and reducing the gender and ethnic gap could help design poverty reducing policies in these countries. Under the Poverty Reduction Strategy Paper (PRSP) initiative that concerns over sixty of the world's poorest countries, policies designed to counter gender discrimination are among the recommended solutions to reduce poverty: Goal 3 of the Millennium Development Goals (MDG) is specifically aimed at reducing gender inequalities. In order to put this recommendation into practice, one needs to understand whether differences in labour outcomes stem from differences in characteristics or from differences in the returns to these characteristics. These would indeed require different sets of policies. In Sub-Saharan countries, the deterioration of the labour markets as well as the partial freeze on public sector recruitment from the mid-1980s may have accentuated the circumstances (i.e. labour market entry and exit) that could give rise to gender and ethnic inequalities in the labour market.
While there is a sizeable number of papers dealing with ethnic and gender wage gap in developed countries (Altonji and Blank, 1999; Blau and Kahn, 2000), we can infer from Weichselbaumer and Winter-Ebmer (2005)’s meta-analysis that only 3 percent of the studies on gender wage gap stem from African data out of all the empirical literature since the 1960s. The existing literature1 on gender gaps indicates that there is a wide consensus on the
1 See, notably, Glewwe (1990) for Ghana; Cohen and House (1993) for Sudan; Milne and Neitzert
(1994) and Agesa (1999) for Kenya; Glick and Sahn (1997) for Guinea; Lachaud (1997) for Burkina and Cameroun; Armitage and Sabot (1991) for Kenya and Tanzania; Appleton, Hoddinott and Krishnan (1999) for Uganda, Côte d'Ivoire and Ethiopia; Isemonger and Roberts (1999) for South Africa; Siphambe and Thokweng-Bakwena (2001) for Botswana; Kabubo-Mariara (2003) for Kenya; Temesgen (2006) for Ethiopia; Kolev and Suarez Robles (2007) for Ethiopia; Nordman and Roubaud (2009) and
importance of inequalities between men and women, both for salaried and self-employed workers. For instance, in Guinea, Glick and Sahn (1997) find that differences in characteristics account for 45 percent of the male-female gap in earnings from self-employment and 25 percent of the differences in earnings from public-sector self-employment while, in the private sector, women actually earn more than men. Armitage and Sabot (1991) also find that such gender inequality exists in the public sector of Tanzania but observed no gender discrimination in Kenya's labour market. The latter result holds true both for the public and private sectors of the Kenyan economy. Similarly, Glewwe (1990) found no wage discrimination against women in Ghana. On the contrary, females seem better off than males in the public sector. More recently, Siphambe and Thokweng-Bakwena (2001) show that in the public sector of Botswana most of the wage gap is due to differences in characteristics between men and women and not to discrimination. On the other hand, in the private sector, most of the wage gap is due to discrimination. Likewise, in Uganda and Côte d'Ivoire, Appleton et al. (1999) find evidence that the public sector practises less wage discrimination than the private sector. A similar result is obtained for Madagascar by Nordman and Roubaud (2009) who evidence a gender wage gap to the advantage of women in the state sector. From all the existing studies, one can hardly conclude on the existence of a common cross-country pattern in the relative magnitudes of the gender wage gaps in the public and private sectors. However, the main reason for this diversity in results might come from the great heterogeneity in the data sources used by the different authors (either labour force or household surveys undertaken for other purposes than labour market issues), in the period they consider and also in the methodology they implement.
Concerning the ethnic wage gap, the literature is even scarcer. Barr and Oduro (2000) find for Ghana that a significant proportion of earnings differentials between ethnic groups can be explained by standard observed workers’ characteristics. On the other hand, the question of the role of ethnolinguistic fractionalization on development has received much more attention. For instance, Easterly and Levine (1997) conclude that “Africa’s growth tragedy” is in part related to its high level of ethnic diversity, resulting in poor institutional functioning. This result is, however, still debated (see Bossuroy, 2007 for a discussion).
Nordman, Rakotomanana and Robilliard (2009) for Madagascar; Nordman and Wolff (2009a) for Morocco and Nordman and Wolff (2009b) for the formal sectors of Madagascar and Mauritius.
In this paper, we cast some new light on these issues by using labour force surveys carried out in seven economic capitals of francophone West Africa. The contribution of this study stems from at least two main advantages. First, the data used were collected using identical sampling method and virtually identical questionnaires in each city in the same period of time (2001-2003), making for totally comparable results.2 Second, we analyse both gender
and ethnic gap issues using the same methodological approach for each city. Given that these are the two most important individual characteristics expected to give rise to discrimination, we believe it is interesting to compare the magnitude of discrimination, if any, against females and against minority or other ethnic groups.
The remainder of the paper is divided as follows. Section 2 discusses the data, concepts and econometric methods used. In section 3 we comment on the results. Finally, in section 4, we draw together the main findings and conclude.
2. Data, Concepts and Methodology
In this section, we first present the data and concepts used in this study before discussing the methodology of earnings decompositions, an essential aspect of our investigation of the gender and ethnic disparities in the West African labour markets.
2.1. Data and concepts
Our data are taken from an original series of urban household surveys in West Africa, the 1-2-3 Surveys conducted in seven major WAEMU3 cities (Abidjan, Bamako, Cotonou, Dakar,
Lome, Niamey and Ouagadougou) from 2001 to 2002. The surveys were carried out by the relevant countries’ National Statistics Institutes (NSIs), AFRISTAT and DIAL as part of the PARSTAT Project.4 The surveys cover the economic city, i.e. the “administrative city” and all
the small towns and villages directly attached to it and with which there are frequent exchanges. As suggested by its name, the 1-2-3 Survey is a three-phase survey. The first phase concerns individuals’ socio-demographic characteristics (including education and literacy)
2 For another comparative analysis with these data, see Kuepie et al. (2009).
3 WAEMU: West African Economic and Monetary Union. The survey was not carried out in
Guinea-Bissau.
4 Regional Statistical Assistance Programme for multilateral monitoring sponsored by the WAEMU
and labour market integration. The second phase covers the informal sector and its main productive characteristics. The third phase focuses on household consumption and living conditions. The same methodology and virtually identical questionnaires were used in each city, making for totally comparable indicators. Our study uses only the Phase 1 data. Phase 1 of the 1-2-3 Survey is a statistical employment survey designed to (i) provide the main indicators to describe the situation of individuals and households on the labour market. It covers household employment and economic activities, especially in the informal sector; (ii) serve as a filter survey to identify a representative sample of informal production units, which are then surveyed in Phase 2.
The sample surveyed in Phase 1 has a total of 93,213 individuals (17,841 households) with country sample sizes varying from 9,907 individuals in Togo to 19,065 individuals in Senegal. All individuals are asked about their ethnic group. The groups obviously differ between countries: the number of groups taken into consideration in the questionnaire varies from 9 in Benin and Niger to 40 groups in Togo. However, in order to harmonize the data and the number of categories considered, the 40 Togolese groups and the 18 Ivorian groups were “reduced” to 6 groups. Non response appears to be the exception with only 665 missing or “Does not know” answers.
2.2. Wage gap decomposition techniques
In the following, we discuss earning equations estimations and present methods that are traditionally used to decompose gender wage gaps. A full decomposition method à la Appleton, Hoddinott and Krishnan (1999) is also presented. The application of these methods to decomposing ethnic wage gaps is then discussed.
2.2.1. Earnings determination
Traditional gender earnings decompositions rely on estimations of Mincer-type earnings functions for men and women of the form:
i i
i
x
w
=
β
+
ε
ln
(1)where
ln
w
i is the natural logarithm of the observed hourly earnings for individual i,x
i is a vector of observed characteristics,β
is a vector of coefficients andε
i is a disturbance term with an expected value of zero.Earning functions are first estimated separately for males and females, and also for the different sectors. There is no universally accepted set of conditioning variables that should be included for describing the causes of gender labour market outcomes differentials. Yet, the consensus is that controls for productivity-related factors such as education, labour market experience and marital status should be included. However, it is debatable whether job characteristics, occupation and industry should be taken into account: if employers differentiate between men and women through their tendency to hire into certain occupations, then occupational assignment is an outcome of employer practices rather than an outcome of individual choice or productivity differences.5
In this paper, it is not possible to account for the workers’ actual experience in the labour market, but only for potential experience which can be viewed as reflecting the ‘gross’ time that individuals have spent while in the labour force (measured as age minus years of schooling minus six – the legal age at school entry). This is a possible limitation of our study since, as argued in the empirical literature, differences in labour force attachment across gender are important to explain the extent of the gender wage gap. Indeed, measures of women’s work experience are particularly prone to errors given their discontinuity in labour market participation (for child baring and care for instance). Using proxy measures such as potential experience may thus lead to overestimate the amount of experience for females, while it might be a good approximation of true experience for men with higher labour force attachment (Nordman and Roubaud,2009).6
Concerns arise over possible sample selection biases in the estimations. Strictly speaking, there are two sources of selectivity bias involved. One arises from the fact that earnings are only observed when people work, and not everyone is working. The second comes from the selective decision to engage in public wage employment rather than private wage employment or the informal sector. Here, we address both issues using Lee’s two-stage
5 Conversely, one can argue that analyses that omit occupation and industry may underestimate the
importance of background and choice-based characteristics on labour market outcomes (Altonji and Blank, 1999).
6 Regan and Oaxaca (2006) show that using potential versus actual experience in earnings models is
best viewed as a model misspecification problem rather than a classical errors-in-variable framework. Instrumental variable techniques are the traditional approach taken to correct classical measurement error. Then, as underline Regan and Oaxaca (2006), in the absence of actual experience measures, instrumenting potential experience would not solve the model specification problem.
approach to take into account the possible effect of endogenous paid-work participation and sector allocation on earnings (Lee, 1983)7. In the first stage, multinomial logit models of
individual i’s participation in sector j are used to compute the correction terms
λ
ij from the predicted probabilities Pij. The different modalities considered in the multinomial logit are: non-paid work participants, public sector workers, formal private sector workers and informal sector workers. A potential problem is that the multinomial logit may suffer from the Independence of Irrelevant Alternatives assumption (IIA), which in most cases is questionable. We performed Hausman-type tests (Hausman and McFadden, 2004) for each city and sector which massively provide evidence that the IIA assumption is not violated, with the exception of the informal sector in BamakoIn Lee’s procedure, identification is achieved by the inclusion of additional individual variables in the first stage selection equations which are omitted in the second stage earnings regressions: a set of dummies indicating relationship to the household head, the dependency ratio (number of non working age individuals divided by the total number of individuals in the household), and the household size.8 Our assumption is that these variables have arguably no reason to influence earning levels.2.2.2. Oaxaca and Neumark’s traditional earnings decompositions
The most common approach to identifying sources of gender wage gaps is the Oaxaca-Blinder decomposition. In this approach, two separate standard Mincerian log earnings equations are estimated for males and females. The Oaxaca decomposition is:
f f m f m m f m
w
x
x
x
w
ln
(
)
(
)
ln
−
=
β
−
+
β
−
β
(2)where
w
m andw
f are the means of males and females’ earnings, respectively;x
m andx
f are vectors containing the respective means of the independent variables for males and females; andβ
m andβ
f are the estimated coefficients. The first term on the right hand side captures the earnings differential due to different characteristics of males and females. The7 Following Tunali (1986), an alternative approach would be to employ a sequential selection rule
(nested multinomial logit) rather than a combined one. This means controlling for self-selection into the paid-work group and then different endogenous choices between the public, formal private and informal sectors. This technique requires finding a least one variable affecting the decision to enter the paid-work group but not the sector choice in order to achieve identification via the use of restriction exclusion. Unfortunately, in our data, it seems impossible to find variables that may be used in the first stage selection equation and arguably be excluded from a second selection equation of sector allocation.
8 Similarly, in the same context of a two-step sectoral selection correction, Appleton et al. (1999) use
second term is the earnings gap attributable to different returns to those characteristics or coefficients.
It can be argued that, under discrimination, males are paid competitive wages but females are underpaid. If this is the case, the male coefficients should be taken as the non-discriminatory wage structure, as in equation (2). Conversely, if employers pay females competitive wages but pay males more (nepotism), then the female coefficients should be used as the non-discriminatory wage structure. Therefore, the issue is how to determine the wage structure
β
* that would prevail in the absence of discrimination. This choice poses thewell-known index number problem given that we could use either the male or the female wage structure as the non-discriminatory benchmark. While a priori there is no preferable alternative, the decomposition can be quite sensitive to the selection made. The literature has proposed different weighting schemes to deal with the underlying index problem. In this paper, we rely on the general decomposition proposed by Neumark (1988) which can be written as follows:
]
)
(
)
[(
)
(
ln
ln
w
m−
w
f=
β
*x
m−
x
f+
β
m−
β
*x
m+
β
*−
β
fx
f (3) This decomposition can be reduced to Oaxaca’s two special cases if it is assumed that there is no discrimination in the male wage structure, i.e.β
=
β
m*
, or if it is assumed that
β
=β
f*
. Neumark shows that
β
* can be estimated using the weighted average of the wage structuresof males and females and advocates using the pooled sample to estimate
β
*. The first term isthe gender wage gap attributable to differences in characteristics. The second and the third terms capture the difference between the actual and pooled returns for men and women, respectively.
2.2.3 Earnings decompositions with sample selectivity
Neuman and Oaxaca (2004) show that sample selection complicates the interpretation of earnings decompositions. They offer several alternative decompositions, each based on different assumptions and objectives. We use one of them that consist in considering selectivity as a separate component. This technique has the advantage of not calling for any prior hypothesis regarding the links between individual characteristics and selectivity. An additional term in the decomposition measures the contribution of selection effects to the observed gender earnings gap,
θ
ˆ
mλ
ˆ
m−
θ
ˆ
fλ
ˆ
f , whereλ
ˆ andθ
ˆ denote respectively the meancorrection term (generalised Mill’s ratio) and its estimated coefficient from each regression by sex. Hence, in the full sectoral decomposition that follows, when trying to account for sample selectivity, we will consider the decomposition of offered earnings instead of actual earnings, i.e. earnings net of the selection effects
θ
ˆλ
ˆ (see Reimer, 1983).2.2.4. A full sectoral decomposition
While the improvement proposed by Neumark’s decomposition is attractive, it is not immune from common criticisms of decomposition methods in general. One of them is that, without evidence that employers care only about the proportion of each type of labour employed, it is not clear that the pooled coefficient is a good estimator of the non-discriminatory wage structure. Appleton et al. (1999)’s full sectoral decomposition takes into account sectoral structures differences between genders by using a similar approach to that of Neumark and decomposing the gender earnings gap into three components.
Let
W
m and Wf be the means of the natural logs of male and female earnings andp
mj andfj
p
be the sample proportions of men and women in sector j respectively. Male and female mean earnings can be written as the sum of sectoral earnings weighted by the proportion of workers in each sector :∑
==
3 1 j mj mj mW
p
W
∑
==
3 1 j fj fj fW
p
W
As a result, one can decompose the difference in mean earnings into intrasectoral earnings differences and differences in proportions employed in the different sectors. In order to overcome the index problem, Appleton et al. (1999) assume a sectoral structure that would prevail in the absence of gender differences in the impact of characteristics on sectoral choice. Let *
j
p be the proportion of workers in sector j under this assumption. They then decompose the difference in mean earnings such as:
∑
∑
∑
= = =−
+
−
+
−
=
−
3 1 3 1 * 3 1 * *)
(
)
(
)
(
j j fj j fj j j mj mj fj mj j f mW
p
W
W
W
p
p
W
p
p
W
(4)The first term can be decomposed using the Neumark decomposition presented earlier. The second and third terms can further be decomposed in order to set apart differences arising
from differences in observable characteristics and differences arising from differences in returns to observable characteristics. In order to do so, one can derive the average probability to be employed in a given sector for male and female workers from the estimation of pooled and separate multinomial logit models for men and women. These mean probabilities are denoted by *
mj
p and *
fj
p respectively. Embedding the self-selection process in (4), the full decomposition can then be written in the following way:
.
)
(
)
(
)
(
)
(
)
(
)
(
)
(
3 1 * 3 1 3 1 * * * 3 1 * * 3 1 3 1 * * 3 1 * * * *∑
∑
∑
∑
∑
∑
∑
= = = = = = =−
+
−
+
−
+
−
+
−
+
−
+
−
=
−
j fj fj fj j j mj mj mj fj j fj j j mj mj j j fj j fj j j j mj mj j j fj mj j f mp
p
W
p
p
W
p
p
W
p
p
W
x
p
x
p
x
x
p
W
W
β
β
β
β
β
(5)The first three terms are similar to Neumark decompositions of within-sector earnings gaps. The fourth and fifth terms measure the difference in earnings due to differences in distribution of male and female workers in different sectors. The last two terms account for differences in earnings resulting from the deviations between predicted and actual sectoral compositions of men and women not accounted for by differences in characteristics.
2.2.5. Earnings gap decomposition for ethnic groups
Extending decomposition methods developed and traditionally used to analyse possible discrimination against women to the study of earnings differentials between ethnic groups is not straightforward. One of the main problems is related to the definition and measurement of ethnicity: what defines an ethnic group? In developed countries, there exist conflicting views and different traditions regarding the collection of data on ethnic origin: while Anglo-Saxon societies are used to measuring and analysing data on so-called racial or ethnic groups, a number of countries refuse to categorize individuals using ethnic or racial criteria9
and, as a result, do not collect statistical data on ethnic origin. In Africa, the notion of ethnicity also raises a number of questions that have been extensively debated among social scientists (see for instance Bayart, 1989). Works by anthropologists have indeed shown that, contrary to a naïve a priori, ethnic groups are not characterized by the genetic homogeneity of their members. Depending on countries and contexts, the constitution of ethnic groups appears to be more or less recent and their definition is moving. While some groups have their origin in a common myth and/or ancestor, others only share a common language and culture, and some have been constructed from “outside”, i.e. by other groups, either upon a
9 In France, the collection of data on ethnic origin is subject to the authorization of a government body
and is not granted systematically. Recently, a survey designed to study racial discrimination in the labour market gave rise to a strong opposition from French public opinion.
migration or invasion event, or through an exogenous categorization constructed and imposed by colonial rulers. Despite their various origins, it is widely admitted that the notion of ethnicity plays a certain role in the social relations of many African countries. There is, for instance, strong evidence of high levels of endogamy, not only in rural areas where ethnic homogeneity is often observed at the local level, but also in urban areas where different ethnic groups usually cohabit. In the past ten years, economists have seized the “ethnic” issue around the question of its impact on development and growth. The seminal paper is Easterly and Levine’s contribution (1997) that concludes that “Africa’s growth tragedy” is in part related to its high level of ethnic diversity, resulting in poor institutional functioning. However, this result is still debated nowadays (see Bossuroy, 2007 for a discussion).
In this paper, we focus on the impact of ethnicity on labour market outcomes measured through earnings. In order to apply the methods developed for the analysis of the gender earnings gap, one is inclined to construct a dichotomous variable identifying either a possibly favoured or discriminated against ethnic group. Data collection on ethnicity at the household or individual level is common in Africa: most household and employment surveys include a variable indicating the ethnic group. However, given the diversity of national contexts, two difficulties arise: the first one is related to identifying a priori a discriminated ethnic group: should one consider the majority ethnic group as favoured? Or should one consider instead the group related to the head of state? The second difficulty arises because of our comparative framework: how does belonging to the different groups compare across countries? For instance, if one considers majority ethnic groups in the cities of the 1-2-3 Surveys, is it the same to be a Mossi in Ouagadougou (76.6 percent of the population) and a Bambara in Bamako (34.0 percent of the population)? Although we do not attempt to answer this question in the paper, we try to consider various aspects of possible ethnic discrimination on urban labour markets while keeping in mind the different national contexts.
3. Results
3.1. A Neumark decomposition of gender and ethnic earnings gaps
In this section, gender and ethnic earnings gaps are analysed using traditional decomposition approaches. As mentioned earlier, in order to apply these methods to decompose the ethnic earnings gap, one is inclined to construct a dichotomous variable identifying either a possibly favoured or discriminated against ethnic group. For that purpose, we identify a majority ethnic group in each city. Descriptive statistics indicate that these majority ethnic groups represent an absolute majority of the capital’s population in three countries out of seven.10 More precisely:
- the Fon represent 60.9 percent of the population of Cotonou (Benin);
- the Mossi represent 78.2 percent of the population in Ouagadougou (Burkina Faso); - the Akan represent 34.2 percent of the population in Abidjan (Cote d’Ivoire);
- the Bambara represent 34.4 percent of the population of Bamako (Mali); - the Djerma represent 49.5 percent of the population of Niamey (Niger); - the Wolof represent 40.4 percent of the population of Dakar (Senegal);
- the Ewe-Mina-Wachi represent 74.2 percent of the population of Lome (Togo). In six cities out of seven, the majority ethnic group corresponds to the majority group at the national level. The only exception is Niger where the majority ethnic group in the capital is the Djerma while it is the Haoussa at the national level (54 percent of the population).
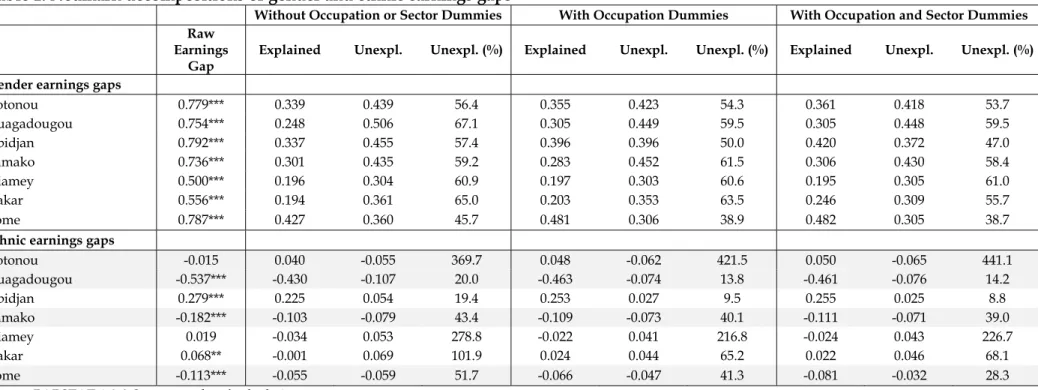
A first look at earnings gap decompositions based on gender and majority ethnic groups is provided in Table 1 which reports a decomposition of earnings gaps based on Neumark’s approach (see section 2.2.2). A number of results are worth emphasizing.
Raw gender earnings gaps are large, significant and vary from 50.0 in Niamey to 79.2 in Abidjan: these figures indicate that females in Niamey (resp. in Abidjan) earn on average 50.0 percent (respectively 20.8 percent) of male earnings.
Gender differences in the distribution of characteristics related to productivity – such as education and experience – usually explain less than half of the raw gender gap in six cities out of seven: Lome is an exception with differences in characteristics explaining almost 55 percent of the gap. Including variables related to the type of occupation decreases somewhat
the unexplained share of the raw gender gap. This decrease appears to be substantial in Ouagadougou, Abidjan and Lome.
Contrary to the systematic favourable position of men with respect to women, majority ethnic groups do not appear to have a systematic favourable position in the urban labour markets of our sample of countries. It is only in Abidjan and Dakar that the gap appears both significant and favourable for the majority ethnic group: in Abidjan, the Akan earn on average 28.0 percent more than other ethnic groups while in Dakar, the Wolof earn on average 6.8 percent more than other ethnic groups; on the contrary, majority ethnic groups in Ouagadougou, Bamako and Lome earn significantly less on average than other ethnic groups.
Concerning the decomposition of ethnic earnings gaps, results differ markedly. In Abidjan, the results indicate that differences in the distribution of individual characteristics explain more than 85 percent of the gap so that little is left for what could be labelled discrimination (the unexplained share) against non majority ethnic groups. In Dakar, on the contrary, 100% of the gap is left unexplained until job characteristics related to occupation and sector are introduced. In Ouagadougou, where the majority ethnic group (Mossi) receives lower earnings than other groups, the gap is also in large part explained by differences in the distribution of observable characteristics such as education and experience; as a result, the unexplained share is low at 20.0 percent; in Bamako, the unexplained share of the gap against the majority ethnic group (Bambara) is much higher: there, differences in returns to characteristics account for 43.4 percent of the gap (down to 39 percent once occupation status dummies are included in the regressions).
3.2. A full decomposition of the gender earnings gap
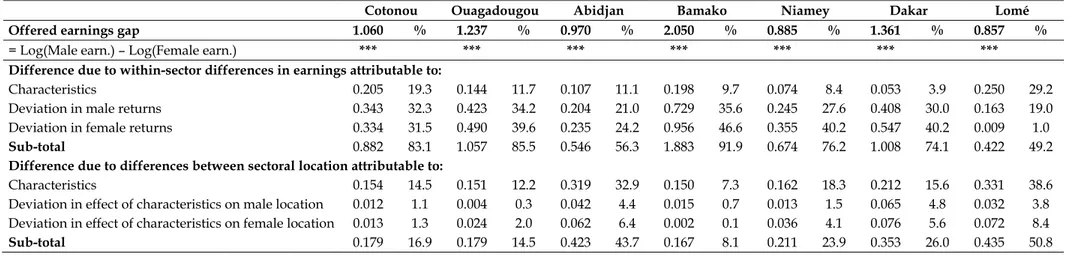
It is widely acknowledged that there are at least four types of labour markets in most developing countries: rural (or agricultural), public, formal private and informal. These markets each have their own characteristics, such as job seasonality, uncertainty of demand, nature of contracts and structure of wages and earnings. As a result, gender and ethnic labour allocation between these sectors can be expected to contribute to earnings gaps. Following Appleton et al. (1999) and Nordman and Roubaud (2009), we provide comparable estimates of the size and determinants of gender earnings gaps using the decomposition method described in section 2.2.4. Given that we are analysing urban labour markets, only three types of labour markets are taken into consideration: public, formal private and
informal. Results are reported in Tables 2 and 3, without and with correction for selectivity of participation and sectoral allocation (see section 2.2.3).
Within-sector differences in earnings account for the largest share of the gender gap with contributions ranging from 60.2 percent in Abidjan to 74.8 percent in Cotonou. The remainder can then be attributed to gender differences in proportions of workers in each sector. The positive sum of these three terms for all cities implies that the differences in sectoral locations are more favourable to men than to women. For instance, the gender earnings gap would have been 40 percent smaller respectively in Abidjan if men and women had been equally distributed across the three sectors. This is because fewer women than men are located in the higher paying sectors such as the public and private formal sectors.
Differences attributable to characteristics only account for a relatively small share of the within-sector differences in earnings: their contribution varies from 10 percent in Dakar to 41 percent in Lome (as a share of the contribution of within-sector differences; not shown in the table). Conversely, differences attributable to characteristics account for a very large share of the sectoral location differences between genders: their contribution varies from 65 percent in Dakar to 85 percent in Cotonou and Bamako.
Concerning differences attributable to deviation in male and female returns, their contribution to within-sector differences in earnings are of the same order, indicating that both “discrimination” against women and “nepotism” in favour of men contribute to the gender earnings gap; both “discrimination” against women and “nepotism” in favour of men also contribute to differences in sectoral location but at a much lower level.
Taking into account selectivity leads to analysing the decomposition not of actual earnings but of offered earnings. These are computed using the coefficients of the selection term in the earnings equations (see section 2.2.3). Results in Table 3 show that offered earnings gaps are much higher in Cotonou, Bamako and Dakar, while they are lower in the other cities. Higher earnings gaps when sectoral selectivity is accounted for are not systematically associated with higher contribution of sectoral location differences however. Except in Niamey, within-sector earnings differences remain the main contributor to gender gaps.
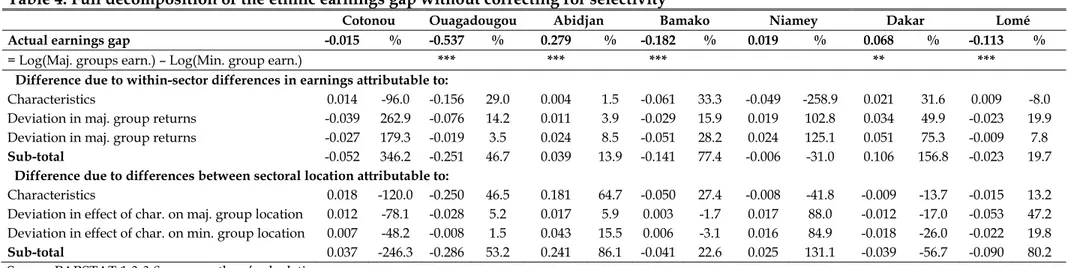
Concerning ethnic earnings gaps, our results in Table 4 (without correcting for selectivity) indicate that: In Ouagadougou the gap can almost evenly be attributed to within-sector earning difference (46.7%) and to sectoral location (53.2%). In Abidjan, it is differences in sectoral location that explain the highest share of the gap (86.1 percent) of which 75 percent
are accounted for by differences in characteristics. In Bamako, within-sector differences in earnings account for 77.4 percent of the earnings gap out of which 33.3 percent are attributable to differences in characteristics; both “nepotism” (15.9 percent) and “discrimination” (28.2 percent) significantly contribute to the gap through their contribution to within-sector differences in earnings. On the contrary, sectoral location differences are almost entirely explained by differences in characteristics. In Lome, the gap is also explained by sectoral location differences but, contrary to Bamako, the deviation in the effect of characteristics on location explains a big share of sectoral location differences. Contrary to the results obtained for gender, where sectoral location systematically increases the gap “against” women, it is in some cities the case that sectoral location plays a “compensating” role against observed earnings gaps.
Results reported in Table 5 show that taking into account selectivity leads to reassessing some measures of the gaps. The gap decreases for Ouagadougou, Abidjan and Dakar and increases for Bamako. For these cities, the decomposition results appear however relatively stable. In Lome, the gap is actually reversed, a possible indication that the majority ethnic group is offered on average higher earnings than the other ethnic groups. This result is somewhat puzzling and would require further investigation. For instance, in order to understand the features of earnings negotiations, one would need to know the ethnic group of the employer.
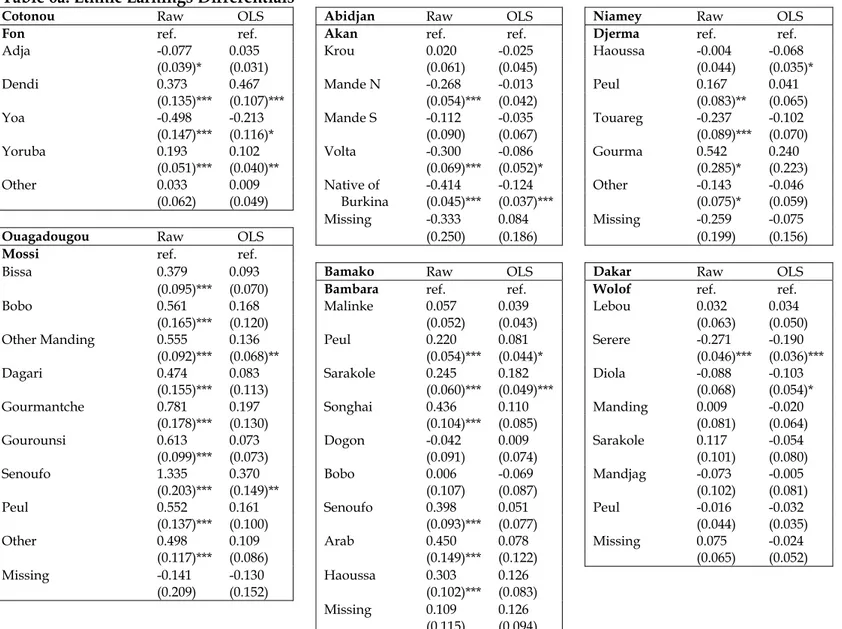
3.3. Ethnic earnings differentials
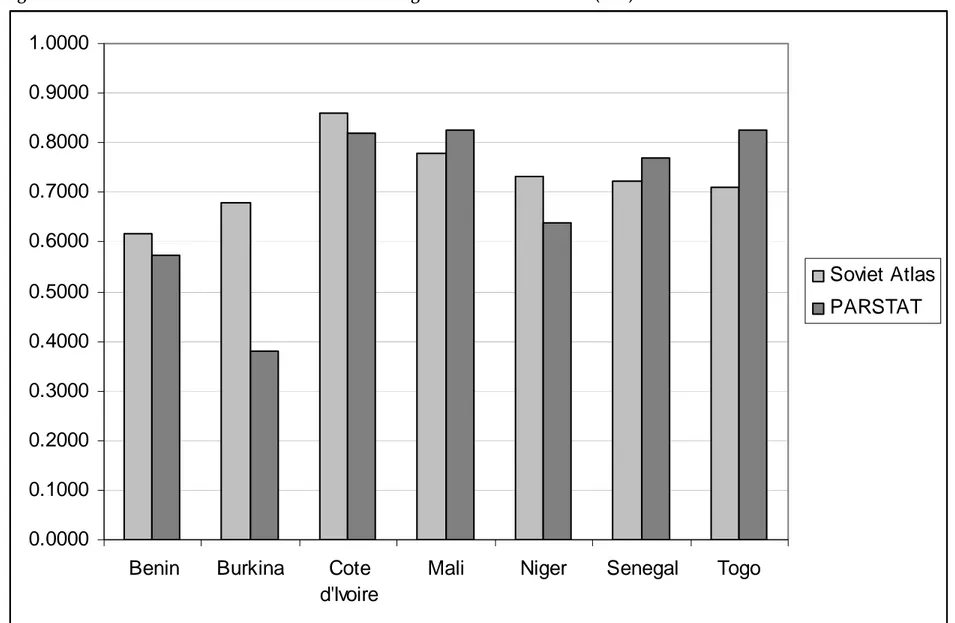
In this section, we examine earnings differentials between ethnic groups. As mentioned earlier, several ethnic groups can be differentiated in each capital. The highest number of groups is in Bamako (11 groups), followed by Ouagadougou (10 groups), Cotonou, Niamey and Dakar (9 groups) and Abidjan and Lome (6 groups). Figure 1 reports two Herfindhal’s concentration indices for ethnolinguistic fractionalization (ELF) in each country: the first one is computed at the national level while the second is computed at the level of capitals using the 1-2-3 Surveys. Levels are similar across countries except for Burkina Faso where the ELF index appears to be much lower in the capital than at the country level. This could stem from the fact that the ethnic majority group (Mossi) represents 78.2 percent of the population in Ouagadougou and only 50 percent at the national level. This points to a factor that can explain why majority ethnic groups are not systematically favoured in the labour markets of
our sample: indeed, in the case of Burkina, where Mossi have lower average earnings than other ethnic groups, it could be the case that only the better performing non-Mossi actually “migrate” to the capital. This is consistent with the results of the Neumark decomposition of the ethnic earnings gap in section 3.1. where we find that the gap “against” the Mossi is mainly explained by differences in characteristics.
Coefficients of the dummies indicating each ethnic group in city-level earnings equations regressions are reported in Table 6a. In the first column, ethnic group dummies are the only regressors while a set of usual controls is introduced in the specification reported in the second column (coefficients for these variables are reported in Table 6b). Results show two things: first, there is at least one significant coefficient on ethnic dummies in all the cities of the sample meaning that there exist differences in average earnings between ethnic groups. However, most of these differences diminish and, in some cases, vanish once other observables characteristics are controlled for. In the case of Cotonou, both the Dendi people and the Yoruba appear favoured ceteris paribus with respect to the majority ethnic group (Fon), while the Yoa have lower earnings ceteris paribus than the Fon. In Ouagadougou, the group of “other mandingues” as well as the Senoufo people are favoured ceteris paribus compared to the Mossi. In Abidjan, both the Volta people and the natives from Burkina Faso have lower earnings ceteris paribus than the majority ethnic group (Akan). In Bamako, both the Peul and the Sarakole are favoured with respect to the majority ethnic group (Bambara). In Niamey, once control variables are included, only the Haoussa appear less favoured compared to the Djerma. In Dakar, both the Serere and Diola people have lower earnings ceteris paribus than the Wolof.11
Overall majority ethnic groups seem not be favoured on the labour market once one controls for productivity related individual characteristics. On the contrary, some minority groups actually have higher earnings ceteris paribus. This is the case in Benin, Burkina, and Mali. However, none of the favoured groups seem to be related to the ethnicity of the head of state at the time of the survey.12
11 Despite the fact that some earnings differentials hold ceteris paribus, one should note that in some cases, the
groups considered represent very small shares of the population (see Appendix 2). Consequently, the question of the size of our samples for analysing the characteristics of these groups can be raised. This is one of the reasons why we did not implement decomposition methods at this level of ethnic disaggregation.
12 Head of state ethnicity at the time of the survey is provided in the dataset put together by Fearon, Kasara and
4. Conclusion
In this paper, we analyse the size and determinants of gender and ethnic earnings gaps in seven West African capitals. The study is based on a unique dataset taken from an original series of urban household surveys in West Africa, the 1-2-3 Surveys conducted in seven major WAEMU cities (Abidjan, Bamako, Cotonou, Dakar, Lome, Niamey and Ouagadougou) from 2001 to 2002. Analysing gender and ethnic earnings gaps in an African context raises a number of important issues that our paper attempts to address.
First, international comparisons of earnings gaps are still scarce in Africa. Our surveys use identical methodologies and virtually identical questionnaires in each city, making for totally comparable results. Second, we address the issue of sample selectivity due to endogenous sector choices (public, private formal and informal sectors) as gender and ethnic labour allocation between these sectors can be expected to contribute to earnings gaps. Following Appleton et al. (1999), we then provide comparable estimates of the size and determinants of gender and ethnic earnings gaps using decomposition methods that address the sectoral allocation issue.
The results show that gender earnings gaps are large in all the cities of our sample and that gender differences in the distribution of characteristics usually explain less than half of the raw gender gap. By contrast, majority ethnic groups do not appear to have a systematic favourable position in the urban labour markets of our sample of countries and observed gaps are small relative to gender gaps. Moreover, none of the minority “favoured” groups seem to be related to the ethnicity of the head of state at the time of the survey.
Whatever the “sign” of the gap, the contribution of differences in the distribution of individual characteristics varies markedly between cities. Taking into account differences in sectoral locations in the decomposition of gender earnings gaps provides evidence that within-sector differences in earnings account for the largest share of the gender gap and that the differences in sectoral locations are always more favourable to men than to women. By contrast, concerning ethnic earnings gaps, the full decomposition indicates that sectoral location sometimes plays a “compensating” role against observed earnings gaps. Looking at finer levels of ethnic disaggregation confirms that ethnic earnings differentials are systematically smaller that gender differentials.
References
Agesa, Richard U. (1999), “The Urban Gender Wage Gap in an African Country: Findings from Kenya”, Canadian Journal of Development Studies, 20, no. 1:59-76.
Altonji, Joseph G., Rebecca M. Blank (1999), “Race and Gender in the Labor Market”, in Orley Ashenfelter and David Card, Handbook of Labor Economics, Volume 3C, North Holland, Amsterdam, pp. 3143-3257.
Appleton, Simon, John Hoddinott, Pramila Krishnan (1999), “The Gender Wage Gap in Three African Countries”, Economic Development and Cultural Change, 47, no. 2:289-312. Armitage, Jane, Richard Sabot (1991), “Discrimination in East African's Urban Labor
Market”, In Unfair Advantage: Labor Market Discrimination in Developing Countries, ed. Nancy Birdsall and Richard Sabot, Washington D.C., The World Bank.
Barr, Abigail, Abena Oduro (2000), “Ethnicity and Wage Determination in Ghana”, World Bank Policy Research Working Paper No. 2506, Washington D.C., The World Bank. Bayart, Jean-François (1989) “Le théâtre d'ombres de l'ethnicité”, in L'Etat en Afrique, la
politique du ventre, Fayard Paris, pp.65-86.
Bennell, Paul (1996), “Rates of Return to Education: Does the Conventional Pattern Prevail in Sub-Saharan Africa?”, World Development, 24, no. 1:183-199.
Blau, Francine, Lawrence Kahn (2000), “Gender Differences in Pay”, Journal of Economic Perspectives, 14:75-99.
Blinder, Alan S. (1973), “Wage Discrimination: Reduced Form and Structural Estimates”, The Journal of Human Resources, 8, no. 4:436-455.
Bourguignon, François, Martin Fournier and Marc Gurgand (2007), “Selection Bias Correction Based on the Multinomial Logit Model: Monte-Carlo Comparisons”, Journal of Economic Surveys, 21, no. 1:174-205.
Bossuroy, Thomas (2007), “Ethnicity as a Resource in Social Capital”, mimeo DIAL, Paris. Brown, Randall S., Marilyn Moon, Barbara S. Zoloth (1980), “Incorporating Occupational
Attainment in Studies of Male-Female Earnings Differentials”, The Journal of Human Resources, 15, no. 1:3-28. Cohen, Barney, William J. House (1993), “Women's Urban Labour Market Status in Developing Countries: How Well Do They Fare in Khartoum, Sudan?”, Journal of Development Studies, 29, no. 3:461-83.
Easterly, William, Ross Levine (1997), “Africa’s Growth Tragedy: Policies and Ethnic Divisions”, Quaterly Journal of Economics, 111, no. 4:1203-1250.
Fearon, James D. (2003), “Ethnic and Cultural Diversity by Country ”, Journal of Economic Growth, 8, 195—222.
Fearon, James, Kimuli Kasara, David Laitin (2007) Ethnic Minority Rule and Civil War Onset. American Political Science Review 101 (1).
Glewwe, Paul (1990), “Schooling, Skills and the Return to Education: an Econometric Exploration Using Data from Ghana”, Living Standards Measurement Working Paper, no. 76, Washington D.C.: The World Bank.
Glick, Peter, David E. Sahn (1997), “Gender and Education Impacts on Employment and Earnings in West Africa: Evidence from Guinea”, Economic Development and Cultural Change, 45, no. 4:793-823.
Hausman, Jerry. A., Daniel MacFadden (1984), “Specification Tests for the Multinomial Logit Model”, Econometrica, 52, no. 5:1219-1240.
Isemonger, A.G., Neil Roberts (1999), “Post-entry Gender Discrimination in the South African Labour Market”, Journal for Studies in Economics and Econometrics, 23, no. 2:1-25. Kabubo-Mariara, Jane (2003), “Wage Determination and the Gender Wage Gap in Kenya:
Any Evidence of Gender Discrimination?”, Research Paper 132, African Economic Research Consortium, Nairobi.
Kolev, Alexandre, Pablo Suarez Robles (2007), “Addressing the Gender Pay Gap in Ethiopia: How Crucial is the Quest for Education Parity?”, mimeo, joint AFD-World Bank research project.
Kuepie, Mathias, Christophe J. Nordman, François Roubaud (2009), “Education and Earnings in Urban West Africa”, Journal of Comparative Economics, forthcoming.
Lachaud, Jean-Pierre (1997), “Les Femmes et le Marché du Travail Urbain en Afrique Subsaharienne”, Editions l’Harmattan, 233 pages.
Lee, Lung-Fei (1983), “Generalized Econometric Models with Selectivity”, Econometrica, 51, no. 2:507-512.
Milne, William, Monica Neitzert (1994), “Kenya”, in Labor Markets in an Era of Adjustment: Issues Papers 1: 405-457, ed. Susan Horton, Ravi Kanbur and Dipak Mazumdar, Washington D.C: EDI Development Studies, World Bank.
Neuman, Shoshana, Ronald Oaxaca (2004), “Wage Decompositions with Selectivity-Corrected Wage Equations: A Methodological Note”, The Journal of Economic Inequality, 2, no. 1:3-10.
Neumark, David (1988), “Employers’ Discriminatory Behavior and the Estimation of Wage Discrimination”, The Journal of Human Resources, 23:279-295.
Nordman, Christophe J., François Roubaud (2009), “Reassessing the Gender Wage Gap in Madagascar: Does Labour Force Attachment Really Matter?”, Economic Development and Cultural Change, 57, no. 4:785-808.
Nordman, Christophe J., Faly Rakotomanana, Anne-Sophie Robilliard (2009), “Gender Disparities in the Malagasy Labor Market”, forthcoming in Gender Disparities in Africa’s Labor Markets, Washington DC: The World Bank.
Nordman, Christophe J., François-Charles Wolff (2009a), “Is there a Glass Ceiling in Morocco? Evidence from Matched Worker-Firm Data”, Journal of African Economies, forthcoming.
Nordman, Christophe J., François-Charles Wolff (2009b), “Islands Through the Glass Ceiling? Evidence of Gender Wage Gaps in Madagascar and Mauritius”, forthcoming in Labor Markets and Economic Development, Ravi Kanbur and Jan Svejnar (eds), Routledge.
Oaxaca, Ronald (1973), “Male-Female Wage Differentials in Urban Labor Markets”, International Economic Review, 14, no. 3:693-709.
Regan, Tracy L., Ronald L. Oaxaca (2006), “Work Experience as a Source of Specification Error in Earnings Models: Implications for Gender Wage Decompositions”, IZA Discussion Papers 1920, Bonn: Institute for the Study of Labor.
Reimers, Cordelia W. (1983), “Labour Market Discrimination Against Hispanic and Black Men”, The Review of Economics and Statistics, 65, no. 4:570-579.
Roubaud, François (1994), “La Question Ethnique sur le Marché du Travail à Yaounde : Discrimination ou Solidarité ?”, DIAL Working Paper, DT/1994-13, Paris: DIAL.
Schultz, T. Paul (2004), “Evidence of Returns to Schooling in Africa from Household Surveys: Monitoring and Restructuring the Market for Education”, Journal of African Economies, vol. 13: 95-148.
Siphambe, Happy Kufigwa, Malebogo Thokweng-Bakwena (2001), “The Wage Gap Between Men and Women in Botswana's Formal Labour Market”, Journal of African Economies, 10, no. 2:127-142.
Söderbom, Mans, Francis Teal, A.Wambugu, G. Kahyarara (2006), “Dynamics of Returns to Education in Kenyan and Tanzanian Manufacturing”, Oxford Bulletin of Economics and Statistics, vol. 68: 261-288.
Temesgen, Tilahun (2006), “Decomposing Gender Wage Differentials in Urban Ethiopia: Evidence from Linked Employer-Employee (LEE) Manufacturing Survey Data”, Global Economic Review, vol. 35, no. 1: 43-66.
Tunali I. (1986), “General Structure for Models of Double-Selection and an Application to a Joint Migration/Earnings Process with Remigration”, in R. G. Ehrenberg (ed), Research in Labor Economics, vol. 8B, pp. 235-284, JAI Press Inc, Greenwhich, Connecticut.
Weichselbaumer, Doris, Rudolf Winter-Ebmer (2005), “A Meta-Analysis of the International Gender Wage Gap”, Journal of Economic Surveys, 19, no. 3: 479-511.
Figure 1: Herfindhal concentration indices of Ethnolinguistic fractionalization (ELF)
0.0000
0.1000
0.2000
0.3000
0.4000
0.5000
0.6000
0.7000
0.8000
0.9000
1.0000
Benin
Burkina
Cote
d'Ivoire
Mali
Niger
Senegal
Togo
Soviet Atlas
PARSTAT
Table 1: Neumark decompositions of gender and ethnic earnings gaps
Without Occupation or Sector Dummies With Occupation Dummies With Occupation and Sector Dummies Raw
Earnings Gap
Explained Unexpl. Unexpl. (%) Explained Unexpl. Unexpl. (%) Explained Unexpl. Unexpl. (%) Gender earnings gaps
Cotonou 0.779*** 0.339 0.439 56.4 0.355 0.423 54.3 0.361 0.418 53.7 Ouagadougou 0.754*** 0.248 0.506 67.1 0.305 0.449 59.5 0.305 0.448 59.5 Abidjan 0.792*** 0.337 0.455 57.4 0.396 0.396 50.0 0.420 0.372 47.0 Bamako 0.736*** 0.301 0.435 59.2 0.283 0.452 61.5 0.306 0.430 58.4 Niamey 0.500*** 0.196 0.304 60.9 0.197 0.303 60.6 0.195 0.305 61.0 Dakar 0.556*** 0.194 0.361 65.0 0.203 0.353 63.5 0.246 0.309 55.7 Lome 0.787*** 0.427 0.360 45.7 0.481 0.306 38.9 0.482 0.305 38.7
Ethnic earnings gaps
Cotonou -0.015 0.040 -0.055 369.7 0.048 -0.062 421.5 0.050 -0.065 441.1 Ouagadougou -0.537*** -0.430 -0.107 20.0 -0.463 -0.074 13.8 -0.461 -0.076 14.2 Abidjan 0.279*** 0.225 0.054 19.4 0.253 0.027 9.5 0.255 0.025 8.8 Bamako -0.182*** -0.103 -0.079 43.4 -0.109 -0.073 40.1 -0.111 -0.071 39.0 Niamey 0.019 -0.034 0.053 278.8 -0.022 0.041 216.8 -0.024 0.043 226.7 Dakar 0.068** -0.001 0.069 101.9 0.024 0.044 65.2 0.022 0.046 68.1 Lome -0.113*** -0.055 -0.059 51.7 -0.066 -0.047 41.3 -0.081 -0.032 28.3
Source: PARSTAT 1-2-3 Surveys, authors’ calculations.
Note: * significant at 10%; ** significant at 5%; *** significant at 1%.
Raw Gender Earnings Gaps are positive by construction because they are computed as the difference between a “high group” and a “low group”. In our sample of countries, females always correspond to the “low group”. This is not the case for the majority ethnic group which corresponds to the “high group” in Abidjan, Niamey and Dakar and to the “low group” in Cotonou, Ouagadougou, Bamako and Lome. This explains why gaps are negative for these last four cities.
Table 2: Full decomposition of the gender earnings gap without correcting for selectivity
Cotonou Ouagadougou Abidjan Bamako Niamey Dakar Lomé
Actual earnings gap 0.779 % 0.754 % 0.792 % 0.736 % 0.500 % 0.556 % 0.787 %
= Log(Male earn.) – Log(Female earn.) *** *** *** *** *** *** ***
Difference due to within-sector differences in earnings attributable to:
Characteristics 0.166 21.3 0.092 12.3 0.099 12.5 0.133 18.1 0.060 12.1 0.043 7.7 0.240 30.5
Deviation in male returns 0.238 30.6 0.210 27.9 0.192 24.3 0.199 27.0 0.110 22.1 0.143 25.8 0.191 24.2
Deviation in female returns 0.178 22.9 0.250 33.1 0.185 23.4 0.209 28.4 0.164 32.7 0.161 28.9 0.122 15.5
Sub-total 0.582 74.8 0.552 73.3 0.476 60.2 0.541 73.5 0.334 66.9 0.347 62.4 0.553 70.2
Difference due to differences between sectoral location attributable to:
Characteristics 0.167 21.4 0.170 22.5 0.245 30.9 0.165 22.4 0.126 25.1 0.136 24.4 0.182 23.2
Deviation in effect of characteristics on male location 0.010 1.3 0.010 1.3 0.022 2.7 0.009 1.3 0.012 2.5 0.028 5.0 0.018 2.3
Deviation in effect of characteristics on female location 0.020 2.5 0.023 3.0 0.049 6.2 0.021 2.8 0.027 5.5 0.045 8.2 0.033 4.2
Sub-total 0.197 25.2 0.203 26.8 0.316 39.8 0.195 26.5 0.165 33.1 0.209 37.6 0.233 29.7 Source: PARSTAT 1-2-3 Surveys, authors’ calculations.
Table 3: Full decomposition of the gender earnings gap accounting for selectivity
Cotonou Ouagadougou Abidjan Bamako Niamey Dakar Lomé
Offered earnings gap 1.060 % 1.237 % 0.970 % 2.050 % 0.885 % 1.361 % 0.857 %
= Log(Male earn.) – Log(Female earn.) *** *** *** *** *** *** ***
Difference due to within-sector differences in earnings attributable to:
Characteristics 0.205 19.3 0.144 11.7 0.107 11.1 0.198 9.7 0.074 8.4 0.053 3.9 0.250 29.2
Deviation in male returns 0.343 32.3 0.423 34.2 0.204 21.0 0.729 35.6 0.245 27.6 0.408 30.0 0.163 19.0
Deviation in female returns 0.334 31.5 0.490 39.6 0.235 24.2 0.956 46.6 0.355 40.2 0.547 40.2 0.009 1.0
Sub-total 0.882 83.1 1.057 85.5 0.546 56.3 1.883 91.9 0.674 76.2 1.008 74.1 0.422 49.2
Difference due to differences between sectoral location attributable to:
Characteristics 0.154 14.5 0.151 12.2 0.319 32.9 0.150 7.3 0.162 18.3 0.212 15.6 0.331 38.6
Deviation in effect of characteristics on male location 0.012 1.1 0.004 0.3 0.042 4.4 0.015 0.7 0.013 1.5 0.065 4.8 0.032 3.8
Deviation in effect of characteristics on female location 0.013 1.3 0.024 2.0 0.062 6.4 0.002 0.1 0.036 4.1 0.076 5.6 0.072 8.4
Sub-total 0.179 16.9 0.179 14.5 0.423 43.7 0.167 8.1 0.211 23.9 0.353 26.0 0.435 50.8 Source: PARSTAT 1-2-3 Surveys, authors’ calculations.
Table 4: Full decomposition of the ethnic earnings gap without correcting for selectivity
Cotonou Ouagadougou Abidjan Bamako Niamey Dakar Lomé
Actual earnings gap -0.015 % -0.537 % 0.279 % -0.182 % 0.019 % 0.068 % -0.113 %
= Log(Maj. groups earn.) – Log(Min. group earn.) *** *** *** ** ***
Difference due to within-sector differences in earnings attributable to:
Characteristics 0.014 -96.0 -0.156 29.0 0.004 1.5 -0.061 33.3 -0.049 -258.9 0.021 31.6 0.009 -8.0
Deviation in maj. group returns -0.039 262.9 -0.076 14.2 0.011 3.9 -0.029 15.9 0.019 102.8 0.034 49.9 -0.023 19.9
Deviation in maj. group returns -0.027 179.3 -0.019 3.5 0.024 8.5 -0.051 28.2 0.024 125.1 0.051 75.3 -0.009 7.8
Sub-total -0.052 346.2 -0.251 46.7 0.039 13.9 -0.141 77.4 -0.006 -31.0 0.106 156.8 -0.023 19.7
Difference due to differences between sectoral location attributable to:
Characteristics 0.018 -120.0 -0.250 46.5 0.181 64.7 -0.050 27.4 -0.008 -41.8 -0.009 -13.7 -0.015 13.2
Deviation in effect of char. on maj. group location 0.012 -78.1 -0.028 5.2 0.017 5.9 0.003 -1.7 0.017 88.0 -0.012 -17.0 -0.053 47.2 Deviation in effect of char. on min. group location 0.007 -48.2 -0.008 1.5 0.043 15.5 0.006 -3.1 0.016 84.9 -0.018 -26.0 -0.022 19.8
Sub-total 0.037 -246.3 -0.286 53.2 0.241 86.1 -0.041 22.6 0.025 131.1 -0.039 -56.7 -0.090 80.2 Source: PARSTAT 1-2-3 Surveys, authors’ calculations.
Table 5: Full decomposition of the ethnic earnings gap accounting for selectivity
Cotonou Ouagadougou Abidjan Bamako Niamey Dakar Lomé
Offered earnings gap 0.021 % -0.403 % 0.254 % -0.224 % -0.003 % 0.048 % 0.127 %
= Log(Maj. groups earn.) – Log(Min. group earn.) *** *** *** ***
Difference due to within-sector differences in earnings attributable to:
Characteristics 0.013 64.1 -0.091 22.7 0.020 -7.8 -0.042 18.8 -0.043 1335.8 0.022 45.9 0.021 16.6
Deviation in maj. group returns -0.036 -169.6 -0.029 7.1 0.016 -6.3 -0.042 18.5 0.000 14.2 0.020 42.5 0.110 86.9
Deviation in maj. group returns -0.024 -113.4 0.021 -5.1 0.001 -0.4 -0.078 34.6 -0.012 376.7 0.042 88.3 0.090 70.8
Sub-total -0.047 -218.9 -0.099 24.7 0.037 -14.5 -0.162 71.9 -0.055 1726.7 0.084 176.7 0.221 174.3
Difference due to differences between sectoral location attributable to:
Characteristics 0.029 140.8 -0.266 66.1 0.213 84.2 -0.080 35.8 -0.016 492.6 -0.009 -19.0 -0.010 -7.9
Deviation in effect of char. on maj. group location 0.023 109.6 -0.028 6.9 0.027 10.6 0.004 -2.0 0.025 -770.0 -0.007 -15.2 -0.030 -23.5 Deviation in effect of char. on min. group location 0.014 68.6 -0.010 2.4 0.050 19.8 0.013 -5.7 0.043 -1349.2 -0.020 -42.5 -0.055 -42.9
Sub-total 0.066 319.0 -0.304 75.4 0.290 114.6 -0.063 28.1 0.052 -1626.6 -0.036 -76.7 -0.095 -74.3 Source: PARSTAT 1-2-3 Surveys, authors’ calculations.
Table 6a: Ethnic Earnings Differentials
Cotonou Raw OLS Abidjan Raw OLS Niamey Raw OLS Lome Raw OLS
Fon ref. ref. Akan ref. ref. Djerma ref. ref. Ewe-Mina-Wachi ref. ref.
Adja -0.077 0.035 Krou 0.020 -0.025 Haoussa -0.004 -0.068 Akposso-Akebou 0.121 -0.003
(0.039)* (0.031) (0.061) (0.045) (0.044) (0.035)* (0.136) (0.111)
Dendi 0.373 0.467 Mande N -0.268 -0.013 Peul 0.167 0.041 Ana-Ife 0.126 0.005
(0.135)*** (0.107)*** (0.054)*** (0.042) (0.083)** (0.065) (0.107) (0.087)
Yoa -0.498 -0.213 Mande S -0.112 -0.035 Touareg -0.237 -0.102 Kabye-Tem 0.058 0.001
(0.147)*** (0.116)* (0.090) (0.067) (0.089)*** (0.070) (0.055) (0.045)
Yoruba 0.193 0.102 Volta -0.300 -0.086 Gourma 0.542 0.240 Para-Gourma-Akan 0.068 0.028
(0.051)*** (0.040)** (0.069)*** (0.052)* (0.285)* (0.223) (0.092) (0.075)
Other 0.033 0.009 Native of -0.414 -0.124 Other -0.143 -0.046 Other Togolese -0.042 0.062
(0.062) (0.049) Burkina (0.045)*** (0.037)*** (0.075)* (0.059) (0.191) (0.156)
Missing -0.333 0.084 Missing -0.259 -0.075 Other Non 0.297 0.276
Ouagadougou Raw OLS (0.250) (0.186) (0.199) (0.156) Togolese (0.081)*** (0.066)***
Mossi ref. ref.
Bissa 0.379 0.093 Bamako Raw OLS Dakar Raw OLS Standard errors in parentheses
(0.095)*** (0.070) Bambara ref. ref. Wolof ref. ref. * significant at 10%
Bobo 0.561 0.168 Malinke 0.057 0.039 Lebou 0.032 0.034 ** significant at 5%
(0.165)*** (0.120) (0.052) (0.043) (0.063) (0.050) *** significant at 1%
Other Manding 0.555 0.136 Peul 0.220 0.081 Serere -0.271 -0.190
(0.092)*** (0.068)** (0.054)*** (0.044)* (0.046)*** (0.036)***
Dagari 0.474 0.083 Sarakole 0.245 0.182 Diola -0.088 -0.103
(0.155)*** (0.113) (0.060)*** (0.049)*** (0.068) (0.054)*
Gourmantche 0.781 0.197 Songhai 0.436 0.110 Manding 0.009 -0.020
(0.178)*** (0.130) (0.104)*** (0.085) (0.081) (0.064)
Gourounsi 0.613 0.073 Dogon -0.042 0.009 Sarakole 0.117 -0.054
(0.099)*** (0.073) (0.091) (0.074) (0.101) (0.080)
Senoufo 1.335 0.370 Bobo 0.006 -0.069 Mandjag -0.073 -0.005
(0.203)*** (0.149)** (0.107) (0.087) (0.102) (0.081)
Peul 0.552 0.161 Senoufo 0.398 0.051 Peul -0.016 -0.032
(0.137)*** (0.100) (0.093)*** (0.077) (0.044) (0.035)
Other 0.498 0.109 Arab 0.450 0.078 Missing 0.075 -0.024
(0.117)*** (0.086) (0.149)*** (0.122) (0.065) (0.052)
Missing -0.141 -0.130 Haoussa 0.303 0.126
(0.209) (0.152) (0.102)*** (0.083)
Missing 0.109 0.126
Table 6b: Ethnic Earnings Differentials – Control Variables
Cotonou Ouagadougou Abidjan Bamako Niamey Dakar Lome
Women = 1 -0.495 -0.525 -0.507 -0.464 -0.314 -0.370 -0.425 (0.026)*** (0.028)*** (0.028)*** (0.030)*** (0.031)*** (0.025)*** (0.033)*** Education 0.046 0.100 0.028 0.045 0.077 0.066 0.030 (0.007)*** (0.008)*** (0.008)*** (0.009)*** (0.009)*** (0.007)*** (0.010)*** Education2 0.004 0.004 0.007 0.004 0.004 0.003 0.006 (0.000)*** (0.001)*** (0.000)*** (0.001)*** (0.001)*** (0.000)*** (0.001)*** Potential experience 0.038 0.067 0.051 0.062 0.052 0.066 0.052 (0.004)*** (0.004)*** (0.004)*** (0.004)*** (0.004)*** (0.003)*** (0.004)*** Potential experience2 -0.039 -0.073 -0.049 -0.065 -0.047 -0.073 -0.057 (0.006)*** (0.006)*** (0.007)*** (0.006)*** (0.005)*** (0.005)*** (0.007)*** Maried = 1 0.043 0.160 0.120 0.093 0.067 0.059 0.032 (0.026)* (0.031)*** (0.029)*** (0.031)*** (0.032)** (0.028)** (0.032) Constant -2.725 -3.549 -2.568 -3.013 -3.086 -2.769 -3.311 (0.060)*** (0.061)*** (0.066)*** (0.063)*** (0.069)*** (0.053)*** (0.070)*** Observations 4209 3774 4060 3928 3295 4929 3600 R-squared 0.39 0.50 0.47 0.35 0.40 0.37 0.34
Standard errors in parentheses