Contents lists available atScienceDirect
Building and Environment
journal homepage:www.elsevier.com/locate/buildenvProjecting the impact of climate change on design recommendations for
residential buildings in Iran
GholamReza Roshan
a, Rohollah Oji
b, Shady Attia
c,∗ aDepartment of Geography, Golestan University, Gorgan, IranbDepartment of Geography, Gilan University, Gilan, Iran
cSustainable Building Design Lab, Dept. UEE, Faculty of Applied Science, Université de Liège, Belgium
A R T I C L E I N F O Keywords: Future climate Bioclimatic chart Bioclimatic design Energy consumption Thermal comfort A B S T R A C T
The outdoor climate is changing. In order to assure thermal comfort in new and existing residential buildings we need to revise and adapt our building designs. Therefore, 10 meteorological stations in Iran were selected to investigate and predict the influence of climate change on the local climate diversity and variability. In order to provide a comfortable and healthy indoor environment, bioclimatic design recommendations during early design stages were revised, in-cluding during the two periods of 1986–2015 and 2020–2050. A modified Givoni's bioclimatic chart was used to visualize the climate variation and to inform designers about accurate and climate-proof bioclimatic design re-commendations. The second-generation Canadian Earth System Model was used to predict changes in the maximum and minimum temperature and relative humidity components of future decades. Based on Representative Concentration Pathway (RCP) 2.6, RCP 4.5, and RCP 8.5 for the greenhouse gas emission section of the Fifth Assessment Report of the Intergovernmental Panel on Climate Change, the effects of climate change on different cooling and heating strategies were examined. The findings of this study showed that for all the studied stations, apart from Abadan, the trend in temperature increase over the coming decades is not unforeseen. The use of heating strategies will decrease, and the use of cooling strategies will increase. Finally, this study presents an adjusted bioclimatic chart of Iran and quantifies the adaptation measures to climate change to reduce energy use and avoid overheating.
1. Introduction
Several studies investigated climate responsive design and its in-fluence of on the indoor and outdoor built environment [1,2]; and [3]. The earliest work of Victor [3] allowed architects, engineers and urban planners to explore the impact of climate on buildings design and follow analytical approaches to develop bioclimatic design concepts. Therefore, several researchers and practitioners applied [1,3] biocli-matic design approach by performing climate analysis studies and use the bioclimatic architecture principles in order to improve thermal comfort conditions in outdoor spaces. The determination of bioclimatic design principles and bioclimatic zones was achieved by Refs. [4,5] in Greece [6], in Albania [7], in Turkey [8], in Egypt [9], in Portugal [10], in Iran [11,12], in India [13], in Italy and [14] in Madagascar.
However, few studies considered the influence of climate change on the outdoor built environment in relation to bioclimatic design. The Fifth Assessment Report (AR5) of the Intergovernmental Panel on Climate Change (IPCC) asserts that climate change is occurring worldwide [15]. Between 1906 and 2014 the global temperature
increased from 0.56 °C to 0.92 °C. Eleven of the twelve hottest years between 1850 and 2014 occurred in the last fifteen years [15]. The planet is expected to face increases in temperature of an average of 0.2 °C every ten years until the end of this century. One of the most famous studies that addressed climate change on the indoor built en-vironment is the study of [16,18–21]. The three studies investigated the direct effect of climate change on indoor thermal comfort and energy consumption. In the same, context the work of [21,22] provided a broader perspective by developing an overview of challenges and achievements in the climate adaptation of cities. And the work of [23–25] provided more specific design recommendations within a technical landscape design and urban planning perspective. These stu-dies did not provide predictions for the future outdoor climate. Our critical review of the body of knowledge indicates a lack of investiga-tion on future climate predicinvestiga-tions and their impacts on bioclimatic design recommendations. There is a need for a revision of climate de-sign recommendations following quantitative prediction methods.
Therefore, this paper aims to improve our understanding of climate change impacts and to improve decision making for planners, landscape
https://doi.org/10.1016/j.buildenv.2019.03.053
Received 30 January 2019; Received in revised form 23 March 2019; Accepted 25 March 2019
∗Corresponding author.
E-mail address:shady.attia@uliege.be(S. Attia).
Available online 30 March 2019
architects, architects and building engineers. Whether we face the challenge through designing for cooler cities worldwide it's clear we will all need to think more about heat in the coming century. The re-search outcome is a set of updated and climate-change-proof design recommendations for Iran. We believe that climate-change-proof weather files and updated bioclimatic design strategies go together as an adaptation measure in the building sector. The significance of this research is based on its promotion of evidence-based and sustainable design principles and strategies to encourage designers to create cli-mate-sensitive and context-specific architectural and building solutions [26]. In addition, the methodology used in this research is significant and can be transferred to other regions of the world. The audience of the study, besides designers, is policy makers, city officials, and home builders who wish to build or renovate building facilities in hot and arid climates.
2. Bioclimatic charts and climate change adaptation measures In this section, we review different bioclimatic charts that are most commonly used to represent and plot climate data points (e.g., Refs. [1,27,28]. This step is an extremely important endeavor to enable the representation and visualization of building energy implications of climate. The visualization of climate data through graphic illustrations and climate data analysis is important for communication. It allows users to see subtle distinctions of climate and their associated biocli-matic design strategies that would otherwise be lost in numerically represented data. The second step of this review articulates and high-lights the climate change adaptation measures for residential areas (see Section4.2). The aim was to provide an overview of 16 key passive cooling and heating adaptation strategies.
2.1. Climate representation through bioclimatic charts
Several researchers and engineers have tried to visualize climatic data worldwide [29]; [1,27,30,31]. Until the end of the 1960s, the psychrometric chart was one of the most prominent representations, which was mainly developed and used by mechanical engineers. This was until 1969, when Givoni presented his building bioclimatic dia-gram on the psychrometric chart. Givoni's bioclimatic diadia-gram is di-vided into different zones, for which it is necessary to use bioclimatic and passive design strategies to achieve human comfort within a building. The building bio-climatic chart (BBCC) specified building design guidelines to maximize indoor comfort conditions when the building's interior was not mechanically conditioned [1]. Building de-sign strategies that were mentioned in Givoni's original bioclimatic chart are shown inTable 1[30]. Milne and Givoni amended and ex-panded the BBCC in 1979 [1], in which more zones were determined to make design suggestions for architects. This chart defined passive and active design strategies, including those shown inTable 1[32].
Since then, the Milne-Givoni BBCC has been widely used in practice and research [10,33–35]. The BBCC has been used as a tool to select proper strategies of bioclimatic design for specific climatic conditions. Later, research by Givoni on passive cooling and low energy buildings provided more information and a better scientific basis for demarcation of climatic conditions, under which different design strategies for
strategies and defined new concepts, such as direct and indirect eva-porative cooling [31]. However, after 20 years of modifications the BBCC became complex. The complexity of visualizing its seven axes and 14 design recommendations confused users, particularly architects, when trying to interpret it (Table 2) [10].
DeKay and Brown presented another graphical illustration [27]. redrew Givoni's bioclimatic chart using the structure of Olgyay's chart (1969); they implemented Milne-Givoni's different and diverse strategy zones in Olgyay's rectangular chart. In this chart, five cooling strategies and two heating strategies are included. In the present study, we redrew the proposed bioclimatic chart of DeKay and Brown more precisely [27] to investigate its potential. According to Milne-Givoni and the new Givoni's chart, seven strategies were added:
•
One passive heating strategy and conventional (active) heating strategy.•
Three cooling strategies of direct/indirect evaporative cooling, (active cooling) air conditioning, and air conditioning with con-ventional dehumidification.•
Humidification for dry climatic conditions.•
ShadingAccording to the last study by Givoni regarding new boundaries of the chart, our new chart was drawn as shown inFig. 1. We selected this bioclimatic diagram for its simple use and interpretation by architects [14]. Even though internal gains are regularly included in the biocli-matic analysis (e.g. Givoni's bioclibiocli-matic chart) they are not climate determined and therefore should not be stated as bioclimatic potential when climate determined bioclimatic analysis are conducted [74]. At the same time, the DeKay and Brown bioclimatic chart incorporates 12 different climate zones that correspond to different design strategies. This variety makes it easier to compare weather data with a focus on mean daily temperature (°C) and humidity (%).
Based on the abovementioned continuum, we selectedFig. 1as the most suitable climate representation of a bioclimatic chart. The proposed bioclimatic chart was used to plot the climatic data of future climate change weather scenarios while clustering the data points under the corresponding bioclimatic design strategies and recommendations. 2.2. Climate of Iran and climate change adaptation design strategies
Iran is characterized as having a variety of climates while being hot and dry during summers and cool during winters. The country is in Southwest Asia and its climate is influenced by the subtropical aridity Abbreviations
AR5 Fifth Assessment Report BBCC Building Bio-Climatic Chart
CanESM2 Second Generation Canadian Earth System Model CCCma Canadian Centre for Climate Modelling and Analysis CMIP5 Coupled Model Intercomparison Project Phase 5
GCM General Circulation Model GHG Greenhouse Gas Emissions
HadCM3 Hadley Centre Coupled Model, version 3 IPCC Intergovernmental Panel on Climate Change RCP Representative Concentration Pathway SKNN Sequential K-Nearest Neighbor
Table 1
comparison of the BBCC of 1976 and 1979 and the corresponding design straggles and measures.
First BBCC [30] and the corresponding
design strategies: Second BBCC [corresponding design strategies:32] and the
•
Natural Ventilation•
Evaporative cooling•
Humidification•
Air conditioning•
Active heating•
High thermal mass•
High mass with nighttime ventilation•
Natural and mechanical ventilation•
Dehumidification•
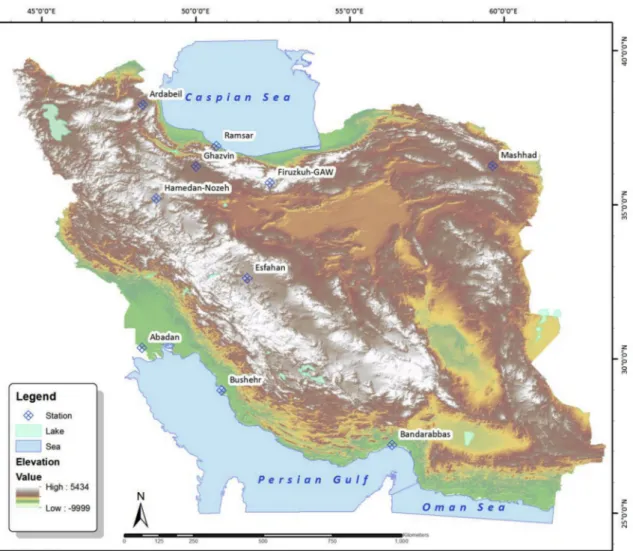
Passive solar heatingof the Arabian Desert and the subtropical humidity of the eastern Mediterranean area. Iran covers several types of climates and hosts two major mountain ranges, namely Alborz in the north and Zagros in the west (Fig. 2). The country has a semi-dry climate, except for the wet zone in the southern coastal plains of the Caspian Sea and the relatively wet areas in the west [37], as indicated inFig. 2. The Alborz and Zagros mountain ranges block humidity and prevent clouds from reaching the central and southeastern parts of the country, including the Eurasian Plate. The continental climate across the plateau is characterized by cold winters and hot summers [37].
The predicted climate change differs by continent, country, region, and urban centre. Iran is one of the countries that will be affected by climate change (see Section 2.2). Research on the effects of global
warming on energy consumption, buildings, and thermal comfort in Iran has been undertaken by a small number of researchers [38,75]. However, a lot of research has been conducted on climate change in Iran [39–41]. The most important measure to indicate climate change in Iran is the yearly number of heat waves. Between 1981 and 2010, the intensity of heat waves in summer became more severe than in spring, and extreme heat waves occurred across the southern coast of Iran. On average, there are about 4 more heat waves in summer than in spring [42]. Moreover, in the future it is likely that the Iranian climate will be subject to a continuous increase in temperatures, mild winters, and hot summers. Heat waves will become more common and associated with an increase in energy consumption for cooling in households until the end of the century [38]. Therefore, urban heat will increase with the use of certain building materials, street profiles, building shape, and urban fabric. The incoming shortwave radiation will be mainly stored in building materials and will be emitted as longwave radiation into the buildings and urban microclimate. This will lead to the aggravation of urban heat islands and will cause damages or failure of infrastructure (increases in cooling demand and electricity shortages), thermal dis-comfort, low productivity, health challenges (respiratory, heart, and kidney problems), and extra deaths [40,43–45]. An increase in energy use of buildings with active cooling systems is expected during sum-mers, and a decrease in heating loads is expected during winters.
In this section, we discussed the selection of key bioclimatic climate change adaptation design strategies based on a previous study by the authors. A study by Ref. [10] defined 17 design strategies associated with 17 climatic zones in Iran.Table 2provides a summarized overview of the 16 considered adaptation measures.
3. Materials and methods
In this section we present the research methodology, including the study framework, weather station data selection process, data analysis, and validation.
3.1. Study framework
The framework of this study was built around four axes in the context of projecting the impact of climate change on bioclimatic de-sign measures for residential buildings. The framework adapted in this research borrowed from the review continuum presented in Section2. The framework focused on four key approaches to prepare the climate change files and assess the expected changes in every climatic region:
1. Ten Iranian cities were selected in order to evaluate the effect of climate change on the indoor cooling and heating strategies of buildings. The adaptation of cooling and heating strategies was evaluated and visualized based on Givoni's bioclimatic chart (see Section3.2).
2. The second-generation Canadian Earth System Model (CanESM2) was used to predict changes in the maximum and minimum tem-perature and relative humidity components of future decades (CCCma 2018) [17]. The study period was divided into two cate-gories, namely the present (1986–2015) and the future (2020–2050), and the results were compared for each period (see Section3.3).
3. Results of the CanESM2 model were downscaled using the sequen-tial k-nearest neighbor (SKNN) method (see Section3.4).
4. The results of Representative Concentration Pathway (RCP) 2.6, RCP 4.5, and RCP 8.5 scenarios were used to examine the effects of climate change in future decades on different cooling and heating strategies (see Section3.5).
Fig. 3illustrates a detailed flow chart of the research endeavor. The Table 2
Introduce of Givoni's BBCC cooling and heating strategies.
Zones Givoni's Building Bioclimatic Chart Cooling and Heating Strategies Z1 Conventional Heating (Active Heating)
Z2 Conventional Heating (Active Heating) + Humidification Z3 Active Solar Heating + Humidification
Z4 Passive Solar Heating + Humidification Z5 Humidification
Z6 Active Solar Heating Z7 Passive Solar Heating Z8 Comfort
Z9 Natural Ventilation Z10 Shading
Z11 Air Conditioning (Active Cooling) + Conventional Dehumidification Z12 Natural Ventilation + High Thermal Mass + Night Ventilation + Direct
& Indirect Evaporative Cooling
Z13 Direct & Indirect Evaporative Cooling + High Thermal Mass + Night Ventilation
Z14 Direct & Indirect Evaporative Cooling + Thermal Mass + Night Ventilation
Z15 Direct & Indirect Evaporative Cooling Z16 Air Conditioning (Active Cooling)
Fig. 1. a modified version of the building bioclimatic chart of Givoni developed by authors to include 14 design recommendations.
figure illustrates the earliest steps comprising the initial definition of climate data, passing by the downscaling of climatic parameters until the application of the psychrometric chart and comparison of biocli-matic design measures.
3.2. Weather files and selected cities
For this study, meteorological data were obtained from the Iran Meteorological Organization [46]. Overall, we distinguished 16 zones (Z1iZ16) based on Givoni's chart, as shown inTable 2. The boundaries of the zone to ensure indoor comfort, which are demarcated on the BBCC, were based on the expected indoor temperatures of buildings without the intervention of active cooling and with still air (0.15 m/s in winter and 0.25 m/s in summer) [1]. According to the Köppen climate classification, Table 3andFig. 2show sites selected for each climate classification.
Meteorological variables affect humans' perception of thermal comfort. In addition, non-meteorological factors, such as clothing, ac-climatization, fitness and activity level, and physiological adaptation to an environment also influence the heat balance of the human body [47,48]. Givoni presented his building bioclimatic diagram on the psychrometric chart based on temperature and relative humidity. Therefore, personal factors, wind, and radiation effects were not con-sidered in the calculations of comfort days and bioclimatic design strategies in Givoni's diagram. A study by Ref. [10] defined 17 design strategies associated with 17 climatic zones in Iran. For this study, we adopted the 16 design strategies, omitted ‘internal gains’ and added
‘shading’ as a new climatic zone. Table 3 provides a summarized overview of the 16 considered adaptation measures. Z8 was considered the comfort zone. It was determined in the same way as other biocli-matic zones, namely by the intersection of two components of relative temperature and relative humidity on Givoni's diagram. As presented in Section 4.1, the days when the temperature and relative humidity confluence fell into the comfort zone were presented as comfort days. 3.3. Sequential k-nearest neighbor method
[49] proposed a cluster-based imputation method to simulate the missing values of DNA micro-array data that is called Sequential K-Nearest Neighbor (SKNN) algorithm. This method [50] separates the dataset into two complete and incomplete sets with missing or without missing values respectively. The data in incomplete set are imputed by the order of missing rate that is the missing values are ranked from the fewest number of missing. Starting with the fewest number of missing values, this missing value is filled by the weighted mean value of corresponding column of the nearest neighbor of corresponding row in complete set. Then by taking into account the first imputed value, the process is repeated until all missing values are imputed. Although this method uses imputed values, due to its computational accuracy and complexity, its efficiency has significantly improved compared to the conventional KNN method and methods based on estimating maximum probability. Since this method can select more cases than the most commonly used KNN methods, in many experiments [49–51], SKNN performed better than other methods of imputation. Fig. 2. Distribution of the studied stations across Iran's zone.
It can be used as a multisite downscaling method in regional climate change studies due to the preservation of covariance among the vari-ables and the local meteorological stations. In the present study, we applied SKNN method to downscale time series of future daily relative humidity as well as mean temperature of 10 synoptic stations in Iran. To do this end, a set of daily global simulation of CanESM2 (Table 4) based on the CMIP5 model projections as well as the local measure-ments of the quantity of interest were considered as predictors and predictands respectively. We used station data from three decades (1961–1990) for calibration and from two and a half decades (1991–2014) for validation of daily values of mean temperature, and daily relative humidity. The sensitivity of the method to large-scale anomalies and its ability to replicate the observed data distribution in
the validation period are separately tested for the variables by Pearson correlation and Kolmogorov–Smirnov (KS) tests, respectively. Com-bined tests are used to assess overall model performances.
Results showed that the method performed well both in terms of temperature and relative humidity downscaling. However, SKNN Fig. 3. Study conceptual framework.
Table 3
The Köppen climatic classification of cites selected whose data was used in the present study.
City name Type of the Köppen climatic classification Climate description
1 Bandarabbas Aw Tropical wet and dry or savanna climate
2 Bushehr BSh Hot semi-arid climate
3 Mashhad BSk Cold semi-arid climate
4 Abadan BWh Hot desert climate
5 Esfahan BWk Cold desert climate
6 Ramsar Cfa Humid subtropical climate
7 Ghazvin Csa Hot-summer Mediterranean climate
8 Ardabeil Csb Warm-summer Mediterranean climate
9 Hamedan-Nozeh Dsa Hot, dry-summer continental climate
10 Firuzkuh-GAW Dsb Warm, dry-summer continental climate
Table 4
The predictor fields.
GCM Filed Resolution Time step RCPs Other property CanESM2 rhs, tas 2.7906° *
2.8125° Daily 2.6, 4.5 and8.5 360 dayCalendar Tas Daily Near-Surface Air Temperature, rhs Near-Surface Air Temperature.
downscaled temperature better than relative humidity and model per-formance varied across the study region. It worth noting that in this study, SKNN is developed based on SeqKnn version 1.0.1 [50] package in R programming environment.
3.4. Climate change scenarios
In order to define bioclimatic design strategies for passive cooling and heating of Iran's settlements, we presented these strategies using current period (1986–2015) and future period (2020–2050) data on the basis of three different climatic scenarios. Scenarios have long been used by planners and decision makers to analyze situations in which outcomes are uncertain. The IPCC prepared comprehensive Assessment Reports about knowledge on climate change, its causes, potential im-pacts and response options. The Assessment Reports provide an over-view of the state of knowledge concerning the science of climate change. The first Assessment Report 1 (AR1) was released in 1990 and latest report was released in 2014, emphasizing new results since the publication of the previous reports. In preparation for the AR5, re-searchers developed a new approach for creating and using scenarios in
climate change research [15]. The international climate modelling community has adopted four RCP scenarios according to the IPCC re-port [52]; [53]. The scenarios are as follows:
•
RCP 8.5, which corresponds to a “non-climate policy” scenario that leads to high-severity climate change impacts and a rising radiative forcing pathway leading to 8.5 W/m2in 2100.•
RCP 2.6, which is a future requiring stringent climate policy to limit GHGs that leads to low-severity, impacts. There is a peak in radia-tive forcing at about 2.6 W/m2before 2100, and then a decrease.•
RCP 4.5, which foresees stabilization without overshoot pathway to4.5 W/m2before 2100.
•
RCP 6, which foresees stabilization without overshoot pathway to 6 W/m2at 2100.For this study, RCPs 4.5 and 6.0 were selected by the IPCC to be evenly spaced between RCPs 2.6 and 8.5. Together, these scenarios represented the range in radiative forcing available in the peer-re-viewed literature at the time of their development in 2007 and [53]. In the present study, we used RCPs 2.6, 4.5, and 8.5.
3.5. Limitations
The analysis presented by the authors is conducted without con-sidering the impact of solar radiation on the executed bioclimatic analysis. We realize that the solar radiation can improve the predicted by a bioclimatic potential analysis according to Refs. [14,54,55]. However, we projected changes in the maximum and minimum tem-perature and relative humidity components of future decades.
Also, it is worth noting that in the process of downscaling of the re-quired variables, the effect of large-scale changes (GCM) as well as the local variations (observational data) effect was reflected. The selected stations are located within the urban areas and their climates are well represented. However, the purpose of our study is the projection of long-term significant local and regional effects of global warming; therefore, our study does not pay much attention to the urban microclimate. Because urban micro-climate will eventually be affected by the local climate and will be intensified or weakened by that. Therefore, our study was context-specific, but it exposed the changes that will influence in-door comfort in residential buildings. The results of this study should be extended to investigate the implication of climate change on outdoor climate in relation to urban heat island effect phenomenon including precise consideration of solar irradiation influence [54,56,57] and [55]. Climate-sensitive selection of bioclimatic design strategies such as the shape and materials of the urban fabric and building envelopes can help
avoid urban heat and overheating consequences indoors. Also, the in-crease of urban shading and vegetation through landscape design and specific passive cooling strategies and solution can improve the micro-climate conditions outdoors [56,58,59].
4. Results
4.1. Comparison of the projected meteorological components with the base period
For the analysis, we compared the long-term average annual tem-perature and relative humidity components for the two base and future periods. First, the temperature component changes were noted. Based onFig. 4a, it was shown that an increase in average annual temperature for all stations was expected in future decades. The base temperature for the observation period of this station was 45.38 °C, while the average of the results of the three scenarios indicated a temperature decrease of 2.5 °C for the 2020–2050 periods. For all stations, all sce-narios indicated that the temperature component would increase in future decades. This increase in temperature for the RCP 8.5 scenario was the most incremental. The RCP 2.6 scenario showed the smallest increase in temperature compared with that of the other scenarios. At the same time, the outputs for all stations indicated that there was little difference between RCP 8.5 values and RCP 2.6 values. However, the
results of the simulations showed that the highest temperature increase for the next decade compared with the observational period was for Ardabil station. At this station, based on the RCP 8.5 scenario, a 3.73 °C temperature increase was observed compared to the observational base period. On the other hand, the lowest annual temperature increase was simulated for Bandar Abbas; based on the RCP 8.5 scenario, this tem-perature increase was 0.33 °C compared with the observational base period (Fig. 4).
Additionally, an assessment of the relative humidity results for the study stations was conducted. Based onFig. 4b, it was observed that for Abadan, Ardabil, Ghazvin, and Hamadan stations, the average annual relative humidity values for future decades was expected to increase compared to those of the observational base period; the maximum re-lative humidity increase compared to that of the other stations was projected for Ardabil station (RCP 8.5 = 6.60%). The minimum relative humidity increase (RCP 8.5 = 0.62%) was simulated for Hamadan. On the other hand, for Firoozkooh, Isfahan, Bushehr, Ramsar, Bandar Abbas, and Mashhad stations, a decrease in annual average relative humidity was predicted. Overall, the relative humidity changes based on different climate change scenarios did not follow a specific pattern. Thus, we expect that based on the RCP 2.6 scenario, there should be a continuous increasing trend until the end of RCP 8.5.
4.2. Comparing bioclimatic design recommendations for current and future periods
In this section, different passive cooling and heating strategies were evaluated in order to provide comfort within buildings for two different
periods based on three climate change scenarios (Fig. 5).
For the observational base period, outputs for the Abadan station indicated that there was no need to apply Z1 to Z3 heating strategies to this station. On the other hand, the Z5 strategy, which is use of humi-dification and Z15 and Z16 strategies, was also inefficient at providing indoor cooling energy for this station. In summary, the most re-commendations for energy use for Abadan belonged to the Z13 direct and indirect evaporative cooling, high thermal mass and night venti-lation, which accounted for 17.5% of the total data. This was followed by the Z7 passive solar heating strategy, which accounted for 12.4%. Based on the three RCP scenarios, simulated data for the 2020–2050 periods showed that considering global warming, there is still no need for Z1, Z2, Z3, Z5, Z15, and Z16 strategies. On the other hand, in contrast to the base observational period, the most important biocli-matic strategy for homes was also passive solar heating (Z7). Unlike the base period, the most important indoor cooling energy strategy was the Z13 solution, but for future decades and based on the three observa-tional scenarios, the most important indoor cooling solution was Z14, which includes direct and indirect evaporative cooling, thermal mass, and night ventilation. The next most important solution was the Z13 strategy (Table 5) (seeTable 6).
The comparison of different bioclimatic design recommendations for current and future periods is summarized as follows:
•
At Ardebil station, there was no need for Z12 to Z16 strategies to provide indoor cooling. It was projected that the effect of global warming at Ardebil station will lead to a decrease in heating energy needs within buildings in future decades (Figure A1a).Table 5
presenting a summary of the features of bioclimatic zones of Iran. The future projected values as relative changes in respect to the current period in percent (%). Zones Abadan Ardebil Bandarabbas Bushehr Esfahan Firouzkooh Ghazvin Hamedan Mashhad Ramsar Future period; 2020-2050- Scenario RCP 2.6 Z1 0.02 −13.88 −0.15 −0.12 −1.98 −3.65 −2.31 −1.66 −3.24 −0.39
Z2 0 −0.03 0 0 0.18 −0.26 −0.03 −0.27 0.09 0 Z3 0.05 −0.06 0 0 −0.68 −0.97 −0.57 −0.86 0.17 0 Z4 0.24 0.35 0.04 0.03 −1.26 −3.68 −1.69 −1.86 0.92 0 Z5 −0.02 0.15 0.31 0 −0.67 2.18 −1.19 −0.73 0.63 0 Z6 0 0 0.13 0 −0.05 0.15 0 −0.08 0.16 0 Z7 −0.05 −5.67 0 0.02 0.45 1.67 1.83 1.11 −1.2 −1.57 Z8 −1.44 −0.44 0.08 −1.25 0.47 1.81 1.04 1.27 −1.7 −0.7 Z9 −1.53 17.14 −1.08 −1.64 0.24 1.87 1.23 −0.41 −2.3 −0.5 Z10 −2.68 1.44 −0.89 −2.26 0.86 0.86 1.63 3.46 3 1.1 Z11 0.02 0.58 −0.72 −0.5 0 0 0 0 0.04 0.1 Z12 0.78 0.5 −1.6 4.22 0 0 0.01 0 0.03 0.79 Z13 −0.94 0.01 1.65 −0.38 2.26 0 0.4 0.03 2.76 1.17 Z14 −1.8 0 1.57 0.81 0.93 0 −0.02 0 0.16 0 Z15 7.43 0 0.48 1.16 0 0 0 0 0 0 Z16 0.02 0 0.18 0 −0.65 0.13 −0.14 0.11 0.64 0 Z17 0 0 0 0 0 0 0 0 0 0
Future period; 2020-2050- Scenario RCP 4.5 Zones Abadan Ardebil Bandarabbas Bushehr Esfahan Firouzkooh Ghazvin Hamedan_ Mashhad Ramsar
Z1 0.03 −13.61 −0.16 −0.11 −2.18 −3.33 −2.45 −1.87 −3.34 −0.42 Z2 0 −0.07 0 0 0.19 −0.4 −0.02 −0.31 0.08 0 Z3 0.04 0.01 0 0 −0.55 −1.21 −0.64 −0.68 0.16 0 Z4 0.22 0.37 0.04 0.04 −1.1 −3.89 −1.76 −1.92 1.12 0 Z5 −0.01 0.14 0.28 0 −0.61 2.36 −1.19 −0.8 0.5 0 Z6 0 0 0.09 0 0 0.16 0.01 −0.03 0.17 0 Z7 −0.01 −5.82 0 0.01 0.25 1.74 1.9 1.24 −1.04 −1.35 Z8 −1.82 −0.44 0.03 −1.28 0.4 1.82 1.06 1.21 −1.62 −0.67 Z9 −1.8 17.13 −1.31 −1.71 0.2 1.75 1.13 −0.61 −2.74 −0.91 Z10 −2 1.54 −0.37 −2.51 0.37 1 1.88 3.67 3.05 1.39 Z11 0.07 0.5 −0.92 −0.46 0 0 0 0 0.04 −0.13 Z12 0.89 0.36 −1.3 4.65 0 0 0.01 0 0.04 0.84 Z13 −1.47 0.01 1.31 −0.51 2.66 0 0.49 0.02 2.82 1.36 Z14 −1.74 0 1.69 0.84 0.99 0 −0.05 0 0.19 0 Z15 7.68 0 0.49 1.15 0 0 0 0 0 0 Z16 0.01 0 0.15 0 −0.51 0.1 −0.17 0.18 0.79 0 Z17 0 0 0 0 0 0 0 0 0 0
•
For Bandar Abbas station, due to the high temperature and humidity for most of the year, Z11 (air conditioning and conventional dehu-midification) was the most important design strategy. As shown in Figure A1a, relative humidity decreased slightly for future decades, with up to a 2% reduction compared to the base period.•
At Bushehr station, observational data showed that the passive solar heating solution had the maximum occurrence (25.8%) compared to other zones. Based on all three RCP scenarios, it was projected that the need for using the Z11 bioclimatic solution (air conditioning and conventional dehumidification) will increase by approximately 4.5% (Fig. 5b).•
At Isfahan station, a similarity was found between empirical data and simulated future data. The results indicate that for the ob-servational period, the frequency of use of passive solar heating and humidification was the highest (11.8%). The use of the passive solar heating strategy was projected to be the most important bioclimatic strategy for future decades.•
Firoozkooh station is one of the few stations in Iran that does not have a need for cooling. For future decades, the use of passive solar heating can provide indoor comfort. In some of the bioclimatic recommenda-tions, Ghazvin station was also like Firoozkooh (Figure A1b).•
For Hamadan station, conventional heating, with 21.5% of data frequency, was the most important bioclimatic design measure. The overall average of the results of RCP scenarios indicated a 2% fre-quency reduction for the occurrence of this zone.•
The findings of Mashhad station showed that for both observational and future periods, the maximum occurrence was related to passive solar heating. The percentage of occurrence for these two zones was expected to decrease in the future (Fig. 5c). For the future, Z12 was expected to increase by almost 3% on average for all three scenarios (Table 5).•
Using the outputs ofTable 5for Ramsar, the same results were ob-tained for the current and future periods (Figure A1c). For both periods, there was no occurrence of the heating strategies of Z2. Additionally, the climatic conditions confirmed the fact that Z13–Z16 cooling strategies were not effective for this station. The maximum frequency of data for both periods belonged to Z7, even though the frequency of these two zones decreased slightly in the future. 4.3. Examining the effect of global warming on the variation in indoor cooling and heating strategiesAs shown inFigure 5a, the need for indoor heating for all future scenarios decreased compared with that for the observational period.
Among all the study stations, Mashhad had the greatest decrease in the use of heating strategies. For this station, outputs based on the total average of all scenarios simulated a 6.7% decrease in the use of total heating strategies for future decades. However, given the simulated data for future decades, it was found that Bandar Abbas had the least variability in the use of bioclimatic indoor heating recommendations. According to the overall average of the three RCP scenarios, only a 0.9% reduction in the use of these strategies was projected for future decades. According to the observational data, the lowest need for passive heating strategies was calculated for Bandar Abbas, Bushehr, and Abadan, with 33%, 34% and 34%, respectively. However, the greatest need for heating strategies was found for Firoozkooh (99.6%) and Ardabil (97%) (Fig. 5a). The outputs of Fig. 5b indicated the future need to use passive strategies to achieve indoor cooling. According to the total average of RCPs, the highest increase was simulated for Bushehr and Abadan, with 5.6% and 5.5%, respectively, and the lowest increase of 0.1% was simulated for Firoozkooh, followed by Hamadan and Ghazvin with 0.2% and 0.3%, respectively. However, the base data showed that Bandar Abbas had the greatest need for cooling strategies with a total of 53% frequency. Firoozkooh had almost no need for these cooling strategies to provide indoor comfort.
In fact, the stations of Bandar Abbas, Bushehr and Abadan are part of the southern stations of Iran and adjacent to the body of water of Persian Gulf, whose climatic conditions are heavily dependent to this body of water. With regard to global warming, outputs indicate a rise in tem-perature for these stations for decades to come. Therefore, it is expected that as the temperature rises, the moisture content of the bar increases. Therefore, combining high temperatures with moisture injected from the Persian Gulf can increase the condition of sultry that this can increase the occurrence of thermal stress for decades to come. These conditions, especially in the warmer months of the year, have a high potential, which can exacerbate the reduction of thermal comfort days. But this tem-perature increase mechanism, especially for the warm seasons of the year, has led to an increase in the length of this period for the seasons of the climate transition. Transitional seasons mean the conversion of the atmospheric pattern from summer warm conditions to autumn cold conditions, which will begin with a delay based on this mechanism. Although early autumn at these three stations, the air temperature has not yet been cold. But the severity of the temperature increase has been reduced. Therefore, it is projected that the length of the warm seasons of the year will increase over the coming decades, and if there were thermal comfort in the early autumn. Then with these rising temperatures, there would be a reduction in comfort days for these stations. On the other hand, for other study stations, given the low volumes of autumn tem-perature for them, there is often a case of cold stress in the autumn. But Table 6
presenting a summary of the features of bioclimatic zones of Iran. The future projected values as relative changes in respect to the current period in percent (%). Zones Abadan Ardebil Bandarabbas Bushehr Esfahan Firouzkooh Ghazvin Hamedan_ Mashhad Ramsar Future period; 2020-2050- Scenario RCP 8.5 Z1 0.02 −14.36 −0.15 −0.09 −1.95 −4.24 −2.36 −2.15 −3.37 −0.42
Z2 0 0.01 0 0 0.2 −0.27 −0.02 −0.31 0.09 0 Z3 0.05 −0.06 0 0 −0.78 −0.88 −0.68 −0.92 0.2 0 Z4 0.26 0.37 0.04 0.03 −1.43 −3.95 −1.96 −1.87 1.12 0.01 Z5 −0.01 0.15 0.31 0 −0.7 2.39 −1.11 −0.78 0.55 0 Z6 0 0 0.1 0 −0.02 0.18 0 −0.02 0.16 0 Z7 0.02 −5.5 0 0.01 −0.04 2.09 1.66 1.04 −1.68 −1.52 Z8 −1.73 −0.63 0.07 −1.36 0.27 1.72 1.02 1.58 −1.48 −1.21 Z9 −1.81 17.65 −1.23 −2.17 0.77 1.98 1.34 −0.34 −2.25 −0.37 Z10 −2.26 1.59 −1.34 −2.22 0.87 0.97 2.05 3.52 2.99 1.56 Z11 0.01 0.48 −0.83 −0.55 0 0 0 0 0.05 −0.16 Z12 0.9 0.39 −1.51 4.41 0 0 0.01 0 0.04 1.01 Z13 −1.03 0.01 1.73 −0.39 2.48 0 0.44 0.09 2.85 1.19 Z14 −1.86 0 1.9 0.85 1.02 0 −0.05 0 0.17 0 Z15 7.51 0 0.78 1.59 0 0 0 0 0 0 Z16 0.02 0 0.15 0 −0.6 0.1 −0.15 0.25 0.77 0 Z17 0 0 0 0 0 0 0 0 0 0
increasing the length of the warm seasons of the year can reduce the incidence of cold stress and further increase the number of comfort days. 4.4. Examining the variability in the frequency of days with thermal comfort with respect to global warming
One of the important issues in assessing the need for cooling and heating energy inside of settlements is monitoring of the percentage of comfort days for a study period. Particularly in the context of global warming, the pattern of changes in comfort days will change. Reducing the percentage of comfort days will increase the need for cooling or heating energy. At the same time, the outputs of this section showed that the same pattern did not exist for all stations. Thus, regarding global warming, it was expected that the number of comfort days for all stations would increase or decrease.
In summary, the averages of RCP scenarios showed that there was a decrease of 2.3% for Abadan and Bushehr and 0.9% for Bandar Abbas in days with comfort for future decades. For other stations, an increase in bioclimatic comfort days was simulated. However, among all stations, the greatest increases in comfort days with 3.6% and 3% were projected for Hamadan and Mashhad, respectively (Fig. 6). As shown inFig. 6, the greatest number of comfort days was jointly related to Mashhad and Ghazvin, which accounted for 31% of the frequency of study data for the observational period. Firoozkooh and Ardebil had the lowest frequencies of comfort days in this period, with 0.3% and 2.2% of the data occurrence, respectively. 5. Discussion
5.1. Summary of main findings
We updated the bioclimatic charts of ten cities in Iran to quantify the impact of climate change on 16 bioclimatic design strategies (see Figures A1). Based on the findings of this study, it has been determined that, apart from Abadan station, the outputs of all RCP scenarios used in this study were indicative of an increase in the annual temperature of selected stations. As the outputs showed, the maximum temperature increase for future decades was simulated by the pessimistic RCP 8.5 scenario. The minimum incremental changes in temperature were cal-culated by the optimistic scenario of RCP 2.6. Ardebil station, which is considered one of the coldest stations in Iran and is placed in the Csb class of the Köppen classification, was expected to experience the lar-gest temperature increase (RCP 8.5 = 3.73 °C) compared with the base
period. On the other hand, Bandar Abbas station, which is one of the hottest stations falling under the climatic class Aw, was expected to experience the smallest temperature increase (RCP 8.5 = 0.33 °C). Si-mulations for relative humidity showed that the variation in this component for all stations did not follow the same increasing or de-creasing pattern. For Abadan, Ardebil, Ghazvin, and Hamadan stations, the average annual relative humidity for future decades was projected to increase. For Firoozkooh, Isfahan, Bushehr, Ramsar, Bandar Abbas, and Mashhad stations, a decrease in annual average relative humidity was simulated.
Various cooling and heating strategies were evaluated to provide comfort within buildings for two different periods based on three cli-mate change scenarios. According to the data of both observational and simulated periods, it was found that Abadan, Bushehr, Mashhad and Ramsar stations are mainly influenced by the passive solar heating strategy (Z7). Although most strategies for these stations belonged to Z7, their frequency was projected to decrease for future decades. At Ardebil station, the most important energy supply instruction for the observational period was the supply of active heating by the Z1 bio-climatic architectural recommendation or conventional heating. On the other hand, all three RCP scenarios showed that the use of the Z7 bioclimatic solution or passive solar heating would be the most effective in future decades. At Isfahan and Firoozkooh stations, although the use of passive solar heating and humidification recommendations ac-counted for the maximum frequency of data during the observational period, the passive solar heating strategy was introduced as the most important bioclimatic strategy for future decades. In Hamadan, the most important factor for providing indoor comfort was the use of the Z1 bioclimatic recommendation or conventional heating, which was the same for the future. The findings at Mashhad and Ramsar stations in-dicated that for both observational and future periods, the maximum of occurrences were related to passive solar heating. The percentage of frequencies for these two zones was expected to decrease in the future. The findings of this study showed that the need for heating in Iranian households is decreasing for all stations, while the need for cooling strategies will increase in future decades. Out study validated and re-formulated a set of bioclimatic design strategies that will need to implement in existing and new residential buildings in Iran. The study provides novel and reliable information for city planners, architects, builders, contractors, and knowledgeable homeowners to achieve thermal comfort without excess space conditioning costs.Table 5can be used by designers to quantify the influence of climate change on the 16
investigated bioclimatic design recommendations and consequently identify the most influential bioclimatic strategies. The set of updated design strategies for each climate zone in Iran is valuable and draws designers attention to thermal control, air and heat flow control, solar radiation control, and management of interior heat generation. This will allow building up on this knowledge and updating the Iranian building code and bring those strategies in practice.
In studies by Refs. [38,60]; climate change was simulated for future decades, and its effect on energy consumption was modeled. The results of this study showed that in most parts of Iran, due to global warming, the need for heating energy will decrease (see Section4.3). On the other hand, the demand for cooling energy to provide indoor comfort will increase (see Section4.3). Similar studies confirmed these results, as shown by Ref. [61] for northwestern areas of Iran. Their simulation of the effect of climate change on monthly energy consumption for these areas showed that due to global warming, by 2100 energy consumption in the heating sector will decrease, but it will increase in the cooling sector.
In many other studies of Iran, it is clear that with regard to global warming, the process of temperature change is incremental; this is a credit to the findings of this study. One of these findings was from a study by Ref. [62] for the southwest of Iran. They simulated tempera-ture changes from 2020 to 2060 using the output of GCMs (HadCM3) based on LARS-WG software. The results of the study indicated an in-crease in temperature from 0.32 °C to 0.51 °C compared with tem-peratures in the 1988 to 2010 base period [63]. divided Iran into seven clusters according to the statistical period of 1948–2010. Their results showed that there was an increasing trend in temperature for all clus-ters. The results of [64] for northwest regions of Iran showed that by 2100 the temperature will increase by 1.5 °C for these areas. In many other studies in other parts of the world, the outputs of GCMs relate global warming with temperature increase [65–69].
5.2. Implications for practice and future research
The implication of these results indicated the importance of raising the awareness of the built environment professionals regarding global warming and the increase in cooling needs in buildings in Iran. It can be concluded that the occurrence of global warming in various climates of Iran will be accompanied by temperature increase, which will reduce the use of heating strategies and increase the use of different cooling strategies. The use of solar passive heating and cooling as a bioclimatic design recommendation is an important strategy for present and future building architecture in different cities of Iran. In Iran, the effects of fuel poverty during winter will decrease with climate change; however, its negative effects will increase during summer. Damage or failure of in-frastructure (e.g., blackouts), thermal discomfort, low work pro-ductivity, low hygiene (drinking water and surface water quality), health challenges (respiratory, heart, and kidney problems), and extra
deaths are expected [40,70–72].
We believe that heat issues will be exacerbated by rising tempera-tures induced by climate change and urban heat island effect in hot cities [43–45,73]. Finally, we suggest that the effects of global warming on the basis of different GCMs of atmospheres should be simulated in future studies for Iran. Future studies should compare our study results to studies in other regions of the world to investigate the different se-verity of climate change impacts.
By using the outputs of these models, different bioclimatic indices and passive design strategies and strategies can be evaluated. Additional research should be conducted to establish detailed indoor-related climate change adaptation measures in different parts of the country. The next practical step for this research is engagement with policy officials to adopt and implement our findings and re-commendations in new Iranian building provisions and regulations. 6. Conclusion
Iran is a developing country with rapidly increasing population. New constructions are growing at an even faster rate. Constructing new housing projects based on accurate climate projections and bioclimatic analysis is important to design climate responsive buildings. In this study, the effect of climate change on thermal comfort in Ten Iranian Cities was assessed to project the bioclimatic potentials and strategies during 2020–2050. Changes in the two components of temperature and relative humidity for the 2020–2050 periods were simulated using three RCP scenarios. RCP2.6, RCP 4.5 and RCP 8.5 scenarios were used to examine climate change effects in Abadan, Ardebil, Bandarabbas, Bushehr, Esfahan, Firouzkooh, Ghazvin, Hamedan_Nozheh, Mashhad and Ramsar. In order to simulate daily temperature and relative hu-midity, data from the large-scale data output were collected and treated. The general circulation model (GCM) was based on CanESM2 and the downscaling method of SKNN. The average daily minimum and maximum temperatures and relative humidity components were pro-duced at a station scale. Givoni's correction chart was used to analyze and provide various bioclimatic recommendations. Ardebil Station will witness the highest temperature rise of° RCP 8.5 3.73 = °C. Bandar Abbas Station will experience a minimum temperature rise of °RCP 8.5 = 0.30 °C. Passive solar heating remains the topmost bioclimatic strategy of the future in Iran. The study rresults help to quantify and identify the most influential bioclimatic design strategies under dif-ferent climate change scenarios.
Acknowledgment
This work was partially supported by the Golestan University under grant No. 961563. We thank Golestan University for their support of the project.
Appendix B. Supplementary data
Fig. A1c. presenting the distribution of bioclimatic conditions of the selected study stations for the current and future periods of bioclimatic zones of Iran References
[1] B. Givoni, Comfort, climate analysis and building design guidelines, Energy Build. 18 (1992) 11–23.
[2] J.K. Vanos, J.S. Warland, T.J. Gillespie, N.A. Kenny, Review of the physiology of human thermal comfort while exercising in urban landscapes and implications for bioclimatic design, Int. J. Biometeorol. 54 (4) (2010) 319–334.
Regionalism, Princeton Uni. Press, 2015.
[4] N. Gaitani, G. Mihalakakou, M. Santamouris, On the use of bioclimatic architecture principles in order to improve thermal comfort conditions in outdoor spaces, Build. Environ. 42 (1) (2007) 317–324.
[5] G.M. Stavrakakis, E. Tzanaki, V.I. Genetzaki, G. Anagnostakis, G. Galetakis, E. Grigorakis, A computational methodology for effective bioclimatic-design ap-plications in the urban environment, Sustainable Cities and Society 4 (2012) 41–57. [6] N. Fintikakis, N. Gaitani, M. Santamouris, M. Assimakopoulos,
spaces in the historic centre of Tirana, Albania, Sustainable Cities and Society 1 (1) (2011) 54–62.
[7] S. Toy, S. Yilmaz, H. Yilmaz, Determination of bioclimatic comfort in three different land uses in the city of Erzurum, Turkey, Build. Environ. 42 (3) (2007) 1315–1318. [8] A.H.A. Mahmoud, An analysis of bioclimatic zones and implications for design of
outdoor built environments in Egypt, Build. Environ. 46 (3) (2011) 605–620. [9] A.S. Nouri, J.P. Costa, Addressing thermophysiological thresholds and
psycholo-gical aspects during hot and dry mediterranean summers through public space design: the case of Rossio, Portugal, Build. Environ. 118 (2017) 67–90. [10] GhR. Roshan, M. Farrokhzad, S. Attia, Defining thermal comfort boundaries for
heating and cooling demand estimation in Iran's urban settlements, Build. Environ. 121 (2017) 168–189.
[11] N.K. Khambadkone, R. Jain, A bioclimatic analysis tool for investigation of the potential of passive cooling and heating strategies in a composite Indian climate, Build. Environ. 123 (2017) 469–493.
[12] K.N. Kishore, J. Rekha, A bioclimatic approach to develop spatial zoning maps for comfort, passive heating and cooling strategies within a composite zone of India, Build. Environ. 128 (2018) 190–215.
[13] J. Gaspari, K. Fabbri, M. Lucchi, The Use of Outdoor Microclimate Analysis to Support Decision Making Process: Case Study of Bufalini Square in Cesena Italy, Sustainable Cities and Society, 2018.
[14] S. Attia, T. Lacombe, H.T. Rakotondramiarana, F. Garde, G.R. Roshan, Analysis tool for bioclimatic design strategies in hot humid climates, Sustainable Cities and Society 45 (2019),https://doi.org/10.1016/j.scs.2018.11.025Feb.2019, p 88-24. [15] IPCC, Climate Change 2013: The Physical Science Basis, in: T.F. Stocker, D. Qin,
G.-K. Plattner, M. Tignor, S.G.-K. Allen, J. Boschung, A. Nauels, Y. Xia, V. Bex, P.M. Midgley (Eds.), Contribution of Working Group I to the Fifth Assessment Report of the Intergovernmental Panel on Climate Change, Cambridge University Press, Cambridge, United Kingdom and New York, NY, USA, 20131535 pp. [16] P. De Wilde, D. Coley, The Implications of a Changing Climate for Buildings, (2012). [17] CCCma, Second generation Earth system model, Canadian centre for climate
modelling and analysis, available: https://www.canada.ca/en/environment-climate-change/services/climate-change/centre-modelling-analysis/models/ second-generation-earth-system-model.html, Accessed date: 15 February 2018. [18] A.G. Kwok, N.B. Rajkovich, Addressing climate change in comfort standards, Build.
Environ. 45 (1) (2010) 18–22.
[19] I. Andrić, A. Pina, P. Ferrão, J. Fournier, B. Lacarrière, O. Le Corre, The impact of climate change on building heat demand in different climate types, Energy Build. 149 (2017) 225–234.
[20] M. Hamdy, S. Carlucci, P.J. Hoes, J.L. Hensen, The impact of climate change on the overheating risk in dwellings-A Dutch case study, Build. Environ. 122 (2017) 307–323.
[21] L. Pajek, M. Košir, Implications of present and upcoming changes in bioclimatic potential for energy performance of residential buildings, Build. Environ. 127 (2018) 157–172.
[22] R.A.W. Albers, P.R. Bosch, B. Blocken, A.A.J.F. Van Den Dobbelsteen, L.W.A. Van Hove, T.J.M. Spit, V. Rovers, Overview of Challenges and Achievements in the Climate Adaptation of Cities and in the Climate Proof Cities Program, (2015). [23] R.D. Brown, Ameliorating the effects of climate change: modifying microclimates
through design, Landsc. Urban Plann. 100 (4) (2011) 372–374.
[24] R.D. Brown, J. Vanos, N. Kenny, S. Lenzholzer, Designing urban parks that ame-liorate the effects of climate change, Landsc. Urban Plann. 138 (2015) 118–131. [25] N. Mazhar, R.D. Brown, N. Kenny, S. Lenzholzer, Thermal comfort of outdoor
spaces in Lahore, Pakistan: lessons for bioclimatic urban design in the context of global climate change, Landsc. Urban Plann. 138 (2015) 110–117.
[26] S. Attia, Regenerative and Positive Impact Architecture: Learning from Case Studies, Springer, 2017.
[27] M. DeKay, G.Z. Brown, Sun, Wind, and Light: Architectural Design Strategies, John Wiley & Sons, 2014.
[28] M. Milne, R. Liggett, A. Benson, Y. Bhattacharya, Climate Consultant 4.0 develops design guidelines for each unique climate, Buffalo, New York: American Solar Energy Society Meeting, 2009.
[29] A.W.T. Barenbrug, Psychrometry and psychrometric charts, Transvaal and Orange Free State Chamber of Mines of South Africa, 1965.
[30] B. Givoni, Man, Climate and Architecture, second ed., Applied Science, London, 1976.
[31] B. Givoni, Passive Low Energy Cooling of Buildings, John Wiley & Sons, 1994. [32] M. Milne, B. Givoni, Architectural Design Based on Climate, McGraw-Hill, New
York, 1979.
[33] S. Attia, A. De Herde, Bioclimatic architecture design strategies in Egypt, Sustainable Energy Technologies 1 (1) (2009).
[34] E. Krüger, C. Laroca, Thermal performance evaluation of a low-cost housing pro-totype made with plywood panels in Southern Brazil, Appl. Energy 87 (2010) 661–672.
[35] A.-T. Nguyen, Q.-B. Tran, D.-Q. Tran, S. Reiter, An investigation on climate re-sponsive design strategies of vernacular housing in Vietnam, Build. Environ. 46 (2011) 2088–2106.
[36] B. Givoni, Performance and applicability of passive and low-energy cooling systems, Energy Build. 17 (1991) 177–199.
[37] O. Alizadeh-Choobari, M.S. Najafi, Extreme weather events in Iran under a chan-ging climate, Clim. Dyn. (2018).
[38] GhR. Roshan, J.A. Orosa, T. Nasrabadi, Simulation of climate change impact on energy consumption in buildings, case study of Iran, Energy Policy 49 (2012) 731–739.
[39] M. Abbasnia, T. Tavousi, H. Toros, Spatial-temporal analysis of heat waves in Iran over the last three decades, Natural Environment Change 2 (1) (2016) 25–33. [40] E. Ahmadnezhad, K. Holakouie Naieni, A. Ardalan, M. Mahmoodi, M. Yunesian,
K. Naddafi, A.R. Mesdaghinia, Excess mortality during heat waves, Tehran Iran: an ecological time-series study, J. Res. Health Sci. 13 (1) (2013) 24–31.
Technol 3 (4) (2010) 208–216.
[42] M. Abbasnia, Climatic Characteristics of Heat Waves under Climate Change: a Case Study of Mid-latitudes, Environment Development and Sustainability, Iran, 2017, pp. 1–20.
[43] D. Li, E. Bou-Zeid, Synergistic interactions between urban heat islands and heat waves: the impact in cities is larger than the sum of its parts, J. of Applied Meteorology and Climatology 52 (9) (2013) 2051–2064.
[44] O. Potchter, H.I. Ben-Shalom, Urban warming and global warming: combined effect on thermal discomfort in the desert city of Beer Sheva, Israel, J. Arid Environ. 98 (2013) 113–122.
[45] M. Sofer, O. Potchter, The urban heat island of a city in an arid zone: the case of Eilat, Israel, Theor. Appl. Climatol. 85 (1–2) (2006) 81–88.
[46] I.M.O. IRIMO, Iran meteorological data, Office CD, Editor. Tehran, 2016. [47] P.J. Robinson, On the definition of a heat wave, J. Appl. Meteorol. 40 (2001)
762–775.
[48] Y.S. Unal, E. Tan, S. Mentes, Summer heat waves over western Turkey between 1965 and 2006, Theor. Appl. Climatol. 112 (2013) 339–350.
[49] K.-Y. Kim, B.J. Kim, G.S. Yi, Reuse of imputed data in microarray analysis increases imputation efficiency, BMC Bioinf. 5 (1) (2004) 160.
[50] K.-Y. Kim, G.-S. Yi, CSBio Lab., Information and Communications University, Sequential KNN Imputation Method. R Package, (2008) version 1.0.1. [51] R. Oji, Uncertainty Analysis of Single-Site and Multi-Site Downscaling Methods
Applied to Extreme Temperature and Precipitation, Ph.D. Thesis in Climatology Tarbiat Modares University, Tehran, Iran, 2013.
[52] IPCC (Intergovernmental Panel on Climate Change), Towards new scenarios for analysis of emissions, climate change, impacts, and response strategies, IPCC Expert Meeting Report 19–21. September 2007 Noordwijkerhout, The Netherlands, 2007 25 pp.
[53] U. Cubasch, D. Wuebbles, D. Chen, M.C. Facchini, D. Frame, N. Mahowald, J.G. Winther, Introduction, Climate Change 2013: the Physical Science Basis. Contribution of Working Group I to the Fifth Assessment Report of the IPCC, Cambridge University Press, New York, NY, USA, 2013.
[54] L. Pajek, M. Košir, Can building energy performance be predicted by a bioclimatic potential analysis? Case study of the Alpine-Adriatic region, Energy Build. 139 (2017) 160–173.
[55] M.C. Katafygiotou, D.K. Serghides, Bioclimatic chart analysis in three climate zones in Cyprus, Indoor Built Environ. 24 (6) (2015) 746–760.
[56] S. Attia, The role of landscape design in improving the microclimate in traditional courtyard buildings in hot arid climates, Proceedings of 23rd -PLEA, vol.2006, PLEA-Université de Genève-groupe énergie, 2006, pp. 22–24.
[57] S. Attia, I. Duchhart, Bioclimatic landscape design in extremely hot and arid cli-mates, Proceedings of 27th Conference of Passive and Low Energy Architecture (PLEA), PLEA, 2011.
[58] R. Naor, O. Potchter, H. Shafir, P. Alpert, An observational study of the summer Mediterranean Sea breeze front penetration into the complex topography of the Jordan Rift Valley, Theor. Appl. Climatol. 127 (1–2) (2017) 275–284.
[59] C.L. Tan, P.Y. Tan, N.H. Wong, H. Takasuna, T. Kudo, Y. Takemasa, ... H.X.V. Chua, Impact of soil and water retention characteristics on green roof thermal perfor-mance, Energy Build. 152 (2017) 830–842.
[60] Gh Roshan, A. Ghanghermeh, J.A. Orosa, Thermal comfort and forecast of energy consumption in Northwest Iran, Arab J Geosci 7 (9) (2014) 3657–3674. [61] Gh Roshan, J. Orosa, Regional climate changes and their effects on monthly energy
consumption in buildings in Iran, Natural Environment Change 1 (1) (2015) 31–48. [62] Gh Roshan, S. Negahban, Modeling of the effects of climate change on rainy and
gully erosion potential of Kor-chamriz watershed in Fars province, Model, Earth Syst. Environ. 1 (2015) 26.
[63] A.A. Ghanghermeh, Gh Roshan, E. Shahkooeei, Evaluation of the effect of Siberia's high pressure extension on daily minimum temperature changes in Iran, Model, Earth Syst. Environ. 1 (2015) 20.
[64] C. Tisseuil, Gh Roshan, T. Nasrabadi, G.A. Asadpour, Statistical modeling of future lake level under climatic conditions, case study of Urmia Lake (Iran), Int. J. Environ. Res. 7 (1) (2012) 69–80.
[65] R. Barbosa, R. Vicente, R. Santos, Climate change and thermal comfort in Southern Europe housing: a case study from Lisbon, Build. Environ. 92 (2015) 440–451. [66] K. Jylhä, J. Jokisalo, K. Ruosteenoja, K. Pilli-Sihvola, T. Kalamees, T. Seitola,
A. Drebs, Energy demand for the heating and cooling of residential houses in Finland in a changing climate, Energy Build. 99 (2015) 104–116.
[67] V. Nik, A.S. Kalagasidis, Impact study of the climate change on the energy perfor-mance of the building stock in Stockholm considering four climate uncertainties, Build. Environ. 60 (2013) 291e304 (2013).
[68] J. Orosa, A.M. Costa, G. Roshan, E.J. Garcia-Bustelo, Wind turbines design cor-rections for next Galicia climatic conditions, Sci. Iran. 24 (3) (2017) 926–932. [69] X. Wang, D. Chen, Z. Ren, Assessment of climate change impact on residential building heating and cooling energy requirement in Australia, Build. Environ. 45 (2010) 1663–1682.
[70] A. Haines, R.S. Kovats, D. Campbell-Lendrum, C. Corvalan, Climate change and human health: impacts, vulnerability and public health, Publ. Health 120 (7) (2006) 585–596.
[71] L. Malys, M. Musy, C. Inard, Microclimate and building energy consumption: study of different coupling methods, Adv. Build. Energy Res. 9 (2) (2015) 151–174. [72] M.K. Singh, S. Attia, S. Mahapatra, J. Teller, Assessment of thermal comfort in
existing pre-1945 residential building stock, Energy 98 (2016) 122–134. [73] M.P. McCarthy, M.J. Best, R.A. Betts, Climate change in cities due to global
warming and urban effects, Geophys. Res. Lett. 37 (9) (2010).
[74] P.M. La Roche, Carbon-Neutral Architectural Design, CRC Press, Boca Raton, 2017https://doi.org/10.1201/9781315119649.
[75] GhR. Roshan, A.A. Ghanghermeh, S. Attia, Determining new threshold tempera-tures for cooling and heating degree day index of different climatic zones of Iran, Renew. Energy 101 (2016) 156–167.