Accepted Manuscript
Development and validation of a survey for well-being and interaction assessment by occupants in office buildings with adaptive facades
S. Attia, S. Garat, M. Cools
PII: S0360-1323(19)30306-3
DOI: https://doi.org/10.1016/j.buildenv.2019.04.054
Reference: BAE 6118
To appear in: Building and Environment
Received Date: 20 February 2019 Revised Date: 22 April 2019 Accepted Date: 27 April 2019
Please cite this article as: Attia S, Garat S, Cools M, Development and validation of a survey for well-being and interaction assessment by occupants in office buildings with adaptive facades, Building and Environment (2019), doi: https://doi.org/10.1016/j.buildenv.2019.04.054.
This is a PDF file of an unedited manuscript that has been accepted for publication. As a service to our customers we are providing this early version of the manuscript. The manuscript will undergo copyediting, typesetting, and review of the resulting proof before it is published in its final form. Please note that during the production process errors may be discovered which could affect the content, and all legal disclaimers that apply to the journal pertain.
M
AN
US
CR
IP
T
AC
CE
PT
ED
Development and validation of a survey for well-being and interaction
1
assessment by occupants in office buildings with adaptive facades
2
S. Attia1, S. Garat 1,2, M. Cools 3, 4, 5
3
1
Sustainable Buildings Design Lab, Dept. UEE, Applied Sciences, Université de Liège, Belgium
4
2
EPF Graduate School of Engineering, Sceaux, France
5
3
Local Environment Management & Analysis (LEMA), Dept. UEE, Applied Sciences, Université de
6
Liège, Belgium
7
4
KULeuven Campus Brussels, Department of Informatics, Simulation and Modeling, Warmoesberg 26,
8
BE-1000 Brussels, Belgium
9
5
Hasselt University, Faculty of Business Economics, Agoralaan Gebouw D, BE-3590 Diepenbeek,
10
Belgium
11
12
Abstract: Assessing well-being and occupants satisfaction is a growing concern in façade design practice, as
13
increasing recognition of the value of well-being of occupants in office buildings. The objective of this study
14
was to develop a validated survey for evaluating the indoor environmental quality in office buildings with
15
adaptive facades to provide feedback to designers and operators and inform the building community at alarge. A
16
total of 70 employees completed an initial survey containing 14 questions grouped into six domains
(OCAFAS-17
14). Factor analysis of the responses was performed resulting into a final survey grouped into three domains and
18
containing 15 questions (general feeling, thermal comfort and acoustic comfort) (OCAFAS-15). Statistical
19
analysis indicated that the OCAFAS-15 had good validity, reliability, and internal consistency. The survery
20
succeeded to benchmark well-being, satisfaction and interaction changes of employees in an open-space office
21
with dynamic louvers. The results indicates that the OCAFAS-15 provides a basis for dialoguebetween
22
occupants and façade engineers regarding the user interaction, façade control adaptation and in particular in
23
tracking of changes of indoor environmental quality, evaluating response of facades to occupants’ requirements,
24
and guiding the operation of adaptive facades. A validated well-being and occupant interaction survey could be
25
particularly useful in benchmarking building with adaptive facades and recognizing and managing occupants’
26
dissatisfaction in buildings with dynamic facades.
27
28
Keywords:dynamic facades, user interaction, questionnaire, occupant satisfaction, thermal comfort, acoustic
29
comfort
30
31
Abbreviation: AC, Acoustic Comfort; CFA, confirmatory factor analysis; DBO, Design, Build and Operate
32
;EFA, exploratory factor analysis; G, General; IEQ, indoor environmental quality; ICC, intra-class correlation;
33
OCAFAS, occupant-centered adaptive façades assessment survey; POE, post-occupancy evaluations; TC,
34
thermal comfort;35
36
1. Introduction37
Occupants’ well-being and occupants’ interaction assessments are considered to be the most important design
38
goals in facades engineering [1, 2] and are now common place in building with adaptive facades [3]. An
39
adaptive façade is a facade which can change his transports properties for all kinds of energies (radiative,
40
thermal…) either as a passive reaction to changing environment conditions or as an active switch controlled by a
M
AN
US
CR
IP
T
AC
CE
PT
ED
building control assistant. The purpose of adaptive facades is creating maximum comfort for occupant with
42
minimum energy consumption. However, there are very few pre and post-occupancy survey tools that can help
43
façade designer and operator to understand occupants’ experiences, perceptions and levels of satisfaction, in
44
buildings with adaptive facades. There is often a gap between the automated/responsive behavior of these
45
facades and the requirements of occupants’, which creates discomfort, both visually and thermally [4]. Only in
46
the past five years has occupant-centered adaptive façades assessment been extensively studied and measured as
47
part of the scope of EU COST Action TU1403 “adaptive facades network”, under whose auspices the present
48
study was carried out [5]. The initiated COST Action TU1403 “adaptive facades network” aims to pool together
49
the knowledge, technologies and research from across European countries and beyond [6]. One of the main
50
objectives of this Action is assess and evaluate different adaptive facades technologies from an
occupant-51
centered approach and create good-quality survey tools to benchmark and compare the indoor environment in
52
office buildings with adaptive facades
53
Historically, most well-being and satisfaction surveys have been developed with a focus on the indoor
54
environment [2]. Because thermal comfort, visual comfort, acoustic comfort and air quality are the strongest
55
discriminators of well-being and satisfaction of occupants in buildings [7, 8]. For example, the UK BUS
56
occupant survey allows benchmarking office buildings against an existing database of case studies [11]. Other
57
standard-setting bodies such as the American Society of Heating, Refrigerating and Air-Conditioning Engineers
58
(ASHRAE) developed a Performance Measurement Protocols for Commercial Buildings [9]. The Center of
59
Built Environment (CBE) developed a Building Performance Evaluation (BPE) toolkit with an occupant
60
satisfaction survey with a score card report generation tool [29]. This was emphasized by emergence of
post-61
occupancy evaluations (POE) in 1990s as an approach to address the sick building syndrome and occupants’
62
complaints in working environment [11]. A literature review published by Attia et al. (2018) [1], indicates that
63
the evolution of post-occupancy evaluation resulted in creating two procedural approaches or methodologies
64
namely: (1) Subjective or Qualitative Methods: a) Occupants Surveys, b) Interviews, and c) Walkthroughs and
65
(2) Physical Quantitative Methods: a) IEQ in situ measurements and b) energy and water audits and monitoring
66
[10-18]. However, most of these surveys are developed by researchers and are not validated or are developed by
67
third-party survey providers which make them not accessible for design teams, owners and buildings managers
68
and more importantly they do cater for buildings with static facades.
69
Although POE methodologies in buildings with static facades can be used in building with adaptive facades,
70
the creation of novel occupant-based behavioral and opinion survey that cater for adaptive facades and address
71
the interaction of users is becoming a growing concern [3, 19]. There is a consensus that occupants’ well-being
72
and occupants’ interaction in buildings with adaptive facades should be more intensively investigated [1]. Next
73
to IEQ parameters, these can include needs satisfaction, facade control, façade feedback, control adaptation, user
74
appropriation and the learning ability of the façade control system [4]. Using this inclusive definition of
75
occupant-centered well-being makes it harder to measure occupant interaction and engagement in buildings with
76
static facades. The usual method for constructing a valid occupant-centered adaptive façades assessment survey
77
(OCAFAS) is to identify different domains that independently contribute to well-being and occupants
78
interaction assessment for individuals in open-office spaces with adaptive facades [1]. The domain concept
79
allows the topic of well-being and occupants interaction in building with adaptive facades to be separated into
M
AN
US
CR
IP
T
AC
CE
PT
ED
different parts that mirror its multifactorial nature. Then survey designers can group various assessment items,
81
which are intrinsic to the topic of well-being and occupants interaction within each domain [27].
82
In architectural and engineering firms, well-being and occupants satisfaction is a growing concern as
83
increased awareness of employees owns health and well-being is becoming a global trend [20-22]. In response
84
to increasing recognition of the value of the assessment of well-being and occupants interaction in buildings
85
with adaptive facades in practice, previous efforts have been made to develop assessment studies of well-being
86
and occupants interaction in building with adaptive facades. One of the earliest studies is the study of Vine [23]
87
who investigated interaction between occupants and a dynamic venetian blind in an experimental setting. Clear
88
et al. [24] investigate the responses of 38 subjects to electrochromic windows in an experimental setting.
89
Similarly, did Lee et al. [25] assess an electrochromic window control system in a fully monitored test-bed. The
90
measurements took place during 328 meetings in 6-months without indicating the nature of questions that were
91
used. Among the previous studied we consider the work of Bakker et al. (2014) the most significant. In their
92
study, they assessed the user satisfaction and interaction with automated dynamic facades in an experimental
93
facility with 26 test subjects [3]. Also, the work of Karlsen et al. (2015) is relevant because they assessed the
94
occupant satisfaction with two blind control strategies in an experimental facility with 40 test subjects [19].
95
Exceptionally, the study of Stevens (2001) is the only found study that investigated the correlation between
96
occupant satisfaction and their ability to overrule automated façade control in real buildings [26]. However,
97
most those studies were mostly performed in experimental settings and did not focus on creating generic surveys
98
or POE methodologies catering for occupants in building with adaptive facades [1]. They focused on the
99
technical trial assessments of specific adaptive façade technologies in relation to occupant’s satisfaction and
100
interaction. Previous studies did not enable occupants and operators in real buildings with adaptive facades to
101
track changes in well-being, evaluate response to façade control and guide the operation decisions.
102
Thus, in order to bridge this gap and improve the quality of evaluation of interactions between occupants
103
and their working environments in buildings with adaptive facade, we need to know the requirements and
104
troubles of the occupants. This is why we propose an occupant-based behavioral and opinion survey, the
105
analysis of the answers to which will allow us to identify the main problems in order to attenuate or eliminate
106
them. The aim is the creation of a validated survey that could be used in POE and also would enable facades
107
designers (architects and engineers) and operators (facility managers) to design and manage adaptive facades.
108
The purpose of this study was to create and evaluate the validity of an occupant-centered, multi domain
109
occupant well-being related survey appropriate for baseline benchmarking and ongoing evaluation of occupants’
110
satisfaction in experimental and real building settings. By including physical and non-physical assessment
111
domains, the survey was designed to accurately reflect the occupants’ well-being and interaction in buildings
112
with adaptive facades.
113
2. Materials and methods
114
For this study we developed a study conceptual framework that summarizes and visualizes our research
115
methodology. Similar to the work of Lavan (2013) [27], Lesley Wiseman Orr et al. (2004) [28] and Zagreus et
116
al. (2004) [29], our research methodology combines mixed methods of research involving quantitative (e.g.,
117
case studies) and qualitative (statistical factor analysis) and quantitative (extensive usability testing)
M
AN
US
CR
IP
T
AC
CE
PT
ED
research. As shown in Figure 1, our conceptual study framework is based on three axes that will be described in
119
the following sections.
120
121
Figure 1, Study conceptual framework
122
From an epistemological point of view our study is not experimental and not empirical. By experimental we
123
mean measuring user’s interaction and satisfaction in laboratory or test cell conditions. By empirical we mean
124
measuring the influence of the adaptive façade operation and design on user satisfaction, interaction or indoor
125
environmental quality. However, our study is a modelling study. We are not here focused on the nature of reality
126
(satisfaction, interaction and indoor environmental quality), rather we are focused on how we can know it. Also
127
due to the sensitivity of the building owner to release any negative information that can be used by occupants in
128
any future struggle, we hardly succeeded to convince the owner to allow us to benefit from the building
129
occupants to create the survey and not assess the building. In order to manage to do this study, we had three
130
previous failing case studies were the owner allowed us to do such study. Therefore, we found it more important
131
to build and create a valid and open-access survey first, as a start, before using it on a large scale in different
132
case studies with the same adaptive façade technology.
133
2.1 Survey development and testing
134
2.1.1 Domain identification
135
The domain identification for the survey was based on a literature review and framework for adaptive facades
136
evaluation developed by the first author to assess the well-being and interaction in buildings with adaptive
137
facades [1, 2]. Based on a novelobject-based façade characterization and classification framework we identified
138
six domains as shown in Table 1. The survey was developed based on questionnaire responses by occupants.
139
Their input was used to validate the six domains empirically thought to be related to an adaptive facades
M
AN
US
CR
IP
T
AC
CE
PT
ED
performance with external movable shading, namely, views, thermal comfort, visual comfort, acoustic comfort,
141
façade control adaptation and user interaction.
142
Table 1, Domains and assessment items in the occupant-centered adaptive façades assessment survey
143
(OCAFAS-17).
144
Domain of adaptive façades assessment
Item number and description
Personal Data Gender, Age, Working Years, Closeness to window, Closeness to wall, Orientation, Floor, Location, Control Options, Computer/Paper work
General Feeling (1) General satisfaction (2) Source of Disturbance
View (3) Satisfaction with view
(4) View importance Visual Comfort (5) Glare disturbance
(6) Illuminance level I (7) Illuminance level II Thermal Comfort (8) Thermal preference
(9) Temperature perception (10)Thermal comfort satisfaction
Adaptation Control (11)Learning ability of control system (intelligence) (12)Control adaptation
(13)Control disturbance User Interaction (14)Control importance
(15) Satisfaction with feedback
(16)Satisfaction with control and interaction Acoustic Comfort (17) Noise disturbance I (Movable shading)
2.1.2 Survey development
145
The alpha and beta version of the OCAFAS-14 was developed by the author to assess the satisfaction and
146
interaction of occupants with adaptive facades in office working environments. The identification of the survey
147
domains resulted in creating a survey with six domains empirically thought to be related to occupants’
well-148
being in office buildings with adaptive facades. Each domain contained some related items that were scored on a
149
5-level Likert scale. Two general questions were added (personal data and general satisfaction, followed by an
150
occupant-centered adaptive façades assessment. The general feeling was scored on a 5-point numeric rating
151
scale from very poor to excellent. Based on informal responses during the survey testing (see next Section), the
152
survey domains and items were considered suitable for inclusion in an initial, 14-item occupant-centered
153
adaptive façades assessment survey (OCAFAS) (OCAFAS-17; Appendix A) after minor modifications. Since
M
AN
US
CR
IP
T
AC
CE
PT
ED
employees occupants who reviewed the survey prior to testing considered the question on ‘general feeling’ to be
155
valuable, it was held in the final survey. Based on the rule-of-thumb used in factor analysis that at least five
156
times as many respondents should be used as the number of items in the questionnaire the target sample size was
157
estimated [30, 31] . The target minimum sample size for survey was calculated to be 70 to cover the 14
158
questions.
159
Occupants who were employees in an office building with an adaptive façade were asked to participate in
160
the survey. The building is a nearly zero energy building located in Louvain-La-Neuve, Belgium (Lat:
161
50.6770°N, Long: 4.6233° E), with unique glass façade, comprising thermal isolated glass sunshades printed
162
with white silk screen. The external façade is fully covered with double glazing system in combination with
163
movable sunshades printed with white silk screen. An external louvers system respond dynamically and
164
automatically to the angle of the sun which improves the control over energy consumption, solar radiation and
165
glare with the ability to admit natural light into the building while affording a view over the surrounding
166
countryside [32]. The main characteristics of the buildings are reported in the work of Samyn and De Coninck
167
(2014) [33]. The criteria for the selection of the case study building required it to have an adaptive façade with
168
multiple and identical working settings regarding, South orientation, occupant’s number, function and furniture.
169
The building is built in 2014 and is equipped with HVAC system and was designed to have fixed, non-operable
170
windows. The external louvers are automated centrally for shading and occupant have access to internal roller
171
blinds. As shown in Figure 2, employees working in the South-East Section of Floor 1 and 2 (above ground)
172
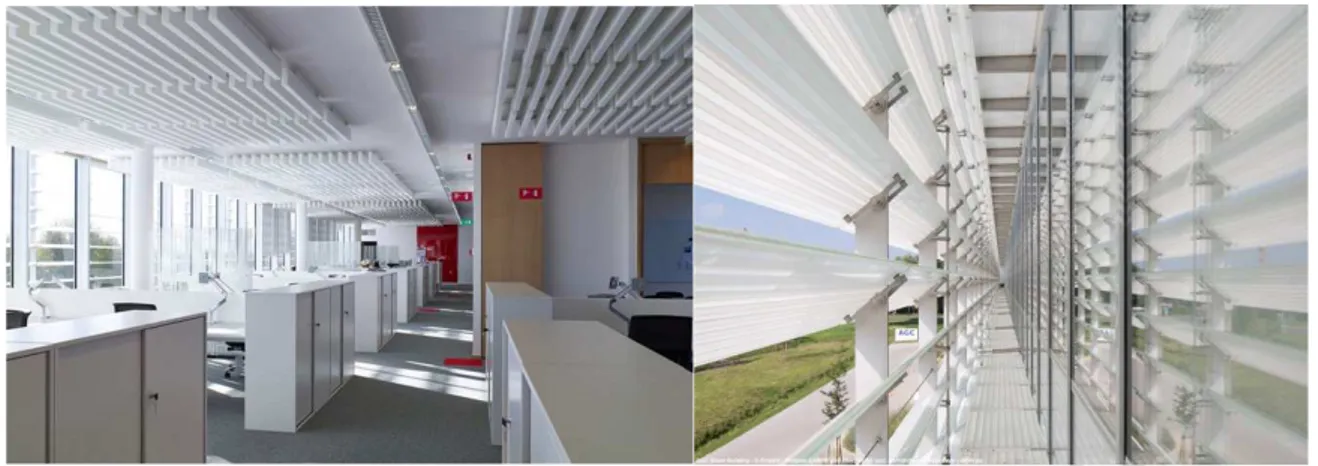
were selected. Figure 3 provides an overview of the façade with the automated louvers opened.
173
174
Figure 2, Floor plans of the study location and AGC Glass Building, Louvain-La-Neuve, Belgium [33]
M
AN
US
CR
IP
T
AC
CE
PT
ED
176
Figure 3 (left), overview of the façade with the automated louvers opened; Figure 3 (right) Exterior – Windows
177
Double-skin façade combining glass louvres made of extra-clear glass (outside skin) with super-insulating
178
glazing and white spandrel double glazing (inside skin); Architect: Philippe SAMYN and PARTNERS sprl,
179
architects and engineers – BEAI sa, Photographer: Jean-Michel Byl, Courtesy Notice: AGC Glass Building - ©
180
Project : Philippe SAMYN and PARTNERS sprl, architects and engineers – BEAI sa [33]
181
182
Respondents were requested to provide data for their workstation’s position, gender, age, and floor location.
183
The A4 double-page paper survey was structured into domains and their associated items (see Appendix A). The
184
paper format allowed the responders to go review or change their responses. 11 days after completing the initial
185
survey, responders were invited to complete the survey a second time. The two responses were analyzed to test
186
and retest reliability between surveys. Responses of the OCAFAS-14 were analyzed to determine which survey
187
components were relevant and should be reserved or adapted.
188
2.1.2.1 Survey testing
189
A pilot study was carried out thanks to the feedback of the building manager. This allowed us to properly define
190
the main lines of evaluation for questionnaires. The main result of this pilot study is the expansion of the initial
191
three main axes (Comfort perception, Adaptation control and User interaction) into six new axes: View,
192
Thermal comfort, Visual comfort, Adaptation control, User interaction and Acoustic Comfort. After these
193
multiple steps, the following initial survey (see Appendix A) was printed in paper version.
194
2.2 Survey Launching
195
The survey was carried out twice at two-week intervals: on the 23/11/2018 and 04/12/2018. Participants were
196
who participated in the study were kept anonymous. The survey was conducted in accordance with the ethical
197
standards in the Declaration of Helsinki and the European Union General Data Protection Regulation (GDPR).
198
The study took place on the first and second floor of a two open-space offices located in the South-East of the
199
AGC Glass Building. The questionnaires were distributed twice in the autumn of 2018 at 14:00. Respondents
200
required 12 minutes in average to fill in the survey. Recorded temperatures were conventional for the season.
201
The climatic conditions in Louvain-La-Neuve over these 2 days were essentially the same: clear sky with solar
202
radiation and ambient temperature around 5°C. This 2-week interval was considered short enough for subjects to
203
make an assessment under identical conditions and long enough for them not to remember exactly their answers.
204
Thanks to two-week intervals, it was possible to compare the answers of test-retest reliability. Indeed, since
205
surveys might be subjective and can be influenced by factors such as mood, we repeated the survey twice. By
M
AN
US
CR
IP
T
AC
CE
PT
ED
distributing the survey twice, the risk of dependence on these factors is reduced. In total, 70 employees
207
responded to both survey rounds.
208
2.3 Factor Analysis
209
Factorial statistical analysis was done using SPSS AMOS software, to identify links, redundancies, similarities
210
between questions and between questions and their categories [34]. Once the answers were collected, an Excel
211
table was created including all the answers. In order to be able to do a better factor analysis, it was necessary to
212
transform all questions into Likert-type questions (scale evaluating a parameter on a scale of 1 to 5). Indeed, the
213
comparison of Likert questions is much stronger in terms of meaning than the comparison of several binary
214
answers having no defined link between them. In order for SPSS AMOS program to work properly, we removed
215
the surveys that were not answered twice from the answers database. A question with more than 5% missing
216
answers indicates that it is not comprehensible enough and must be changed or deleted. Then, we investigated
217
three major indicators namely the item retention within domains, validity and reliability.
218
2.3.1 Domains identification
219
To identify the different domains inherent in the questionnaires, two procedures were followed. First, from a
220
theoretical point of view, the different subdomains that were found in literature and proposed in the framework
221
of Attia et al. (2018) were tested using confirmatory factor analysis (CFA) [2]. The correlation between two
222
questions of the same domain was analyzed using the confirmatory factor analysis (CFA) and the exploratory
223
factor analysis (EFA). The CFA was used to test whether our domain classification presented in initial survey
224
version in Appendix A is consistent with the occupants’ understanding of the nature of well-being and
225
interaction in buildings with adaptive facades. The objective of confirmatory factor analysis is to test whether
226
the data fit our seven hypothesized classification framework. This hypothesized framework is based on theory
227
and/or previous analytic research [2].
228
Secondly, an exploratory factor analysis was carried out to reveal the different domains and their relevance.
229
The EFA is a statistical method used to uncover the underlying structure of a relatively large set
230
of variables. EFA is a technique within factor analysis whose overarching goal is to identify the underlying
231
relationships between measured variables. It is commonly used by researchers when developing a domain
232
(a domain is a collection of questions used to measure a particular research item) and serves to identify a set
233
of latent constructs underlying a series of measured variables. The domain relevance was calculated by an
234
Eigenvalue >1.0. The Eigenvalue feature prominently in the analysis of linear transformations [35]. To help
235
determine which questions should be retained to enhance the domain structure, the quality and strength of
236
relationship among questions was used
237
2.3.2 Item retention within domains
238
Standardized regression weights, were calculated to define the correlations of the different items to each of the
239
different domains. To proof a correlation the standardized regression weight should be at least 0.5 and higher to
240
be moderator or significant between an item and a domain.
M
AN
US
CR
IP
T
AC
CE
PT
ED
Then, the correlation between two questions of the same domain was analyzed using the Pearson correlation
242
coefficient. The percentage of the correlation variation was used as a guide to reinforce the importance of the
243
selected domains. Questions were assembled into specific domains based on factor loadings ≥ 0.4. Correlations
244
between an item and another item of 0.3–0.8 were considered adequate to assemble questions within a domain
245
[36]. A correlation of less than 0.3 means that the questions are not similar enough to be grouped in the same
246
domain, a correlation of more than 0.8 means that the questions are too similar and should be merged into a
247
single question. This analysis led us to delete several questions, which were not sufficiently correlated with the
248
other questions in the field. A pattern of extreme low or high scoring would indicate the questions might not be
249
sensitive enough to detect nuances in the well-being and interaction of occupants in buildings with adaptive
250
facades. The pattern was used to test for discriminant (known-groups) validity.
251
2.3.3 Validity
252
The OCAFAS-14 items and domains were analyzed for discriminant validity through correlating to the
well-253
being and interaction of occupants items (Appendix A). The discriminant validity tests whether domains that are
254
not supposed to be related are actually unrelated. A correlation of 0.4–0.7 indicated good divergent validity.
255
Discriminant validity was assessed by comparing the correlation among the domains, in comparison to the
256
individual items correlations.
257
2.3.4 Reliability
258
Internal consistency was examined to degree to which OCAFAS-14 questions, within each domain, measured
259
the domains concept. A Cronbach-alpha score >0.6 indicated good internal consistency of the questions
260
measuring a domain concept. The reliability was calculated by comparing the test and retest answers. The 11
261
days period was considered long enough that a responder would remember his or her first response. In the same,
262
the 11 days period was short enough so that changes in the occupants’ indoor environment status occurred.
263
3. Results
264
3.1 Survey responses
265
A total of 70 individuals completed both surveys for the test and retest analysis. Surveys with missing responses
266
were excluded. A total of 140 valid survey responses were received and provided complete personal data during
267
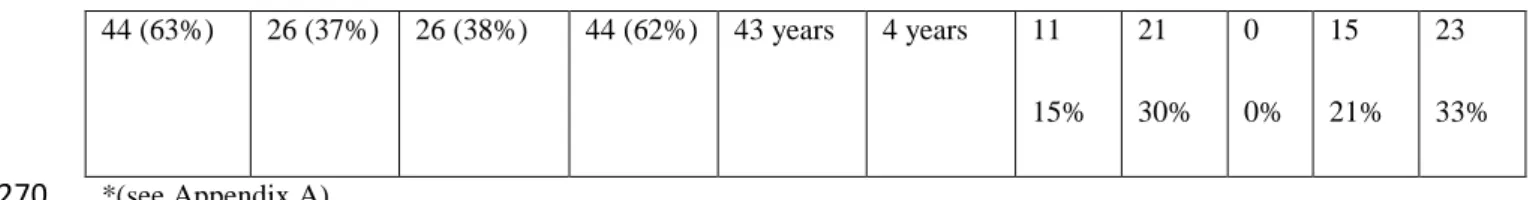
the survey personal data for the respondents in the study is presented in Table 2.
268
Table 2, Demographics of survey responders that provided information.
269
Gender (n = 70) Location Age Working place*
Male Female Within 4 m
from facade Within 8 m from facade Average in survey location 1* 2* 3* 4* 5*
M
AN
US
CR
IP
T
AC
CE
PT
ED
44 (63%) 26 (37%) 26 (38%) 44 (62%) 43 years 4 years 11 15% 21 30% 0 0% 15 21% 23 33% *(see Appendix A)270
In asking questions about the overall well-being and satisfaction with the adaptive façade and their working
271
environment, a majority of responders indicated their dissatisfaction with the façade (Question 11) as shown in
272
Figure 4. Figure 5 provides an insight regarding this unexpected dissatisfaction. 82% of responders reported
273
glare as the main reason for dissatisfaction followed by the lack of control (66%) and lack of view (51%).
274
During the testing period of the survey, we amended Question 11 with a multiple choice question and an open
275
question to make sure our survey will cover all well-being and satisfaction domains. Figure 5 provides a
276
valuable insight to measure the reasons of dissatisfaction and their order of magnitude.
277
278
Figure 4, the breakdown of responses regarding the general satisfaction of occupants.
279
280
281
Figure 5, the most disturbing factors behind the dissatisfaction of the survey respondents.
282
3.2. Domains identification
M
AN
US
CR
IP
T
AC
CE
PT
ED
To identify the different domains inherent in the questionnaires, two procedures were followed. First, from a
284
theoretical point of view, the different subdomains that were found in literature and proposed in the framework
285
of Attia et al. (2018) were tested using confirmatory factor analysis (CFA) [2]. The results of this CFA showed
286
that the seven domains identified in Table 1, based on the literature review and framework developed by Attia et
287
al. (2018) could not be discriminated based on the results presented in Table 3 [2].
288
Secondly, an exploratory factor analysis was carried out to reveal the different domains that could be
289
discriminated. Based on the principal component analysis only three domains out of seven domains have been
290
retained using the Eigenvalue criterion. Table 3 displays the Eigenvalues from this principal component analysis
291
underlining the 3-factor solution. Note that this three factor solution explains 64% of the variation present in the
292
different items that were measured. Only the Thermal Comfort (TC) and Acoustic Comfort (AC) were
293
discriminated under two groups. The other items belong to a General (G) domain. See Appendix A.
294
Table 3, Eigenvalues of the Correlation Matrix: Total = 14 Average = 1
295
Eigenvalue Difference Proportion Cumulative
Q1 5.830 3.708 0.416 0.416 Q2 2.122 1.106 0.151 0.568 Q3 1.015 0.145 0.072 0.640 Q4 0.869 0.131 0.062 0.702 Q5 0.738 0.071 `0.052 0.755 Q6 0.667 0.110 0.047 0.803 Q7 0.556 0.105 0.039 0.842 Q8 0.451 0.062 0.032 0.875 Q9 0.389 0.046 0.027 0.902 Q10 0.342 0.052 0.024 0.927 Q11 0.289 0.012 0.020 0.948 Q12 0.276 0.026 0.019 0.967 Q13 0.250 0.050 0.017 0.985 Q14 0.199 0.014 1.000
296
3.3 Item retention within domains
297
The standardized regression weights results indicate that most of items show a strong relationship between the
298
individual items and the latent dimension factors or domain (see Table 4). This confirms the validity of the new
299
domains structure (G, TC and AC) and the strong correlation between each domain and the investigated items.
300
See Appendix A.
301
Table 4, Standardized Regression Weights: (Group number 1 - Default model)
302
Items Domains Correlation
with
Q9
←
TC ,716Q8
←
TC ,832Q7
←
TC ,637M
AN
US
CR
IP
T
AC
CE
PT
ED
Items Domains Correlation
with Q3
←
G ,597 Q2←
G ,721 Q4←
G ,828 Q5←
G ,761 Q6←
G ,754 Q12←
G ,788 Q13←
G ,560 Q10←
G ,584 Q11←
G ,660 Q14 n/a AC -303
The correlation between the ten items (questions) of the General (G) domain was analyzed using the Pearson
304
correlation coefficient. As presented in Table 5, all items had a factor loadings ≥ 0.3. Item-to-item correlations
305
of 0.3–0.8 were considered sufficient to group the ten items indicated in Table 5 within the General domain (G).
306
This proofs correlations sufficient to group items according to the domain. See Appendix A.
307
Table 5, Pearson Correlation Coefficients of General Domain Questions
308
Pearson Correlation Coefficients, General Domain, N = 140, Prob > |r| under H0: Rho=0
Q1 Q3 Q2 Q4 Q5 Q6 Q10 Q11 Q12 Q13 Q1 1.000 0.493 0.679 0.6320 0.504 0.553 0.406 0.445 0.517 0.369 Q3 1.000 0.498 0.527 0.411 0.530 0.408 0.317 0.362 0.287 Q2 1.000 0.600 0.520 0.585 0.441 0.365 0.510 0.396 Q4 1.000 0.585 0.571 0.555 0.611 0.641 0.453 Q5 1.000 0.652 0.396 0.489 0.665 0.425 Q6 1.000 0.324 0.405 0.577 0.452 Q10 1.000 0.430 0.416 0.386 Q11 1.000 0.644 0.288 Q12 1.000 0.505 Q13 1.000
309
The correlation between the three items (questions) of the Thermal Comfort (TC) domain was analyzed
310
using the Pearson correlation coefficient. As presented in Table 6, all items had a factor loadings ≥ 0.45.
Item-311
to-item correlations of 0.3–0.8 were considered sufficient to group the three items indicated in Table 6 within
312
the Thermal Comfort (TC) domain. This proofs correlations sufficient to group items according to the domain.
313
See Appendix A.314
315
316
317
318
M
AN
US
CR
IP
T
AC
CE
PT
ED
Table 6, Pearson Correlation Coefficients of Thermal Comfort Domain Questions
319
Pearson Correlation Coefficients, Thermal Comfort N = 140
Q18 Q19 Q20 Q18 1.000 0.523 0.459 Q19 1.000 0.599 Q20 1.000
320
4.4. Validity321
Discriminant validity was assessed by comparing the correlation among the latent dimensions (see Table 7), in
322
comparison to the individual correlations (correlations Tables 5-6). From this table one could see that the
323
correlation between the different dimensions are weak (correlation between TC, and AC, and TC and G), and
324
only moderate between G and AC. See Appendix A.
325
Table 7, Correlations between Thermal Comfort and Acoustic Perception and Thermal Comfort and General
326
Domain
327
Domain Correlations Estimate
TC ↔ AC ,346 TC ↔ G ,123 G ↔ AC ,547
328
4.5. Reliability329
For reliability and internal consistency we calculated the Cronbach alpha’s of the three domains. A high
330
Cronbach alpha is indicating a large shared variance, indicating good internal consistency. The Cronbach-alpha
331
score for Thermal Comfort (TC) domain was 0.770, indicating a good repeatability of survey scores submitted
332
for the same occupant. Also, the Cronbach-alpha score for the General (G) domain was 0.904, indicating a very
333
good repeatability of survey scores submitted for the same occupant. See Appendix A.
334
4.6. Final Survey OCAFAS-15
335
Based on factor analysis the original OCAFAS-14 (Appendix A) items were consolidated into 15 items
336
organized into three domains, namely, general feeling (10 items), thermal comfort (3 items) and acoustic
337
comfort (2 items) [37]. The final OCAFAS-15 (Appendix B) retained all question related to the interaction with
338
the façade and it’s and control adaptation. Item-to-domain correlation for OCAFAS-15 demonstrated significant
339
correlation of all items within their respective domains. Factor analysis of the three-domain survey demonstrated
340
the created survey is valid and can assess the well-being and interaction of occupants in buildings with adaptive
341
facades.
342
343
344
M
AN
US
CR
IP
T
AC
CE
PT
ED
4. Discussion:345
5.1 Summary of main findings
346
Guided by the factorial analysis, the original six domains, OCAFAS-17 survey was reduced to a smaller
three-347
domain, 15 item survey, OCAFAS-15. The analysis showed that: (1) the structure of the different domains
348
(General Feeling, View, Visual Comfort, Adaptation Control and User Interaction) was perceived by the
349
respondents as one domain. (2) Thermal Comfort was perceived as a distinguished domain. (3) Acoustic
350
Perception Comfort was perceived as a distinguished domain. (4) The Acoustic Comfort domain needed to be
351
amended to include at least two items (questions). (5) Study results indicate that the OCAFAS-15 has good
352
validity, reliability, high internal consistency to assess the well-being and interaction of occupants in buildings
353
with adaptive facades. The correlations are sufficient to group the 15 items under three major domains. See final
354
survey in Appendix B.
355
5.2 Strength and Limitations
356
We created a new survey and validated it with a sample of N-140 responses in a real office building with an
357
adaptive facade. No previous study, explored this terrain and until this moment there is no single survey for
358
adaptive facades that is open-access and validated through N=140 responses. Our work is part of the activities of
359
COST Action TU1403, European Solar Shading Organization and ISO Committee 52022-5 activities. Experts in
360
those organizations explicitly identified the need to create surveys that are validated and that can be used to
361
assess users’ satisfaction and interaction in buildings with adaptive facades [1-2]. The findings of the past
362
Annex 66, and ongoing Annex 79 efforts confirm that in automated buildings, occupants remain one of the
363
greatest influences of building energy use [38-39]. For instance, Hong and Lin (2013) showed that occupant
364
behavior at the office scale could increase energy use by 80% or reduce it by 50% from standard assumptions
365
[40]. There is an increasing global expectation for comfort and user satisfaction, which necessitated a new look
366
at how occupants are incorporated into building design and operation. In this context, our paper presents one of
367
the rare case studies where researchers get access to a building with an adaptive façade and inquire about users’
368
interaction and satisfaction. For this research, we consulted a statistics scientist and linguistic expert to create a
369
new survey that we consider as a good start. We know that our survey is not perfect but it should be seen as
370
novel contribution that future researcher should build upon and turn it from a generic survey to more technology
371
and context specific survey.
372
The proposed approach has been implemented among participants of an office building with an external
373
dynamic shading system made of movable louvres. In order to use the questionnaire, all occupants of a building
374
had an equal chance of participating in the survey for our select (random) sample. Thus, in the context of this
375
research, we focused on occupants of office buildings with an adaptive façade in French Speaking Belgium, that
376
do paper and computer office work. 31% of the participants were females and 69% were males with a total
377
average age of 43 years. The 140 response of occupants working in office spaces with automated and movable
378
shading, suggest that OCAFAS-15 is useful for post-occupancy evaluations. We believe that the new survey
379
could be particularly useful for occupants to encourage discussion of occupant satisfaction and productivity in
380
relation to user interaction, façade adaptation control and comfort perception [1-3]. The OCAFAS-15 is a short
381
survey with an average response time of 12 minutes that can assess the well-being and interaction of occupants
M
AN
US
CR
IP
T
AC
CE
PT
ED
in buildings with adaptive facades. The survey benefits from its brevity and ease of completion. The
OCAFAS-383
15 survey includes multiple domains and emphasizes the relation with external facades parameters for the
well-384
being and interaction of occupants. In this respect, it differs from surveys that focus on mainly on indoor
385
environmental parameters such as thermal and visual comfort [11, 26 and 41]. It should be noted that parameters
386
directly discernable by the real building occupants have been reported to be more likely to have greater
387
reliability compared to experimental test-based studies [3].
388
The ultimate goal of well-being and occupants interaction assessment is to focus on well-being as the first
389
consideration in designing adaptive facades [2]. In this respect, a well-being and occupants interaction survey
390
has a potential role in influencing design decisions and assessing control strategies for automated movable
391
shading particularly when the goals is to inform designers during design or operators during operation. Other
392
benefits of a well-being and occupants interaction questionnaire are to raise awareness among adaptive façades
393
designers and operators of factors that influence well-being of occupants, monitor change in satisfaction over
394
time, improve compliance, increase the occupant’s sense of interaction in the facades’ operation, and improve
395
the practice’s relationship with solar shading designers, contractors and operators. To illustrate, 82% (115/140)
396
of occupants investigated in this study stated that they dissatisfied with the interaction with the movable shading
397
system and that the survey made them feel more involved in articulating their concerns.
398
Ensuring a good quality survey with different domain and scales is not an easy task. It requires a way of
399
asking and wording the questions and many years of experience to make a survey mature. When surveys include
400
multiple domains, it gets more complicated because each domain and its correlations with other items need to be
401
validated. We recognize that there is an entire field in social sciences and even third-party survey providers that
402
is devoted to survey and scale development-psychometrics [42]. We recognize that the 140 responses from two
403
tests provided by 70 respondents are little. In the same time, it might be difficult for façade engineers to
404
understand the reasons of satisfaction or dissatisfaction in the presented case study. However, in this study we
405
did not seek to assess this specific case study. We aimed to create a tool that can be used to enable a dialog
406
between occupants and façade engineers. Adaptive facades with automated movable shading are a niche type of
407
buildings and we believe are the first study to investigate users in such buildings with a sample of 70
408
respondents [3].Also, we believe this work will allow to benchmark working environments with adaptive
409
facades and to be able in the future to create a database of case studies [32, 43 and 44]. In the recent years,
410
several certified green buildings were designed following an integrative design process where Design, Build and
411
Operate (DBO) contracts are performance driven. Thus, our survey can be used as a tool for post-occupancy
412
evaluation and it can provide feedback to integrative design teams. Our aim in this study is not to establish that
413
dialogue between building designers and operators. This is not our responsibility. However, our aim is to
414
provide a tool that can be used to enable this dialogue within green certified and DOB contracted project
415
including the case of our case study [45].
416
Needless to say, we only chose one time interval during the autumn on the 23rd of November and 4th of
417
December from 14:00 to 15:00. We should ideally have tested our survey three times daily by selecting
418
representative days at least in four seasons of the year. However, we could not have a full access to repeat our
419
survey. We hardly got access to this building after several trials with building owners of adaptive facades. We
420
did our best to push the limits and get a good representative sample of occupants who can help us to shape a
M
AN
US
CR
IP
T
AC
CE
PT
ED
generic survey that can be developed in the future. But we had the advantage to have all respondents in the same
422
building in a space with the same orientation and interior setting. Another limitation is that we focused mainly
423
on surveys responses and did not include any measurement in the study. In fact, we did not want to provide an
424
assessment of the current building, we rather wanted to create a new survey that can be used easily by
425
professionals and researchers in buildings with automated dynamic facades. Also, the for the Acoustic Comfort
426
domain we included in the running survey only one single question. However, the occupants indicated the
427
importance to include at least two questions related to noise disturbance.
428
4.3 Future Work
429
In summary, this study presents a novel survey with good validity to be used to assess occupants’ well-being
430
and interaction in buildings with automated dynamic facades. Future research should test our survey in a wider
431
context with a larger sample of respondents with respect to different orientations, climates, view types and time
432
of the year. More work is also needed to test the three suggested domains and in particular the General Feeling
433
domain. We expected that visual comfort would lead to the creation of an independent domain, however, the
434
factor analysis proofed we were wrong. Surprisingly, acoustic comfort emerged as an important domain that was
435
undermined in our initial classification. Future research should, extend the Acoustic Comfort domain and add
436
more items and measure their validity and relevance. We believe that the same questionnaire can be adopted for
437
other type of commercial buildings with similar functional uses and similar dynamic shading technology.
438
Further research and adoption of the same framework would be excellent avenues for further research for further
439
validating and generalizability of the proposed survey for chromogenic, solar active and insulative facades.
440
It is clear that occupants’ well-being and interaction surveys in buildings with automated dynamic facades
441
can take various forms and still be useful instruments. However, we have currently very few of them. Therefore,
442
researcher should create more surveys for the evaluation of experience and self-reported health and well-being
443
of building occupants. We believe that a statistically, valid and reliable instrument for evaluating the satisfaction
444
and well-being of occupants in building with automated and dynamic facades provided an excellent opportunity
445
for considering what is most important to the occupant and to convey to facade designers and façade operators
446
that the occupant well-being and satisfaction is their primary consideration. Finally, we encourage researcher to
447
develop more specific surveys that cover the different technologies of adaptive facades from an
occupant-448
centered approach. Future surveys should address electrochromic facades and solar active facades and not only
449
automated dynamic facades.
450
5. Conclusion
451
Study results indicate that the OCAFAS-15 has good validity in assessing well-being and interaction of
452
occupants in buildings with adaptive facades. The OCAFAS-15 is a reliable and consistent survey that is brief
453
and easy to complete (generally, 12 min or less). A statistically valid and reliable survey for evaluating
454
occupants’ satisfaction provides façade designers and operators with a useful tool for considering what is most
455
important to the occupant. The survey can guide facades design decisions, and convey to the operators and
456
building owners that the occupants’ well-being and interaction in buildings with adaptive facades is the facades
457
community’ primary consideration.
M
AN
US
CR
IP
T
AC
CE
PT
ED
459
6. Acknowledgements460
The authors express their thanks to all survey respondents. This research was partially funded by the European
461
Cooperation in Science and Technology Action TU 1403. The authors would like to gratefully acknowledge
462
COST Action TU1403 “Adaptive Facades Network” for providing excellent research networking. The authors
463
would like to acknowledge the support of Working Group 3 members.
464
Also, we would like to acknowledge the Sustainable Building Design Lab for the survey development and the
465
valuable support during the experiments and the analysis of data.
466
Appendix A – The initial survey questions can be found in the following link: http://tinyurl.com/y6rw6avh
467
Appendix B
468
– The Occupant-Centered Adaptive Façades Assessment Survey (OCAFAS-15) can be found in Table 8 and in
469
the following publication: Attia S., 2019, Occupant-Centered Adaptive Façades Assessment Survey
(OCAFAS-470
15), Liege University, Belgium, available at: https://orbi.uliege.be/handle/2268/232980, accessed 15.02.2019
471
472
473
474
475
476
477
478
479
480
481
482
483
484
485
486
487
M
AN
US
CR
IP
T
AC
CE
PT
ED
Table 8, Occupant-Centered Adaptive Façades Assessment Survey (OCAFAS-15)
488
Occupant-Centered Adaptive Façades Assessment Survey (OCAFAS-15)
Part A: Personal data
A1: Gender
Man
Woman
A2: Age
A3: How long have you been working here?
A4: Are you near a window (within 4 m)?
YES
NO
A5: Are you near an exterior wall (within 4 m)?
YES
NO
A6: What best describes the area of building
where your space is located?
North
East
South
West
Core
Don't know
A7: On which floor of the building is your space
located?
1rst
2nd
3rd
Other :A8: In which place do you spend most of your
time?
1
2
3
4
5
A9: Which of the following do you personally
adjust or control in your space?
Windows blinds or shades Room AC unit Portable heater Permanent heater Door to interior space Door to exterior space Adjustable air vent in wall or ceiling Ceiling fan Ajustable floor/air vent (diffuser) Portable fan Thermostat Operable window None of these Other :
A10: Do you work mostly on computer or paper?
Computer Paper BothPart 1: General feeling
1=not at all5=Extremely Good
Q1: Are you satisfied with the facade?
1
2
3
4
5
Q2: How satisfied are you with the current view
to outside?
1
2
3
4
5
Q3: How important is it for you to have a clear
view of the outside?
1
2
3
4
5
Q4: How often are you disturbed by glare (direct
sunlight, bright sky, or bright walls)
1
2
3
4
5
Q5: How do you judge the current illuminance
level on the work plane?
1
2
3
4
5
Q6: How comfortable is the current illuminance
level on the work plane?
1
2
3
4
5
Q7: Do you think the facade management
M
AN
US
CR
IP
T
AC
CE
PT
ED
Q8: Does the change of brightness and view
due to the movement of the facade disturb you?
1
2
3
4
5
Part 1: General feeling
1=not at all5=Extremely Good
Q9: Are you satisfied with the interaction you
have with the facade?
1
2
3
4
5
Q10: Are you satisfied with the dashboard
(feedback screens) functionality?
1
2
3
4
5
Do you have any other comments regarding your general feeling?
Part 2: Thermal comfort
1=not at all5=Extremely Good
Q11: How do you rate you're immediate thermal
sensation:
Cold
Slightly
cool
Neutral
Slightly
warm
Hot
Q12: How do you perceive this temperature
1
2
3
4
5
Q13: Are you satisfied with the temperature in
general?
1
2
3
4
5
Do you have any other comments regarding thermal comfort?
Part 3: Acoustic comfort
1=not at all5=Extremely Good