HAL Id: ird-00940286
https://hal.ird.fr/ird-00940286
Submitted on 31 Jan 2014
HAL is a multi-disciplinary open access archive for the deposit and dissemination of sci-entific research documents, whether they are pub-lished or not. The documents may come from teaching and research institutions in France or abroad, or from public or private research centers.
L’archive ouverte pluridisciplinaire HAL, est destinée au dépôt et à la diffusion de documents scientifiques de niveau recherche, publiés ou non, émanant des établissements d’enseignement et de recherche français ou étrangers, des laboratoires publics ou privés.
Rapid detection and identification of nontuberculous
mycobacterial pathogens in fish by using high-resolution
melting analysis
Thu Nguyet Phung, Domenico Caruso, S. Godreuil, N. Keck, T. Vallaeys,
Jean-Christophe Avarre
To cite this version:
Thu Nguyet Phung, Domenico Caruso, S. Godreuil, N. Keck, T. Vallaeys, et al.. Rapid detection and identification of nontuberculous mycobacterial pathogens in fish by using high-resolution melting analysis. Applied and Environmental Microbiology, American Society for Microbiology, 2013, 79 (24), pp.7837-7845. �10.1128/AEM.00822-13�. �ird-00940286�
1 Rapid detection and identification of non-tuberculous mycobacterial pathogens in fish
1
using high resolution melting analysis (HRMA)
2
3
4
Thu Nguyet Phung 1,2, Domenico Caruso 2, Sylvain Godreuil 3, Nicolas Keck 4, Tatiana
5
Vallaeys 5, Jean-Christophe Avarre 2#
6
7
1
Institute of Biotechnology (IBT), Vietnam Academy of Science and Technology (VAST), 18 Hoang 8
Quoc Viet Road, Cau Giay, Hanoi, Vietnam 9
2
Institut Recherche pour le Développement (IRD), UMR226 ISEM, 361 rue Jean Francois Breton, 10
34196 Montpellier cedex 05, France 11
3
INSERM U1058, CHU Arnaud de Villeneuve, 371 avenue du doyen Gaston Giraud, 34295 12
Montpellier Cedex 05, France 13
4
Laboratoire Départemental Vétérinaire de l’Hérault, 306 rue Croix de Las Cazes, CS 69013, 34967 14
Montpellier Cedex 2, France 15
5
Université Montpellier 2, UMR5119 ECOSYM, Place Eugène Bataillon, 34095 Montpellier cedex 16 05, France 17 #jean-christophe.avarre@ird.fr 18 19
Running title: identification of fish mycobateria by HRMA
2 Abstract
21
Mycobacterial infections in fish are commonly referred to as piscine mycobacteriosis,
22
irrespectively of the specific identity of the causal organism. They usually cause a chronic
23
disease and sometimes may result in high mortalities and severe economic losses. Nearly 20
24
species of Mycobacterium have been reported to infect fish. Among them, M. marinum, M.
25
fortuitum and M. chelonae are generally considered as the major agents responsible for fish
26
mycobacteriosis. As no quick and inexpensive diagnostic test exists, we tested the potential of
27
high resolution melting analysis (HRMA) to rapidly identify and differentiate several
28
Mycobacterium species involved in fish infections. By analyzing both the melting temperature
29
and melting profile of the 16S-23S rRNA internal transcribed spacer (ITS), we were able to
30
discriminate 12 different species simultaneously. Sensitivity tests conducted on M. marinum
31
and M. fortuitum purified DNA revealed a limit of detection of 10 genome equivalents per
32
reaction. The primers used in this procedure did not lead to any amplification signal with 16
33
control non-Mycobaterium species, thereby demonstrating their specificity for the genus
34
Mycobacterium.
35
3 Introduction
37
The non-tuberculous mycobacteria (NTM) are Gram positive, acid-fast and aerobic bacteria
38
that belong to the order Actinomycetales. They are widespread in the aquatic environment,
39
both in fresh and marine waters, where they can survive in hostile conditions by forming
40
biofilms (1). Some of them are the causative agents of fish mycobacteriosis, which
41
predominantly occurs as a chronic disease and occasionally in an acute form (2, 3). The
42
primary pathological lesions associated with the disease are grayish white nodules
43
(granulomas) in the internal organs such as liver, spleen or kidney, which may further lead to
44
high fish mortality and severe losses in aquaculture industry (4-6). Fish mycobacteriosis has
45
been reported to affect nearly 200 freshwater and saltwater species (7). Mycobacterium
46
marinum, M. fortuitum and M. chelonae are considered the main causative agents of fish
47
mycobacteriosis (2). However, many other Mycobacterium species have been found to be
48
associated with granulomas in aquarium, cultured and wild fish, among which M. abscessus,
49
M. gastri, M. smegmatis, M. bohemicum, M. gordonae, etc. (3, 6). NTM causing infection in
50
fish are divided between rapid growers (which develop visible colonies on solid media within
51
7 days) and slow growers (which require longer incubation times) (3, 8). Although
52
comprehensive surveys are rare, the frequency of NTM infection in cultured fish seems to
53
increase (9). For illustration, 135 out of 312 ornamental fish collected during an 18-month
54
survey were found positive for NTM, with 55% of them being positive by Ziehl-Neelsen
55
staining (10). Another study reported the isolation of Mycobacterium sp. from 29.9% of 127
56
ornamental fish batches imported into Italy (11). It was also shown that a low dose infection
57
of M. marinum results in the development of a latent disease (12). Yet, there are no validated
58
treatments for mycobacteriosis in fish: complete depopulation of asymptomatic carriers and
59
disinfection are the primary methods for controlling the disease (13). Some NTM species are
60
also responsible for human infections (9, 14), with an increasing incidence.
4 The rapid development of fish farming and of the ornamental fish trade has led to a
62
worldwide increase in the number of reports of mycobacterial infections in fish, with two
63
major consequences: (i) a substantial financial loss in the two above-mentioned industries and
64
(ii) an increased risk of contamination for people who handle fish (15-18). Therefore, early
65
surveillance systems based on a rapid identification of fish pathogens are critical for effective
66
disease control in aquaculture, and improved epidemiological surveys. Furthermore, some
67
authors have discussed specific recommendations for the policy on the importation of
68
ornamental fish (18), which should include the evaluation of bio-security procedures and
69
disease monitoring.
70
Over the last years, a great number of molecular methods, mostly based on nucleic acid
71
amplification, have been developed for the diagnosis of fish mycobacteriosis(reviewed in (6).
72
Recently, a commercial kit, the GenoType Mycobacterium CM (common Mycobacteria) kit
73
was introduced for identification of mycobacterial cultures (mainly from clinical origin). This
74
kit is able to identify 25 different species based on 16S rDNA gene hybridization. Combined
75
with another version, the AS (additional species) kit, the test can discriminate among 44
76
species in total, with success rate of ~96% over 219 tested isolates (19). However, the use of
77
this kit remains both time-consuming and costly, since it requires in most cases the prior
78
growth of mycobaterial isolates and the cost for one reaction remains far more expensive than
79
sequencing. Another commercial test exclusively targeting fish pathogens, the INNO-LipA
80
Mycobacteria v2 assay, was developed (20). This kit is also based on the hybridization
81
between Mycobacterial 16S-23S rRNA internal transcribed spacer and the corresponding
82
oligonucleotide probes immobilized on membrane strips. Although this kit is able to
83
distinguish 16 different Mycobacterium species with a rather good success rate (21), it still
84
relies on the isolate cultivation, which does not fulfill the speed requirements for large-scale
85
prevalence studies and epidemiological surveys.
5 Therefore, there is an urgent need for a fast, accurate, sensitive and cost-effective method
87
adapted to veterinary needs. Over the last few years, real-time PCR methods have been
88
developed and widely evaluated in studies for detection of Mycobacterium (22, 23). High
89
resolution melting analysis (HRMA), further developed from real-time PCR, is an emerging
90
technique in medical microbiology that may allow simultaneous detection and diagnosis of
91
pathogens at species and sub-species levels (24-26). This technique, first reported in 2002, is
92
based on the difference in melting behaviors of DNA molecules, according to their sequence,
93
length and GC content (25, 27). HRMA requires only ng amounts of DNA and has the
94
potential to discriminate closely related microorganisms with high accuracy, speed and
95
sensitivity.
96
The present study specifically aimed at developing an HRMA-based identification test of the
97
major Mycobacterium species affecting fishes. Targeting the 16S-23S rRNA internal
98
transcribed spacer (ITS), this assay relies on the measurement of differences in both the
99
melting temperature and melting profile.
100
101
Material and methods
102
103
Bacterial strains
104
Twelve NTM isolates were used as "reference" species in the present study. Among them, 5
105
were purchased from Pasteur Institute (Paris, France) as pure isolates, 2 were obtained from
106
the Laboratoire Départemental Vétérinaire (LDV, Montpellier, France) and consisted of
107
strains isolated from fish tissues, and 5 were isolated from human patients in Arnaud de
108
Villeneuve Hospital (Montpellier, France). A list of these strains is presented in table 1. All of
109
these strains, which had previously been identified by biochemical tests and/or sequencing,
110
were cultured on Lowenstein-Jensen (LJ) slants, and grown at 37°C for several days to
6 several weeks. In addition, 16 non-mycobacteria field isolates, including both fish
112
opportunistic and pathogenic bacteria, were also used for evaluating the specificity of the
113
assay (Table 1). These bacteria, which comprised 6 Gram positive and 10 Gram negative
114
species, were grown in their specific culture medium. All isolates were manipulated in a
115
biosafety level 2 containment laboratory.
116
117
Fish tissue samples
118
As one of the French approved laboratories, the Laboratoire Départemental Vétérinaire
119
(LDV34) of Montpellier (France) is requested by local fish farmers or owners to diagnose
120
their fish when these latter are suspected to carry infections. In this context, LDV34 holds a
121
small collection of fish samples that were either diagnosed for mycobacterial infections or
122
collected from infected farms. From this collection, 30 fish samples were used for validating
123
the PCR-HRM test described in this study, together with 3 DNA samples extracted from
124
mycobacterial cultures isolated from some of these fish. The list and origin of these samples
125
are presented in table 2.
126
127
Genomic DNA isolation
128
DNA from all samples (bacterial strains and fish tissues) was purified with the Wizard®
129
Genomic DNA Purification kit (Promega), following the appropriate protocol provided in the
130
kit. For Gram positive cultures, a slightly modified protocol was used. Bacterial colonies were
131
resuspended in 480 µl of EDTA solution (50 mM, pH8). After addition of 120 µl of lysozyme
132
(10 mg/ml), bacterial cells were incubated for 1 hr at 37°C, centrifuged for 5 min at 13,000 g,
133
resuspended in 600 µl of nuclei lysis solution, incubated again for 10 min at 100°C and
134
cooled to room temperature. This lysate was then supplemented with 20 µl of proteinase K
135
(20 mg/ml) and incubated for another 3 hrs at 55°C, under gentle shaking. The rest of the
7 procedure was performed according to the manufacturer's instructions. DNA from Gram
137
negative isolates and from fish tissues was extracted following the Gram negative and animal
138
tissue protocols provided in the kit, respectively. In all cases, DNA was eluted in 70 µl of the
139
provided Tris-EDTA solution and its concentration measured by UV spectrometry
140
(NanoDrop® ND-1000 spectrophotometer, NanoDrop Technologies Inc). Bacterial genomic
141
DNA was adjusted to approximately 0.5x10⁴ or 0.5x10⁶ genome equivalents µl-1, based on an
142
average genome size of 6.6 Mb, whereas fish DNA was diluted to 10 ng µl-1.
143
144
Assay design
145
Since the assay aimed at being as simple as possible, it relied on the use of a double-strand
146
intercalating - and thus non-sequence specific - fluorophore for measuring differences in
147
melting profiles of amplification products. Under such conditions, the targeted genomic
148
region had (i) to be unique for each of the investigated species and (ii) to harbor conserved
149
sequences at its extremities enabling genus-specific amplification. Multiple alignments of
150
different genomic regions (including the 16S-23S ribosomal operon, the -subunit of RNA
151
polymerase (rpoB), the 65-kD heat shock protein (hsp65) and the B-subunit of DNA gyrase
152
(gyrB) genes) were realized with ClustalX v2 (28) on sequences imported from the NCBI
153
collection (www.ncbi.nlm.nih.gov). They revealed that the internal transcribed spacer (ITS)
154
region could fulfill these requirements. From these alignments, a single primer pair was
155
subsequently designed to amplify a fragment of ~220 to ~320 bp in all the targeted
156
mycobacterial species (forward GCTGGATCACCTCCTTTCTA and reverse
157
AGATGCTCGCAACCACTAT). The primers were verified for the absence of secondary
158
structures with GeneRunner v3.01 (Hasting Software, Inc. 1994) and purchased from
159
Eurofins-MWG-Operon.
8 The amplification and melting steps were achieved using the LightCycler®480 high
161
resolution melting master kit (Roche). The reaction mixture was composed of 2X Master mix,
162
MgCl2, forward and reverse primers, genomic DNA and PCR-grade water, in a final volume
163
of 10 µl. The amplification procedure consisted of an initial denaturation followed by 45
164
cycles of denaturation, annealing and elongation. After amplification, the melting program
165
was set up by heating to 95oC for 1 min, cooling to 40oC for 1 min and applying a temperature
166
ramp from 65 to 95oC with a transition rate of 0.2oC s-1 and a continuous fluorescence
167
monitoring. Each reaction was run in triplicate in 96-well plates, with the LightCycler® 480
168
System (Roche). Each PCR-HRM run included one negative control where the DNA template
169
was replaced by water.
170
171
Sensitivity and specificity
172
For determination of the assay sensitivity, serial 10-fold dilutions of known genomic DNA
173
concentrations of M. fortuitum and M. marinum were prepared in (i) sterilized distilled water
174
and (ii) 100 ng of genomic DNA extracted from Pangasianodon hypophtalmus fish liver. The
175
number of genome equivalents was estimated from the measured DNA concentrations and the
176
size of the fully sequenced M. marinum genome (6.66 Mb). Serial dilutions of M. fortuitum
177
and M. marinum DNA covered the range of 106 to 1 genome equivalents, and standard curves
178
were drawn from these measurements performed under the same conditions as described
179
above. Because mycobacterial genomes may carry 1 or 2 ribosomal RNA (rRNA) operons
180
(29, 30), results were always expressed as genome copies or genome equivalents, and not as
181
16S-23S (ITS) copies.
182
Specificity of the assay was evaluated on 16 non-mycobacterial isolates, including 7 Gram
183
positive and 9 Gram negative species (Table 1). The amount of non-mycobacterial DNA in
184
each reaction was adjusted to approximately 106 genome equivalents (based on an average
9 genome size of 6 Mb). Positive controls consisted of 2 mycobacterial species (M. marinum
186
and M. fortuitum) and their DNA amount was set to ~104 genome equivalents only. To ensure
187
the integrity of these 18 genomic DNAs, they were subsequently amplified with a pair of 16S
188
universal primers (31) in a 2720 thermal cycler (Applied Biosystems). PCR mixtures
189
contained 5 µl of 2X master mix (Fast-Start PCR kit, Roche), 0.8 µM of forward
(5'-190
GCACAAGCGGTGGAGCATGTGG-3') and reverse (5'-
GCCCGGGAACGTATTCACCG-191
3') primers and 2 µl of template DNA, in a final volume of 10 µl. Amplification consisted of
192
30 cycles of denaturation (95°C, 30 sec), annealing (60°C, 30 sec) and elongation (72°C, 30
193
sec) and PCR products were observed on 1% agarose gel electrophoresis containing SYBR
194
Safe DNA gel stain (Invitrogen).
195
196
High resolution melting analysis
197
The LightCycler®480 software package (version 1.5.0.39) was utilized for both PCR and
198
HRM analyses. After each run, cycles of quantification (Cq) were calculated in order to
199
ensure that each DNA template had been successfully amplified. All amplifications that
200
resulted in Cq values > 30 were arbitrarily considered negative and were therefore excluded
201
from subsequent analyses. Melting profiles were analyzed with the gene scanning function, in
202
a standardized way. First, melting curves were normalized in the pre-melting and post-melting
203
regions; the normalization temperature range was 81 to 81.5°C and 92 to 92.5°C, respectively.
204
Then, a temperature shift was applied on normalized curves with a threshold set at 5% of
205
normalized fluorescence. Finally, melting curves were classified into groups with a default
206
sensitivity of 0.3 and using the auto-group function. This way, curves showing nearly
207
identical shapes were grouped together and were depicted in the same color for easy
208
visualization. Yet, since the software enables a classification into a maximum of 6 groups
209
only, a Tm calling was also applied in order to record the melting temperature of each
10 product. Species were then discriminated according to both their melting profile and melting
211
temperature (Tm).
212
213
Validation of the assay with blind samples
214
To evaluate the ability of this PCR-HRM assay to identify unknown specimens, 30 tissues
215
originating from either infected fish or fish collected from infected ponds, as well as 3 DNA
216
samples extracted from mycobacterial cultures isolated from some of these fish, were
217
investigated (Table 2). DNAs from these samples were blindly subjected to PCR-HRM,
218
together with the 12 Mycobacterium "reference" species (M. marinum, M. fortuitum, M.
219
chelonae, M. gordonae, M. smegmatis, M. phlei, M. bohemicum, M. pseudoshottsii, M.
220
abscessus, M. haemophilum, M. avium, M. gastri) and one negative control (no DNA).
221
Amplification yield was first verified and samples that displayed a Cq value < 30 were
222
tentatively assigned a species name through the successive analysis of the melting profile and
223
Tm. For confirmation, samples that displayed one single amplification product were sent for
224
sequencing to Genoscreen company (Lille, France).
225
226
Results
227
228
Specificity of the primers
229
Tested on genomic DNA extracted from pure bacterial cultures, the primers specifically
230
designed for this assay successfully amplified all of the 12 assessed Mycobacterium species,
231
including M. marinum, M. fortuitum and M. chelonae (3). The amplification resulted in
232
products of the expected size, comprised between approximately 220 and 320 bp. For 7 of the
233
analyzed strains, a single product was amplified, as revealed by melting peaks obtained from
234
the first derivative of fluorescence over temperature. Yet, for M. abscessus, M. gastri and M.
11
haemophilum strains, a small secondary melting peak was always observed, whereas the peak
236
shape of M. chelonae and M. fortuitum contained a minor "shoulder" (not shown). Probably
237
because the secondary melting peaks were small, the LightCycler® 480 software detected two
238
Tm values solely for M. gastri. In this case, only the Tm corresponding to the main peak was
239
taken into consideration. The occurrence of secondary melting peaks, mostly in fast-growing
240
species, may be due to the existence of 2 rRNA operons (29, 32). However, the melting
241
curves for these species were highly reproducible over experiments, as they were identical in
242
all subsequent HRM runs.
243
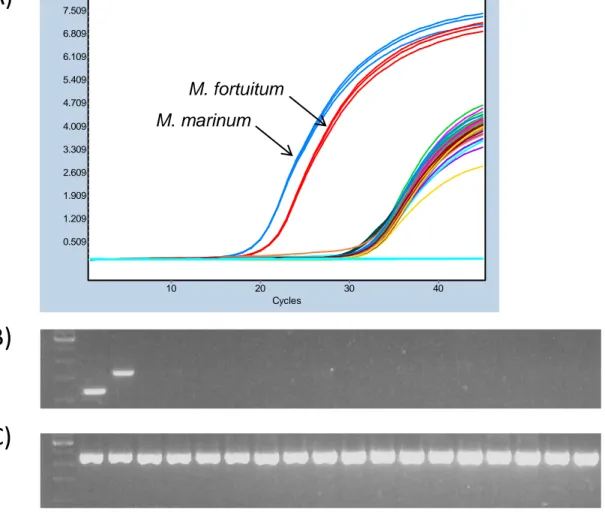
When tested on a range of non-mycobacterial species (see table 1), the primers always yielded
244
Cq values above 30, i.e. below the detection threshold, with no detectable band on agarose gel
245
electrophoresis (Figure 1). It is noteworthy that the amount of tested genomic DNA for these
246
16 non-mycobacterial strains was elevated, as it approximated ~106 genome equivalents. In
247
comparison, the two major pathogens M. marinun and M. fortuitum, tested at a 100-fold lower
248
DNA concentration (about 104 genome copies), resulted in Cq values around 19-20. When
249
universal primers for 16S rDNA were tested on the same DNAs, all the strains yielded an
250
amplification product of nearly the same intensity, demonstrating that neither PCR inhibition
251
nor DNA degradation occurred (Figure 1c).
252
253
Sensitivity of the PCR-HRM assay
254
Sensitivity tests were conducted on M. marinum and M. fortuitum DNAs, assuming that
255
results would be comparable for the other strains, since the use of equivalent DNA
256
concentrations yielded nearly similar Cq values for all the tested strains. As described
257
previously, the detection threshold was set to 30 cycles, because Cq values of negative
258
controls were always comprised between 30 and 35, probably because of a slight
primer-259
dimer formation, undetectable neither on agarose gel electrophoresis nor by melting curve
12 analysis. Using this threshold, the assay was able to accurately and reproducibly detect as low
261
as 10 copies of M. marinum and M. fortuitum genomes in two experimental backgrounds, i.e.
262
water and fish DNA. Figure 2 presents the amplification results obtained for M. marinum and
263
M. fortuitum diluted in 100 ng of fish DNA. The faint band observed on gel electrophoresis
264
for 1 genome equivalent of M. marinum (Figure 2b) was not considered significant.
265
Furthermore, the relation between fluorescence intensity and DNA quantity was linear over 6
266
logs for the dilutions in fish DNA (R2= 0.999 and 0.998 for M. marinum and M. fortuitum,
267
respectively) as well as for the dilutions in water (R2= 0.997 and 0.998 for M. marinum and
268
M. fortuitum, respectively) (Figure 3). Therefore, the presence of fish DNA, which reflects the
269
actual nature of biological samples, did not alter the sensitivity of Mycobacterium detection.
270
271
Analysis of melting profiles
272
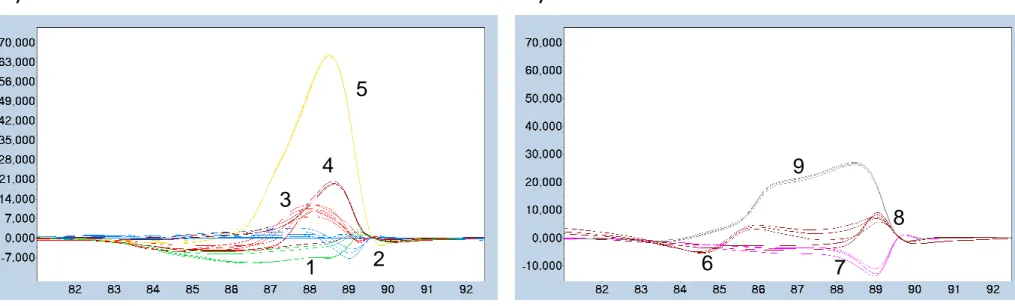
Twelve strains were tested for their ability to be discriminated according to their melting
273
profile and melting temperature. Analysis of the melting curves showed the presence of 9
274
distinct melting profiles, as illustrated by the difference plots in figure 4. Yet, the strains that
275
shared identical melting profiles could be differentiated by a distinct Tm (Table 3), thereby
276
enabling a total discrimination of the 12 species. Reliability of such strain classification was
277
evaluated through different means. First, the intra-run repeatability of difference plots was
278
verified by (i) running 6 replicates of each strain and (ii) running 6 serial dilutions of M.
279
marinum and M. fortuitum, each in triplicate. As attested by figure 5, the replicate curves
280
could be superimposed. More importantly, the difference plots, and hence the grouping
281
ability, was not affected by the template DNA concentration, at least between 10 and 106
282
genome copies in the reaction. Secondly, measurement of the melting temperature of all of the
283
12 mycobacterial strains from three separate runs revealed a high reproducibility, as shown in
284
table 3. All but 3 standard deviations (SD) were ≤ 0.04°C, and the maximum SD was 0.12°C
13 (for M. fortuitum). Finally, when repeated 3 times from 3 independent runs, the HRM analysis
286
showed consistent grouping patterns. It is noteworthy that the 3 most frequent Mycobacterium
287
fish pathogens M. marinum, M. fortuitum and M. chelonae display somewhat different Tms.
288
Therefore, their identification could be simply done according to their Tm (Table 3).
289
290
Mycobacterium detection and species assignment in blind samples
291
Among the 30 fish tissue samples that were tested, only 10 could be successfully amplified
292
with the HRM primers, since the 20 others yielded Cq values higher than 30. Concentration of
293
these 10 samples varied between 20 and 1200 genome equivalents per reaction, or between ~1
294
and ~60 genome equivalents ng-1 of total genomic DNA since 20 ng of total DNA were used
295
in each reaction. Considering the mass of tissue used (20 mg) and the DNA yield (ng of total
296
DNA g-1 of tissue) for each extraction, such concentrations corresponded to approximately
297
7.5x10⁵ to 2.5x10⁷ genome copies g-1 tissue. The HRM analysis allowed assigning 3 of these
298
samples as M. marinum and 6 as M. phlei (Figure 6). Sequencing of the 9 corresponding
299
amplification products confirmed the species identification for 8 of them, while the remaining
300
one turned out to belong to M. malmoense, which is not included in the present assay. The last
301
positive sample presented a melting curve with double inflection, with Tm values comparable
302
to those of M. marinum (86.7°C) and M. phlei (90.9°C), suggesting the presence of a mixed
303
infection with those 2 species (Figure 6C). Regarding the 3 unknown DNAs, 2 could be
304
unambiguously assigned to M. marinum, while the third one was associated with M.
305
abscessus (not shown). Sequencing of the corresponding amplification products confirmed
306
this species identification for the 3 samples.
307
308
309
14 Discussion
311
To our knowledge, this is the first report of an HRM-based assay that enables rapid detection
312
and identification of several non-tuberculous mycobacterial species without relying on costly
313
probes such as molecular beacons or Taqman probes. When genomic DNA extracted from
314
pure cultures was used, the assay was able to confidently detect approximately 10
315
mycobacterial genomes per reaction. This low detection limit was comparable to that obtained
316
by Zerihum et al. (33), who used a Taqman probe, and slightly better than that reported by
317
Salati et al. (34) with a nested-PCR test. It is also comparable to the detection levels described
318
by Pakarinen et al. (35), whose results showed that the use of a hybridization probe did not
319
significantly improve the assay sensitivity. Moreover, the ability of species identification was
320
not affected by the initial DNA template amount, as melting curves obtained from 10-fold
321
dilutions of genomic DNA (corresponding to 107-10 genome equivalents) could be
322
superimposed (Figure 5B).
323
The mycobacterial concentrations of the unknown fish samples were estimated to range
324
between 20 and 1200 genome equivalents per reaction, which corresponded to approximately
325
7.5x10⁵ and 2.5x10⁷ genome equivalents g-1 of tissue. The lowest concentration was close to
326
the detection limit of the present assay, indicating that lower bacterial loads would be hardly
327
detected under the conditions used here. It is difficult to compare these values with those
328
obtained by other groups (33, 34), as the procedures used to estimate the minimal detectable
329
bacterial load from fish tissues were different. Technical culture may be considered as the
330
gold standard with a limit of detection close to 10 colony forming units (cfu) g-1 tissue (36).
331
However, in some situations, culture-based methods may underestimate the amount of
332
mycobacterial cells because of: i) the presence of viable but non-cultivable mycobacteria(37),
333
and ii) non-optimal culture conditions. The detection limit obtained in our study (~10
334
bacterial genomes per reaction) is comparable to that reported by others (33) on DNA
15 extracted from pure cultures (~6.5 cfu per reaction). Based on their calculations, our lowest
336
estimated concentration would thus correspond to ~150 cfu g-1 tissue. Such a detection limit
337
would therefore allow to reveal the presence of mycobacterium in most infected fish, as the
338
scarce information reporting mycobacterial loads in tissues of infected fish indicate values
339
comprised between 102 to 109 cfu g-1 tissue (38, 39). Optimization of the DNA extraction
340
protocol from fish tissue would possibly improve this sensitivity level. Moreover, our present
341
results confirm previous findings obtained by LDV34 (not published), i.e.: the 4 samples
342
found positive for M. marinum correspond to organs showing granulomas and sampled from
343
sick fishes that had been diagnosed as M. marinum; the 26 remaining ones corresponded to
344
fish that did not show any lesion, but were in contact with other infected fishes. However, the
345
fact that M. phlei was identified in 6 of them is rather surprising and requires further
346
investigation, as M. phlei is not known as a common NTM species in fish.
347
High resolution melting analysis has already been successfully used for discriminating related
348
species of bacteria (26, 40). Besides, by measuring the Tm of a small amplicon of the hsp65
349
gene, it was possible to differentiate Mycobacterium abscessus from M. chelonae, 2 very
350
close rapidly growing species that cannot be discriminated biochemically (41). The authors
351
hypothesized that with a Tm SD of less than 0.1°C, it should be possible to differentiate many
352
different species. In our case, M. abscessus and M. chelonae had pretty different melting
353
profiles, and could be discriminated by both their melting profile and melting temperature,
354
which differed by approximately 1.2°C. However, even though most Tm SDs were lower than
355
0.1°C, some species could not be identified solely according to their Tm (e.g. M. chelonae
356
and M. haemophilum or M. pseudoshottsii and M. bohemicum,). Thus, the combination of
357
both Tm and melting profile analysis increased the discriminative power of the assay.
358
Selection of the target sequence was made bearing in mind that some mycobacterial species
359
carry 2 rRNA operons, and that strains belonging to the same species may display sequence
16 differences. Therefore, the relative high length of the target amplicon (~220-320 bp,
361
depending on the species) was expected to confer a greater tolerance of the melting profile to
362
sequence changes. Among the unknown samples that were identified as M. marinum (Table
363
2), the sequence of two of them differed from the strain used as reference by 2 mismatches
364
located near the 5' extremity of the amplification product. Yet, the presence of 2 mismatches
365
did not significantly modify the Tm and did not prevent to classify these 2 strains as M.
366
marinum. The extent to which sequence variations affect melting profiles and temperatures
367
has not been quantified precisely. However, it is known that melting differences decrease as
368
the amplicon size increases (42), and the use of such a long amplicon in the present study is
369
likely to represent a limitation for the number of species that can be simultaneously
370
discriminated.
371
Anyhow, the results presented here show that this assay confidently discriminates 12
372
mycobacterial species, i.e. M. phlei, M. smegmatis, M. gastri, M. bohemicum, M. marinum, M.
373
fortuitum, M. chelonae, M. gordonae, M. pseudoshottsii, M. abscessus, M. haemophilum and
374
M. avium. Though it includes the most frequent reported fish pathogens, we cannot exclude
375
the possibility of a wrong species determination in the case of fish carrying uncommon
376
mycobacterial species not accounted for here. An alternative solution to increase the number
377
of species that can be simultaneously differentiated and reduce the probability of wrong
378
species assignment has recently been described (43). Although it looks very attractive, the use
379
of a combination of labeled probes dramatically increases the cost of the experiment. Besides,
380
it also seems to decrease the assay sensitivity, since the lowest bacterial concentration that
381
was tested (100 genome copies) yielded relatively high Cq values (around 35). This drop in
382
sensitivity is probably the result of a higher level of constraints induced by the simultaneous
383
use of 4 different probes that require consensus experimental conditions for optimal behavior.
17 Finally, compared to the 2 existing commercial kits (19, 21), the assay presented here presents
385
many advantages. First, the real-time PCR format makes possible to analyze many samples at
386
the same time. Indeed, using the 384-well plate format and running both reference and target
387
samples in triplicate, it is possible to simultaneously analyze more than 100 samples.
388
Secondly, since this PCR-HRM assay does not require prior mycobacterial culture, it takes
389
only a couple of hours to obtain results from fish tissue samples. Thirdly, the cost of such a
390
test will be much lower than that of the existing kits, since it is a one-step assay and it does
391
not rely on any costly labeled probe. A first estimation would place the cost of one reaction,
392
from sample to result, below 5 €. To conclude, the present PCR-HRM assay is accessible,
393
quick and inexpensive. It enables the detection of the presence of any mycobacterial genome,
394
since it uses genus-specific primers, as well as the identification of 12 mycobacterial species
395
directly from fish samples, without prior bacterial cultivation. Its format allows the analysis of
396
more than 100 unknown samples simultaneously, thus making possible to investigate the
397
prevalence of these pathogens at large scales and at a reasonable cost.
398
399
Acknowledgements
400
This work was made possible thanks to an EU post-doctoral MAHEVA fellowship. We would
401
like to thank Stéphanie Laurence, Hélène Boulet, Céline Fourré and Laura Boschiroli for their
402
technical help in strain cultivation. We are also grateful to Dr. Marc Engelsma and Dr.
Jean-403
François Bernardet for providing Gram positive bacteria. DC and JCA declare competing
404
financial interests, as they intend to make commercial use of the method described in this
405
paper. All other authors declare no conflict of interest. This is a publication IRD-DIVA-ISEM
406
2013-104.
407
408
18 References
410 411
1. Hall-Stoodley L, Brun OS, Polshyna G, Barker LP. 2006. Mycobacterium marinum
412
biofilm formation reveals cording morphology. FEMS Microbiol. Lett. 257:43-49.
413
2. Decostere A, Hermans K, Haesebrouck F. 2004. Piscine mycobacteriosis: a literature
414
review covering the agent and the disease it causes in fish and humans. Vet.
415
Microbiol. 99:159-166.
416
3. Gauthier DT, Rhodes MW. 2009. Mycobacteriosis in fishes: A review. Vet. J.
180:33-417
47.
418
4. Beran V, Matlova L, Dvorska L, Svastova P, Pavlik I. 2006. Distribution of
419
mycobacteria in clinically healthy ornamental fish and their aquarium environment. J.
420
Fish Dis. 29:383-393.
421
5. Bruno DW, Griffiths J, Mitchell CG, Wood BP, Fletcher ZJ, Drobniewski FA,
422
Hastings TS. 1998. Pathology attributed to Mycobacterium chelonae infection among
423
farmed and laboratory-infected Atlantic salmon Salmo salar. Dis. Aquat. Org.
33:101-424
109.
425
6. Jacobs JM, Stine CB, Baya AM, Kent ML. 2009. A review of mycobacteriosis in
426
marine fish. J. Fish Dis. 32:119-130.
427
7. Toranzo AE, Magarinos B, Romalde JL. 2005. A review of the main bacterial fish
428
diseases in mariculture systems. Aquaculture 246:37-61.
429
8. Stahl DA, Urbance JW. 1990. The division between fast- and slow-growing species
430
corresponds to natural relationships among the mycobacteria. J. Bacteriol.
172:116-431
124.
432
9. Falkinham JO. 1996. Epidemiology of infection by nontuberculous mycobacteria.
433
Clin. Microbiol. Rev. 9:177-215.
19 10. Prearo M, Zanoni RG, Dall'Orto BC, Pavoletti E, Florio D, Penati V, Ghittino C.
435
2004. Mycobacterioses: Emerging pathologies in aquarium fish. Vet. Res. Commun.
436
28:315-317.
437
11. Zanoni RG, Florio D, Fioravanti ML, Rossi M, Prearo M. 2008. Occurrence of
438
Mycobacterium spp. in ornamental fish in Italy. J. Fish Dis. 31:433-441.
439
12. Parikka M, Hammaren MM, Harjula S-KE, Halfpenny NJA, Oksanen KE, Lahtinen
440
MJ, Pajula ET, Iivanainen A, Pesu M, Ramet M. 2012. Mycobacterium marinum
441
causes a latent infection that can be reactivated by gamma irradiation in adult
442
zebrafish. PLoS pathogens 8:e1002944.
443
13. Noga EJ. 1996. Fish disease: diagnosis and treatment. Iowa State University Press.
444
14. Wagner D, Young LS. 2004. Nontuberculous mycobacterial infections: A clinical
445
review. Infection 32:257-270.
446
15. Durborow RM. 1999. Health and safety concerns in fisheries and aquaculture. Occup.
447
Med.-State Art Rev. 14:373-406.
448
16. Finkelstein R, Oren I. 2011. Soft tissue infections caused by marine bacterial
449
pathogens: epidemiology, diagnosis, and management. Current infectious disease
450
reports 13:470-477.
451
17. Lehane L, Rawlin GT. 2000. Topically acquired bacterial zoonoses from fish: a
452
review. Med. J. Aust. 173:256-259.
453
18. Passantino A, Macri D, Coluccio P, Foti F, Marino F. 2008. Importation of
454
mycobacteriosis with ornamental fish: Medico-legal implications. Travel medicine and
455
infectious disease 6:240-244.
456
19. Makinen J, Marjamaki M, Marttila H, Soini H. 2006. Evaluation of a novel strip test,
457
GenoType Mycobacterium CM/AS, for species identification of mycobacterial
458
cultures. Clin. Microbiol. Infect. 12:481-483.
20 20. Tortoli E, Mariottini A, Mazzarelli G. 2003. Evaluation of INNO-LiPA
460
MYCOBACTERIA v2: Improved reverse hybridization multiple DNA probe assay for
461
mycobacterial identification. J. Clin. Microbiol. 41:4418-4420.
462
21. Pourahmad F, Thompson KD, Taggart JB, Adams A, Richards RH. 2008. Evaluation
463
of the INNO-LiPA mycobacteria v2 assay for identification of aquatic mycobacteria.
464
J. Fish Dis. 31:931-940.
465
22. O'Mahony J, Hill C. 2002. A real time PCR assay for the detection and quantitation of
466
Mycobacterium avium subsp paratuberculosis using SYBR Green and the Light
467
Cycler. J. Microbiol. Methods 51:283-293.
468
23. Parashar D, Chauhan DS, Sharma VD, Katoch VM. 2006. Applications of real-time
469
PCR technology to mycobacterial research. Indian J. Med. Res. 124:385-398.
470
24. Castellanos E, Aranaz A, De Buck J. 2010. PCR amplification and high-resolution
471
melting curve analysis as a rapid diagnostic method for genotyping members of the
472
Mycobacterium avium-intracellulare complex. Clin. Microbiol. Infect. 16:1659-1662.
473
25. Ruskova L, Raclavsky V. 2011. The potential of high resolution melting analysis
474
(HRMA) to streamline, facilitate and enrich routine diagnostics in medical
475
microbiology. Biomed. Pap-Olomouc 155:239-252.
476
26. Šimenc J, Potočnik U. 2011. Rapid differentiation of bacterial species by high
477
resolution melting curve analysis. Prikladnaia biokhimiia i mikrobiologiia 47:283-290.
478
27. Reed GH, Kent JO, Wittwer CT. 2007. High-resolution DNA melting analysis for
479
simple and efficient molecular diagnostics. Pharmacogenomics 8:597-608.
480
28. Larkin MA, Blackshields G, Brown NP, Chenna R, McGettigan PA, McWilliam H,
481
Valentin F, Wallace IM, Wilm A, Lopez R, Thompson JD, Gibson TJ, Higgins DG.
482
2007. Clustal W and clustal X version 2.0. Bioinformatics 23:2947-2948.
21 29. Bercovier H, Kafri O, Sela S. 1986. Mycobacteria possess a surprisingly small number
484
of ribosomal-RNA genes in relation to the size of their genome. Biochem. Biophys.
485
Res. Commun. 136:1136-1141.
486
30. Klappenbach JA, Saxman PR, Cole JR, Schmidt TM. 2001. rrndb: the Ribosomal
487
RNA Operon Copy Number Database. Nucleic Acids Res. 29:181-184.
488
31. Iwamoto T, Tani K, Nakamura K, Suzuki Y, Kitagawa M, Eguchi M, Nasu M. 2000.
489
Monitoring impact of in situ biostimulation treatment on groundwater bacterial
490
community by DGGE. FEMS Microbiol. Ecol. 32:129-141.
491
32. Menendez MC, Garcia MJ, Navarro MC, Gonzalez-y-Merchand JA, Rivera-Gutierrez
492
S, Garcia-Sanchez L, Cox RA. 2002. Characterization of an rRNA operon (rrnB) of
493
Mycobacterium fortuitum and other mycobacterial species: Implications for the
494
classification of mycobacteria. J. Bacteriol. 184:1078-1088.
495
33. Zerihun MA, Hjortaas MJ, Falk K, Colquhoun DJ. 2011. Immunohistochemical and
496
Taqman real-time PCR detection of mycobacterial infections in fish. J. Fish Dis.
497
34:235-246.
498
34. Salati F, Meloni M, Fenza A, Angelucci G, Colorni A, Orru G. 2010. A sensitive
499
FRET probe assay for the selective detection of Mycobacterium marinum in fish. J.
500
Fish Dis. 33:47-56.
501
35. Pakarinen J, Nieminen T, Tirkkonen T, Tsitko I, Ali-Vehmas T, Neubauer P,
502
Salkinoja-Salonen MS. 2007. Proliferation of mycobacteria in a piggery environment
503
revealed by mycobacterium-specific real-time quantitative PCR and 16S rRNA
504
sandwich hybridization. Vet. Microbiol. 120:105-112.
505
36. Kaattari IM, Rhodes MW, Kator H, Kaattari SL. 2005. Comparative analysis of
506
mycobacterial infections in wild striped bass Morone saxatilis from Chesapeake Bay.
507
Dis. Aquat. Org. 67:125-132.
22 37. Lescenko P, Matlova L, Dvorska L, Bartos M, Vavra O, Navratil S, Novotny L, Pavlik
509
I. 2003. Mycobacterial infection in aquarium fish. Vet Med-Czech 48:71-78.
510
38. Gauthier DT, Rhodes MW, Vogelbein WK, Kator H, Ottinger CA. 2003.
511
Experimental mycobacteriosis in striped bass Morone saxatilis. Dis. Aquat. Org.
512
54:105-117.
513
39. Yanong RPE, Pouder DB, Falkinham JO. 2010. Association of Mycobacteria in
514
Recirculating Aquaculture Systems and Mycobacterial Disease in Fish. J. Aquat.
515
Anim. Health 22:219-223.
516
40. Cheng JC, Huang CL, Lin CC, Chen CC, Chang YC, Chang SS, Tseng CP. 2006.
517
Rapid detection and identification of clinically important bacteria by high-resolution
518
melting analysis after broad-range ribosomal RNA real-time PCR. Clin. Chem.
519
52:1997-2004.
520
41. Odell ID, Cloud JL, Seipp M, Wittwer CT. 2005. Rapid species identification within
521
the Mycobacterium chelonae-abscessus group by high-resolution melting analysis of
522
hsp65 PCR products. Am. J. Clin. Pathol. 123:96-101.
523
42. Gundry CN, Vandersteen JG, Reed GH, Pryor RJ, Chen J, Wittwer CT. 2003.
524
Amplicon melting analysis with labeled primers: A closed-tube method for
525
differentiating homozygotes and heterozygotes. Clin. Chem. 49:396-406.
526
43. El-Hajj HH, Marras SAE, Tyagi S, Shashkina E, Kamboj M, Kiehn TE, Glickman
527
MS, Kramer FR, Alland D. 2009. Use of Sloppy Molecular Beacon Probes for
528
Identification of Mycobacterial Species. J. Clin. Microbiol. 47:1190-1198.
529
530 531
23 Table 1. List of Mycobacterium and non-Mycobacterium species used in this study
532
Strain Gram Source
Mycobacteria
M. phlei (CIP 105389T) + Pasteur Institute
M. bohemicum (CIP 105811T) + Pasteur Institute
M. gastri (CIP 104530T) + Pasteur Institute
M. pseudoshottsii (CIP109775 T) + Pasteur Institute
M. smegmatis (CIP 104444 T) + Pasteur Institute
M. fortuitum ssp fortuitum + Arnaud de Villeneuve Hospital
M. marinum + Arnaud de Villeneuve Hospital
M. chelonae + Arnaud de Villeneuve Hospital
M. abscessus + Arnaud de Villeneuve Hospital
M. gordonae + Arnaud de Villeneuve Hospital
M. avium + LDV Montpellier
M. haemophilum + LDV Montpellier Non-mycobacteria
Flavobacterium psychrophilum - LDV Montpellier
Pseudomonas fluorescens - LDV Montpellier
Aeromonas sobria - LDV Montpellier
Aeromonas hydrophila - LDV Montpellier
Vibrio vulnificus - LDV Montpellier
Citrobacter braaki - LDV Montpellier
Shewanella putrefaciens - LDV Montpellier
Photobacterium damselae - LDV Montpellier
Chryseobacterium indologenes - LDV Montpellier
Citrobacter freundii - LDV Montpellier
Lactococcus garvieae + LDV Montpellier
Carnobacterium piscicola + LDV Montpellier
Streptococcus parauberis + LDV Montpellier
Carnobacterium maltaromaticum + LDV Montpellier
Enterococcus faecalis + LDV Montpellier
Nocardia sp. + CVI Wageningena
a
Central Veterinary Institute
533 534
24 Table 2. List of the analyzed fish tissue samples
535
Original sample name (fish species) Concentrationa NTM Species identification 080109000133-01 (Anableps anableps) 7,41E+05 M. phlei
070213001086-01 (Dicentrarchus labrax) 6,17E+06 M. marinum
061107005301-01 (Hemigrammus bleheri) 1,61E+07 Mix of M. phlei / M. marinum ? 070821004737-01 (undetermined cichlid) 1,67E+06 M. phlei
070821004737-01 (undetermined cichlid) 1,04E+07 M. phlei
090805003940-01(Sparus aurata) 1,45E+06 M. malmoense
090805003940-01 (Sparus aurata) 3,89E+06 M. phlei
090805003940-01 (Sparus aurata) 2,07E+06 M. phlei
120124000342-01 (Scophthalmus maximus) 5,39E+06 M. marinum
071108006385-02 (Sciaenops ocellatus) 2,49E+07 M. marinum
DNA samples
120417001884-01 (Danio rerio) M. abscessus
120124000342-01 (Scophthalmus maximus) M. marinum
120127000443-01 (Danio rerio) M. marinum
a
Concentration is expressed as genome equivalents g-1 tissue
536 537
25 Table 3. Reproducibility of the melting temperature measurement
538 Strain Tm1 Tm2 Tm3 Mean Tm ± SD M. abscessus 86.12 86.07 86.09 86.10 ± 0.03 M. marinum 86.71 86.68 86.67 86.68 ± 0.02 M. chelonae 87.31 87.23 87.26 87.27 ± 0.04 M. haemophilum 87.20 87.14 87.16 87.16 ± 0.03 M. gordonae 88.21 88.20 88.17 88.19 ± 0.02 M. fortuitum ssp fortuitum 89.13 89.34 89.33 89.27 ± 0.12 M. gastri 89.46 89.39 89.46 89.44 ± 0.04 M. avium 89.05 88.87 88.88 88.94 ± 0.10 M. phlei 90.92 90.92 90.82 90.89 ± 0.06 M. smegmatis 90.12 90.11 90.10 90.11 ± 0.01 M. pseudoshottsii 89.97 89.97 89.97 89.97 ± 0.01 M. bohemicum 89.98 89.96 89.93 89.96± 0.03 Each measurement is the average Tm of 3 replicates
539 540 541
26 Legend to figures
542
543
Figure 1: Specificity of the PCR-HRM assay. Amplification curves of the 16
non-544
mycobacterial species (~106 genome equivalents) are presented together with those of M.
545
marinum and M. fortuitum at a 100-fold lower concentration (~104 genome equivalents) (A)
546
and corresponding gel electrophoresis with the Mycobacterium-specific primers (B) and 16S
547
universal primers (C). Lane 1: molecular weight marker; lanes 2-19: Mycobacterium
548
marinum, Mycobacterium fortuitum, Carnobacterium piscicola, Streptococcus parauberis,
549
Carnobacterium maltaromaticum, Enterococcus faecalis, Citrobacter freundii, Lactococcus
550
garvieae, Nocardia sp., Flavobacterium psychrophilum, Pseudomonas fluorescens,
551
Aeromonas sobria, Aeromonas hydrophila, Vibrio vulnificus, Citrobacter braaki, Shewanella
552
putrefaciens, Photobacterium damselae and Chryseobacterium indologenes.
553
554
Figure 2: Sensitivity of the PCR-HRM assay. Serial dilutions of bacterial DNA were prepared
555
in 100 ng of fish genomic DNA and subsequently used as template for PCR amplification. (A)
556
amplification curves; (B) corresponding gel electrophoresis.
557
558
Figure 3: Standard curves obtained from serial dilutions of bacterial DNA in H2O (A) and in
559
100 ng of fish DNA resuspended in Tris-EDTA (B).
560
561
Figure 4: Strain grouping by HRMA. Difference plots were obtained after a temperature shift
562
on the normalized melting curves, using M. pseudoshottsii as base curve. For clarity, the
563
strain differentiation is displayed into 2 plots showing 5 groups (A) and 4 groups (B). This
564
experiment was repeated 3 times independently and yielded to exactly the same grouping
565
results. When 2 species grouped together, they were differentiated by their Tm. This was the
27 case for group 1 (M. marinum and M. gordonae), group 2 (M. phlei and M. pseudoshottsii)
567
and group 3 (M. fortuitum and M. haemophilum). Refer to table 3 for Tm values.
568
569
Figure 5: Reproducibility of difference plots. (A) Each mycobacterial DNA was replicated 6
570
times and difference plots were drawn for the 6 replicates. For clarity, only 6 species are
571
presented on the graph. (B) Difference plots were drawn from serial dilutions of M. marinum
572
and M. fortuitum (106 to 10 genomes/reaction), using 3 replicates per dilution.
573
574
Figure 6: Identification of unknown samples. Difference plots of 4 reference strains (M.
575
marinum, M. fortuitum, M. chelonae and M. phlei) are displayed alone (A) and together with
576
9 unknown samples identified as M. marinum or M. phlei (B), using M. fortuitum as base
577
curve. (C) Melting curve of an unknown sample showing two inflexions with Tm comparable
578
to those of M. marinum and M. phlei.
A)
B)
C)
Figure 1: Figure 1: Specificity of the PCR-HRM assay. Amplification curves of the 16 non-mycobacterial species
(~10
6genome equivalents) are presented together with those of M. marinum and M. fortuitum at a 100-fold lower
concentration (~10
4genome equivalents) (A) and corresponding gel electrophoresis with the Mycobacterium-specific
primers (B) and 16S universal primers (C). Lane 1: molecular weight marker; lanes 2-19: Mycobacterium marinum,
Mycobacterium fortuitum, Carnobacterium piscicola, Streptococcus parauberis, Carnobacterium maltaromaticum,
Enterococcus faecalis, Citrobacter freundii, Lactococcus garvieae, Nocardia sp., Flavobacterium psychrophilum,
Pseudomonas fluorescens, Aeromonas sobria, Aeromonas hydrophila, Vibrio vulnificus, Citrobacter braaki,
Shewanella putrefaciens, Photobacterium damselae and Chryseobacterium indologenes.
Cycles 40 30 20 10 F lu o re s c e n c e ( 4 8 3 -5 3 3 ) 7.509 6.809 6.109 5.409 4.709 4.009 3.309 2.609 1.909 1.209 0.509 M. marinum M. fortuitum
10
610
510
410
310
210 1 (-)
10
610
510
410
310
210 1 (-)
M. fortuitum
M. marinum
A)
B)
Figure 2: Sensitivity of the PCR-HRM assay. Serial dilutions of bacterial DNA were prepared in 100 ng of fish
genomic DNA and subsequently used as template for PCR amplification. (A) amplification curves; (B) corresponding
gel electrophoresis.
10 15 20 25 30 0 1 2 3 4 5 6 c y c le s o f q u a n ti fi c a ti o n
log (genome equivalents)
M. fortuitum M. marinum 10 15 20 25 30 0 1 2 3 4 5 6 c y c le s q u a n ti fi c a ti o n
log (genome equivalents)
M. fortuitum M. marinum
A)
B)
Figure 3: Standard curves obtained from serial dilutions of bacterial DNA in H
2O (A) and in 100 ng of fish DNA
resuspended in Tris-EDTA (B).
A)
B)
5
1
2
4
3
6
7
9
8
Figure 4: Strain grouping by HRMA. Difference plots were obtained after a temperature shift on the normalized
melting curves, using M. pseudoshottsii as base curve. For clarity, the strain differentiation is displayed into 2 plots
showing 5 groups (A) and 4 groups (B). This experiment was repeated 3 times independently and yielded to exactly the
same grouping results. When 2 species grouped together, they were differentiated by their Tm. This was the case for
group 1 (M. marinum and M. gordonae), group 2 (M. phlei and M. pseudoshottsii) and group 3 (M. fortuitum and M.
A)
B)
Figure 5: Reproducibility of difference plots. (A) Each mycobacterial DNA was replicated 6 times and difference plots
were drawn for the 6 replicates. For clarity, only 6 species are presented on the graph. (B) Difference plots were drawn
from serial dilutions of M. marinum and M. fortuitum (10
6to 10 genomes/reaction), using 3 replicates per dilution.
A)
B)
M. chelonae M. marinum M. phlei M. marinum M. phlei unknownC)
Figure 6: Identification of unknown samples. Difference plots of 4 reference strains (M. marinum, M. fortuitum, M. chelonae and M. phlei) are displayed alone (A) and together with 9 unknown samples identified as M. marinum or M. phlei (B), using M. fortuitum as base curve. (C) Melting curve of an unknown sample showing two inflexions with Tm comparable to those of M. marinum and M. phlei.