Budapest, Escape 24, June 2014
Assessment of Solvent Degradation within a Global
Process Model of Post-Combustion CO
2Capture
Global context
CO
2capture and storage as a possible answer to
• Environmental issues
• Growing energy demand and large contribution of fossil
fuels
2
Outline
1. Introduction: CO
2capture and solvent degradation
2. Experimental study of solvent degradation
3. Simulation of the CO
2capture process with assessment
of solvent degradation
4. Conclusion and perspectives
Budapest, Escape 24, June 2014
Post-combustion CO
2capture
1. Introduction
5
Most studies on CO
2capture with amines: energy penalty
New solvents, Process intensification…
Léonard G. and Heyen G., 2011. Computer Aided Chemical Engineering Vol. 29, 1768-1772.
1. Introduction
6
-4%
-4%
-14%
However, simulation does not consider all important
parameters!
1. Introduction
Focus set on solvent degradation
• Process operating costs:
- Solvent replacement: up to 22% of the CO2 capture OPEX[1]!
- Removal and disposal of toxic degradation products
• Process performance:
- Decrease of the solvent loading capacity - Increase of viscosity, foaming, fouling…
• Capital costs
- Corrosion
• Environmental balance
- Emission of volatile degradation products!
[1] Abu Zahra M., 2009. Carbon dioxide capture from flue gas, PhD Thesis, TU Delft, The Netherlands.
1. Introduction
The goal of this work is to develop a model assessing both
energy consumption and solvent degradation.
Two steps:
•
Experimental study
of solvent degradation
•
Process modeling
with assessment of solvent
degradation
Methodology based on 30 wt% MEA (Monoethanolamine)
Budapest, Escape 24, June 2014
2. Experimental study
of solvent degradation
Degradation is a slow phenomenon (4% in 45 days
[1]).
Accelerated conditions (base case):
• 300 g of 30 wt% MEA
• Loaded with CO2 (~0,40 mol CO2/mol MEA) • 120°C, 4 barg, 600 rpm
• 7 days
• Continuous gas flow: 160 Nml/min, 5% O2 / 15% CO2 / 80% N2
[1] Lepaumier H., 2008. Etude des mécanismes de dégradation des amines utilisées pour le captage du CO
2 dans les
fumées. PhD thesis, Université de Savoie.
2. Experimental study
2. Experimental study
Identification of degradation products:
• HPLC-RID
=> MEA
• GC-FID
=> degradation products
• FTIR
=> Volatile products (NH
3)
112. Experimental study
Comparison of the base case with degraded samples from
industrial pilot plants:
12
?
2. Experimental study
Similar degradation products (GC spectra)!
13 => 20% degradation after 7 days! => Nitrogen mass balance can be closed within 10% => Repetition experiments lead to similar results (<5% deviation)
2. Experimental study
Study of the influence of operating variables:
=> Gas feed flow rate and composition (O2, CO2)=> Temperature => Agitation rate
=> Presence of dissolved metals and degradation inhibitors
2. Experimental study
Leads to a kinetic model of solvent degradation:
=> 2 main degradation mechanisms=> Equations balanced based on the observed proportion of degradation products
Oxidative degradation
MEA + 1,3 O2 ↓
0,6 NH3 + 0,1 HEI + 0,1 HEPO + 0,1 HCOOH + 0,8 CO2 + 1,5 H2O Thermal degradation with CO2
MEA + 0,5 CO2 → 0,5 HEIA + H2O
2. Experimental study
Arrhenius kinetics (kmol/m³.s):
Parameters are identified by minimizing the difference between calculated and observed degradation rates.
• Oxidative degradation: 𝑟 = 535 209. 𝑒−
41 730
8,314.𝑇 . [𝑂
2]1,46
• Thermal degradation with CO2: 𝑟 = 6,27.1011. 𝑒−
143106
8,314.𝑇 . [𝐶𝑂
2]0,9
Budapest, Escape 24, June 2014
3. Simulation of the CO
2
capture
process with assessment of solvent
3. Process simulation
Degradation model has been included into a global process
model built in Aspen Plus
Steady-state simulation, closed solvent loop
Additional equations in the column rate-based models
18 ABS ORBER PUMP-ABS WASHER STRIP PER CONDE NS HX-RL SPLITTER BLOWE R PRE COOLE HX-WAS HX-ABS CLEANGAS CO2 FLUEGA S
3. Process simulation
Base case degradation:
19
=> Degradation mainly takes place in the absorber: => 81 g MEA/ton CO2
Parameter Unit Absorber Stripper Total
MEA degradation kg/ton CO2 8.1e-2 1.4e-5 8.1e-2
NH3 formation kg/ton CO2 1.4e-2 8.4e-7 1.4e-2
HEIA formation kg/ton CO2 1.1e-5 1.1e-5 2.2e-5
MEA emission kg/ton CO2 8.7e-4 9.4e-9 8.7e-4
NH3 emission kg/ton CO2 9.5e-3 3.0e-3 1.3e-2
3. Process simulation
Base case degradation:
20
=> Oxidative degradation is more important than thermal degradation with CO2
Parameter Unit Absorber Stripper Total
MEA degradation kg/ton CO2 8.1e-2 1.4e-5 8.1e-2
NH3 formation kg/ton CO2 1.4e-2 8.4e-7 1.4e-2
HEIA formation kg/ton CO2 1.1e-5 1.1e-5 2.2e-5
MEA emission kg/ton CO2 8.7e-4 9.4e-9 8.7e-4
NH3 emission kg/ton CO2 9.5e-3 3.0e-3 1.3e-2
3. Process simulation
Base case degradation:
21
=> Ammonia is the main emitted degradation product after washing, coming from both absorber and stripper
Parameter Unit Absorber Stripper Total
MEA degradation kg/ton CO2 8.1e-2 1.4e-5 8.1e-2
NH3 formation kg/ton CO2 1.4e-2 8.4e-7 1.4e-2
HEIA formation kg/ton CO2 1.1e-5 1.1e-5 2.2e-5
MEA emission kg/ton CO2 8.7e-4 9.4e-9 8.7e-4
NH3 emission kg/ton CO2 9.5e-3 3.0e-3 1.3e-2
3. Process simulation
Comparison with industrial CO
2capture plants:
81 g MEA/ton CO
2< 284 g MEA/ton CO
2[1]=> Degradation under-estimated (although 324kg MEA/day
at large-scale ~ 4000 tCO
2/day)!
=> Maybe due to simplifying assumptions:
• Modeling assumptions for the degradation kinetics • Presence of SOx et NOx neglected
• Influence of metal ions neglected
22
[1] Moser P., Schmidt S. and Stahl K., 2011. Investigation of trace elements in the inlet and outlet streams of a
3. Process simulation
Influence of process variables on solvent degradation:
=> Regeneration pressureExponential increase of the thermal degradation, but still
much lower than oxidative degradation
233. Process simulation
Influence of process variables on solvent degradation:
MEA concentration
Influence of MEA concentration on the O
2mass transfer!
3. Process simulation
Identification of optimal process operating conditions for
the CO
2capture process:
• Concentrated MEA solvent: 40 wt% MEA (if degradation inhibitors
are available).
• Optimized solvent flow rate: 24 m³/h in the simulated configuration. • Low oxygen concentration in the flue gas: 0% O2 (or minimum)
• High stripper pressure: 4 bar.
• Equipment for absorber intercooling and lean vapor compression.
Budapest, Escape 24, June 2014
4. Conclusion and
perspectives
4. Conclusion
Two of the main CO
2capture drawbacks are considered:
• Solvent degradation is experimentally studied and a kinetic model is proposed
• This model is included into a global process model to study the influence of process variables
=> Both energy and environmental impacts of the CO2 capture are
considered!
=> This kind of model could and should be used for the design of
large-scale CO2 capture plants.
28
4. Conclusion
• Many challenges are still up to come for the CO
2capture
process!
=> ~ 1 Mton CO
2has been emitted during this presentation
• Demonstration plants are the next step to evidence
large-scale feasibility!
Budapest, Escape 24, June 2014
Back-up slides
• Mass transfer enhancement due to the chemical reaction
in the liquid film
30
𝑁𝑂2 = 𝑘𝐿. 𝑎. 𝐶𝑂2𝑖𝑛𝑡𝑒𝑟𝑓𝑎𝑐𝑒 − 𝐶𝑂2𝑏𝑢𝑙𝑘 . 𝐸
𝐸 = 𝐻𝑎 = 𝐷𝐴,𝐿. 𝑘. 𝐶𝐵,𝐿 𝐾𝐿0
Back-up slides
31
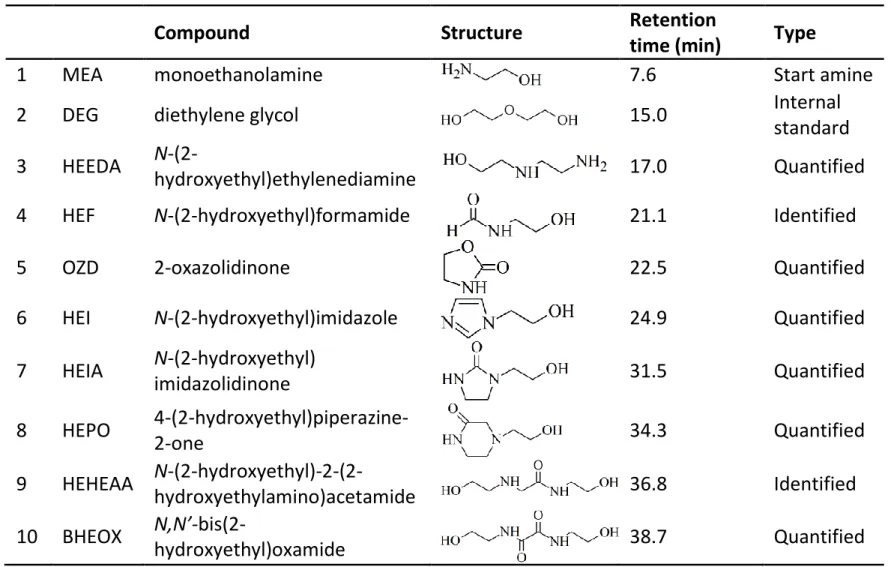
Table 1. Main peaks identified in GC spectra of degraded MEA samples
Compound Structure Retention
time (min) Type
1 MEA monoethanolamine 7.6 Start amine 2 DEG diethylene glycol 15.0 Internal
standard 3 HEEDA
N-(2-hydroxyethyl)ethylenediamine 17.0 Quantified 4 HEF N-(2-hydroxyethyl)formamide 21.1 Identified 5 OZD 2-oxazolidinone 22.5 Quantified 6 HEI N-(2-hydroxyethyl)imidazole 24.9 Quantified 7 HEIA N-(2-hydroxyethyl) imidazolidinone 31.5 Quantified 8 HEPO 4-(2-hydroxyethyl)piperazine-2-one 34.3 Quantified 9 HEHEAA N-(2-hydroxyethyl)-2-(2-hydroxyethylamino)acetamide 36.8 Identified 10 BHEOX N,N’-bis(2-hydroxyethyl)oxamide 38.7 Quantified
3. Process simulation
Influence of process variables on solvent degradation:
=> Solvent flow rate=> Oxygen concentration in the gas feed
Minimum in the solvent flow rate has been experimentally evidenced.