HAL Id: hal-02400483
https://hal.archives-ouvertes.fr/hal-02400483
Submitted on 26 Feb 2021
HAL is a multi-disciplinary open access
archive for the deposit and dissemination of
sci-entific research documents, whether they are
pub-lished or not. The documents may come from
teaching and research institutions in France or
abroad, or from public or private research centers.
L’archive ouverte pluridisciplinaire HAL, est
destinée au dépôt et à la diffusion de documents
scientifiques de niveau recherche, publiés ou non,
émanant des établissements d’enseignement et de
recherche français ou étrangers, des laboratoires
publics ou privés.
Analysing the Impact of Cross-Content Pairs on
Pairwise Comparison Scaling
Emin Zerman, Giuseppe Valenzise, Aljosa Smolic
To cite this version:
Emin Zerman, Giuseppe Valenzise, Aljosa Smolic. Analysing the Impact of Cross-Content Pairs
on Pairwise Comparison Scaling. 2019 Eleventh International Conference on Quality of Multimedia
Experience (QoMEX), Jun 2019, Berlin, Germany. pp.1-6, �10.1109/QoMEX.2019.8743295�.
�hal-02400483�
Analysing the Impact of Cross-Content Pairs on
Pairwise Comparison Scaling
Emin Zerman
V-SENSE, School of Computer Science Trinity College Dublin
Dublin, Ireland emin.zerman@scss.tcd.ie
Giuseppe Valenzise
L2S, UMR 8506 CNRS-CentraleSup´elec-Universit´e Paris-Sud Gif-sur-Yvette, France giuseppe.valenzise@l2s.centralesupelec.frAljosa Smolic
V-SENSE, School of Computer Science Trinity College Dublin
Dublin, Ireland aljosa.smolic@scss.tcd.ie
Abstract—Pairwise comparisons (PWC) methodology is one of the most commonly used methods for subjective quality assessment, especially for computer graphics and multimedia applications. Unlike rating methods, a psychometric scaling operation is required to convert PWC results to numerical subjective quality values. Due to the nature of this scaling operation, the obtained quality scores are relative to the set they are computed in. While it is customary to compare different versions of the same content, in this work we study how cross-content comparisons may benefit psychometric scaling. For this purpose, we use two different video quality databases which have both rating and PWC experiment results. The results show that despite same-content comparisons play a major role in the accuracy of psychometric scaling, the use of a small portion of cross-content comparison pairs is indeed beneficial to obtain more accurate quality estimates.
Index Terms—subjective quality assessment, pairwise compar-isons, psychometric scaling, cross-content pairs
I. INTRODUCTION
Quality assessment is important for several multimedia and computer graphics applications from compression to security. Although objective methods exist, subjective quality assess-ment (SQA) is still the best way to assess the perceived quality for visual stimuli. Nevertheless, SQA requires time and expertise to design, conduct, and analyse. Several rating (single or multiple stimulus) and ranking methods are recommended in standards or guidelines [1]–[3] to gather subjective scores. The exact methodology is decided depending on the task and requirements of the specific application in consideration.
The pairwise comparisons (PWC) method is a popular way of collecting subjective quality scores for SQA. PWC requires a psychometric scaling operation to convert the pref-erence probabilities acquired from the viewers to numerical quality scores [4]. Because of this reason, single or double stimulus rating methods are sometimes preferred over PWC. Nevertheless, PWC has a number of advantages compared to rating methods: (i) there is no (or very little) training needed for the subjects, (ii) the decision procedure is simpler (and therefore faster) for the viewers, and (iii) the stimuli with small differences can be assessed more accurately using PWC [5].
This publication has emanated from research conducted with the finan-cial support of Science Foundation Ireland (SFI) under the Grant Number 15/RP/2776.
In typical multimedia and computer graphics quality eval-uation campaigns, the pairs to be compared include stimuli obtained from the same pristine content, processed by different algorithms (e.g., tone mapping operators), or impaired by different kinds and levels of distortion, such as in image and video compression [6], [7]. In this setup, the obtained quality scores are only valid relative to the other stimuli with the same content, while the alignment between different contents is missing [4], [8]. This fits well the case where the subjective evaluation aims at ranking different algorithms and establishing their degree of preference for a given content. On the other hand, cross-content comparisons probe properties and relations varying across contents, e.g., attributes such as colourfulness [9]. The use of cross-content comparisons to assess the quality of processing or compression algorithms has been little studied in the literature, e.g., to relate rankings from different contents [10], to find the accuracy of quality estimators [11], and to determine how it can benefit the fusion of different quality scales induced by per content PWC experiments [4], [12]. These studies have brought evidence that cross-content pairs in PWC can align quality scores from different contents on the same scale, and increase the accuracy of psychometric scaling.
In this study, we analyse more in-depth the impact of cross-content pairs on the PWC psychometric scaling results. Specif-ically, we try to answer the question “What is the optimal ratio of cross-content comparisons in an experiment, given a fixed budget of comparisons?”. For this purpose, we use two publicly available databases consisting of very different contents (high dynamic range videos versus volumetric point clouds), which have quality scores obtained by both rating and PWC experiments. Despite the differences between the two databases, the effects of cross-content comparisons on the SQA performance are coherent across the two databases. In particular, we find that a minimum number of same-content comparisons (depending solely on the characteristics of the dataset) is required to achieve accurate quality scores. Nevertheless, the addition of a small portion of cross-content pairs can reduce the variance of these estimates. These results confirm and extend previous findings by bringing both larger experimental evidence and an extensive analysis of the relation between the given pair budget (which affects the duration
(a) Separate comparison matrices (b) Only same-content joint comparison matrix (c) Comparison matrix including cross-content Fig. 1. Different comparison matrices for different cases. In this mock example, the black boxes denote where the rows and columns are compared, and white boxes denote where there is no comparison between row and column. Separate comparison matrices (a) are usually used for aggregating the subjective data before psychometric scaling, for the same-content-only pairs. If the same-content pairs are collected in a joint comparison matrix (b), this comparison matrix cannot be scaled due to disconnected components. A joint comparison matrix with cross-content pairs (c) is required for a joint scaling.
and cost of the experiment) and its allocation over same and cross-content pairs, by means of simulations. Our results are intended to guide the development of more efficient PWC testing procedures and active sampling approaches.
Detailed information about the psychometric scaling meth-ods, the considered subjective quality databases, and experi-mental results are discussed in the following sections.
II. PSYCHOMETRICSCALING
The PWC experiment results are obtained as responses to pairwise comparisons, and instead of numerical values, they yield binary preferences. Therefore, the results cannot be averaged (or pooled) to a numerical value. Because of this reason, the results are collected in a comparison matrix, whose elements contain the counts of how many times one condition is voted as better than the other. If the experimenter needs numerical subjective quality scores, one needs to use a psychometric scaling algorithm for this purpose. Psychometric scaling algorithms convert the binary preference results into numerical values. For this purpose, they employ mathematical models of human viewers.
Most commonly, the preference (or comparison) matrices are converted to numerical subjective quality scores using two main models: Bradley-Terry model [13] or Thurstone’s model [14]. The Bradley-Terry-Luce (BTL) model assumes that the quality difference between the two stimuli has a logistic distribution, whereas the Thurstone model assumes that the viewers’ votes and hence the difference between two stimuli qualities have a normal distribution. In either case, the PWC experiments have greater resolution when the two options (or two stimuli) have similar values, and they do not work well when the difference between the two stimuli is too apparent (i.e., probability of A being better than B is very close to one: P (A > B) ≈ 1. Thus, PWC is better at small differences rather than large differences. Afterwards, the probability (or preference) values are converted to numerical values considering these basic assumptions, using the distri-bution models. Hence, the scaled quality scores are always relative to the set which they are computed in.
For this reason, combining the scaled quality scores of different contents is not straightforward, especially if there is no information tying different contents together. Commonly, the comparison matrices are generated for each different
content for same-content-only cases, as shown in Fig. 1.(a). Due to the relative nature of scaling, the scaled quality scores will only be meaningful within each content group. Attempting to merge the scales together, one can generate a bigger comparison matrix, as shown in Fig. 1.(b). However, in this case, the scaling algorithm will not work correctly due to the disconnected components. To address this problem, in [4] the addition of cross-content pairs was proposed to anchor different contents together, which generates a comparison matrix similar to the one shown in Fig. 1.(c). It is found that adding cross-content pairs increases the scaling accuracy and decreases the error accumulation. However, this leads us to another question: “Cross-content comparisons are beneficial, but what is the right proportion?”. In this study, we try to answer this question. Throughout this study, we use a Thurstone Case V scaling algorithm to scale PWC data.
III. SUBJECTIVEQUALITYDATABASES
In this study, two different subjective quality databases were used. These databases were created to subjectively evaluate compression methods and effects of different parameters on the compression for immersive multimedia. Both databases include MOS values (rating results) and pairwise compari-son experiment results (ranking results). Additionally, both databases include cross-content comparisons, which enables us to carry out this analysis. The details are given below: A. High Dynamic Range Video Quality Database (HDRVDB)
The high dynamic range (HDR) video quality database [4] (named as HDRVDB throughout the paper) includes subjective scores for a total of 60 distorted stimuli from 5 original contents. Originally created to analyse the effect of different colourspaces on HDR compression, this database contains subjective quality scores collected using 4 different subjective experiment sessions and includes:
1) Double stimulus impairment scale (DSIS) session 2) PWC with only same-content pairs
3) Additional PWC with cross-content pairs 4) Additional PWC with same-content pairs
In total, the stimuli were compared 6390 times (5190 same-content and 1200 cross-same-content). Mean opinion scores (MOS) were obtained from DSIS results, and scaled quality scores (named as just objectionable difference (JOD) scores [4]) were
...
Content #1 Reference Reference Content #2...
Content #1Quality-1 Content #1Quality-2 Content #1Quality-N
Quality-N Content #2 Quality-2 Content #2 Quality-1 Content #2
...
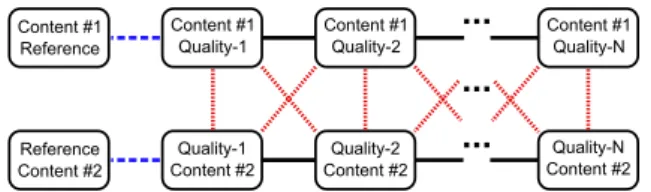
Fig. 2. Three different categories selected for the simulations. The pair comparison categories Porig, Psame, and Pcrosare indicated with a blue
dashed line, black solid line, and red dotted line, respectively.
obtained from PWC results for 3 different cases of PWC. The relationship between MOS and JOD was found to be linear with very high correlation coefficients. To be exact, the Pearson correlation coefficient (PCC) was found to be ρ = 0.925 for the case with only same-content pairs and ρ = 0.979 for the case including both same-content and cross-content pairs. Please refer to the original paper [4] for details. Keeping the MOS values as they are, we use the PWC results for our simulation in order to analyse the impact of cross-content pairs on PWC scaling. The details of this simulation are described in the following section.
B. Volumetric Video Quality Database (VVDB)
The volumetric video quality database [15] (named as VVDBthroughout the paper) includes subjective quality scores for a total of 32 distorted stimuli from 2 original contents. The database was created to evaluate and analyse the point-cloud compression on perceived quality. For this purpose, a DSIS and a PWC experiment were conducted using the same database. Although there is only one PWC experiment in this database (compared to 3 different PWC experiments of HDRVDB), cross-content pairs are already present within the experiment design of this single PWC experiment. In total, the stimuli were compared 1944 times (1584 same-content and 360 cross-content). Similar to the HDRVDB [4] work, the MOS values were found using DSIS and JOD values were found using PWC experiment results. The Pearson correlation between MOS and JOD was found to be ρ = 0.977 for this work. Please refer to the original paper [15] for details.
The PWC results of this work are also used in our simulation as described in the next section, whereas the MOS values are directly taken.
IV. EXPERIMENTALRESULTS
In this section, we describe the sampling-based simulations we used to analyse the impact of cross-content comparisons and present results of this analysis.
A. Sampling-based simulations
In order to understand the effect of cross-content pairs on the overall performance of the psychometric scaling, we use the subjective quality scores acquired through several subjec-tive test campaigns for two quality databases, as explained in the previous section. We conduct a simulation in which we randomly sample a subset of same-content and cross-content pairs from the whole set of measured pairs (i.e., from the real experiment data), and we use this sub-sampled data to perform
Algorithm 1: Simulation procedure
input : Number of repetition NR and step size
Ndiv for random selection
output: JOD and PCC results
1 Categorise the pairs: Porig,Psame,Pcros 2 Initialise comparison matrix MComp← 0 3 foreach pair p in Porig do
4 MComp← update(MComp, p) 5 end
6 MBase←− MComp
7 for isame ← 1 to Nsame/Ndiv do 8 for icros← 1 to Ncros/Ndiv do 9 for irep← 1 to NR do 10 MComp←− MBase
11 Psamesel ← rand(Psame,Ndiv× isame) 12 foreach pair psel inPsamesel do
13 MComp← update(MComp,psel)
14 end
15 Pcrossel ← rand(Pcros,Ndiv× icros) 16 foreach pair psel inPcrossel do
17 MComp← update(MComp,psel)
18 end
19 JOD ← pwscale(MComp) 20 PCC ← corr(JOD, MOS)
21 end
22 end 23 end
psychometric scaling. The sampling and simulation processes are described below, and also in Algorithm 1.
For each database, we first categorise all the pairs into three categories (as marked with different colours in Fig. 2):
• Porig : Comparisons with the reference
• Psame: Same-content comparisons, excluding Porig • Pcros : Cross-content comparisons
The number of comparisons in these sets is denoted as Norig,
Nsame, and Ncros, respectively. As JOD scale needed an
original point (where J OD = 0), we needed to separate the Porig and use it to anchor the numerical scale to 0 JOD at
the ‘Reference’ node. To ensure that the pairs in comparison matrix are well connected to the ‘Reference’ node, the pairs in Porig are all selected and the comparison matrix, MComp,
is created using this set. This comparison matrix is saved as MBase for later stages of the simulation, as shown in line 6
in Algorithm 1. Afterwards, a random set of same-content and cross-content pairs were selected, and the updated comparison matrix was used for the psychometric scaling. In this step, the possible set of same-content and cross-content pairs were swept using a step size parameter; Ndiv. Because of practical
reasons and time limitations, this parameter is selected as Ndiv = 30 for HDRVDB and Ndiv = 20 for VVDB. As
(a) Mean PCC for HDRVDB (b) Raw CI of PCC for HDRVDB (c) Median filtered CI for HDRVDB (d) HDRVDB CI contour plot
(e) Mean PCC for VVDB (f) Raw CI of PCC for VVDB (g) Median filtered CI for VVDB (h) VVDB CI contour plot Fig. 3. Surface plots indicating the mean PCC and the confidence intervals of PCC for two different databases considered. The contour plots (d) and (h) show the levels which have the same CI on the surfaces (c) and (g), respectively. Red dotted lines indicate the linear estimation for the same CI levels.
algorithm1to scale PWC data into just objectionable difference
(JOD) scores2 [4], as shown in line 19 in Algorithm 1.
Evaluating the accuracy of predicted quality scores is diffi-cult, as quality scores are elicited by human surveys and are intrinsically subjective. However, in our setup, we consider this problem from a sampling perspective, and we thus aim at quantifying how accurately a subsample of the data can predict the scores obtained with the full dataset. Following a similar protocol as in [4], we employ as performance metric the Pearson correlation coefficient (PCC) between the scaled scores from given samples and the MOS obtained by rating over the dataset. Indeed, those MOS were found to be highly correlated (ρ > 0.92) with the JOD obtained with the whole set of PWC data, for both the databases used in this work.
For each combination of same and cross-content compar-isons, We repeat the sampling, scaling and computation of PCC as described above for NR times. This random selection
operation corresponds to performing bootstrapping on the distribution of PCC for a specific configuration of same/cross-content comparisons. Hence, we estimate the mean PCCs as the sample average over these random repetitions, and their confidence intervals (CI) as the interval centred around the mean PCC containing 95% of the samples.
B. Results
After the simulation, the mean PCC’s and their CI’s are found as explained in the previous section. The raw CI data we get from this difference is noisy as the number of repetitions we could process was NR = 40 due to the computational
complexity of the scaling algorithm. We thus use a median 1M. Perez-Ortiz and R. K. Mantiuk, A practical guide and software for
analysing pairwise comparison experiments, arXiv:1712.03686, 2017.
2https://github.com/mantiuk/pwcmp
filter to smooth out the CI magnitude and remove noise. The raw CI magnitudes and median-filtering results can be seen in Fig. 3, as well as the mean PCC values and contour levels of CIs for both databases. The median-filtered surfaces provide smoother results, and we assume that these surfaces better represent the underlying relationship between same-content cross-content pairs.
The results indicate that same-content pairs are more impor-tant for PWC scaling to reduce the PCC variance, compared to the cross-content pairs. Nevertheless, the cross-content pairs also decrease the PCC variance for a given amount of same-content pairs. This relationship can be seen clearly from the surface plots and contour plots in Fig. 3.
Using the variation in the PCC, we can also analyse this relationship better and find a ratio of same-content and cross-content pairs needed for the best results. For this purpose, the contour levels are analysed and a consistent linear relationship was found for several contour levels, indicating the same level of CI for PCC. The red dotted lines shown in Fig. 3.(d) and Fig. 3.(h) indicate the set of same-content and cross-content pairs that yield the same confidence intervals. The estimated parameters for these red dotted lines are given in Table I. These results can be interpreted as follows: to get the same level of PCC variation, 100 pairs of increase in cross-content pairs should be balanced with ∼ 12.6 pairs of decrease in
TABLE I
THE RELATIONSHIP BETWEEN SAME-CONTENT(SC)AND CROSS-CONTENT(CC)PAIRS FOR A SAME LEVEL OFPCCVARIATION.
CI level HDRVDB VVDB 0.10 SC = -0.12 * CC + 596.9 SC = -0.40 * CC + 356.1 0.15 SC = -0.12 * CC + 523.8 SC = -0.26 * CC + 263.7 0.20 SC = -0.13 * CC + 450.5 SC = -0.23 * CC + 221.3 0.25 SC = -0.14 * CC + 410.1 SC = -0.11 * CC + 156.0 0.30 SC = -0.12 * CC + 340.2 –
(a) Total budget of 300 pairs (b) Total budget of 600 pairs (c) Total budget of 750 pairs
(d) Total budget of 900 pairs (e) Total budget of 1050 pairs (f) Total budget of 1200 pairs
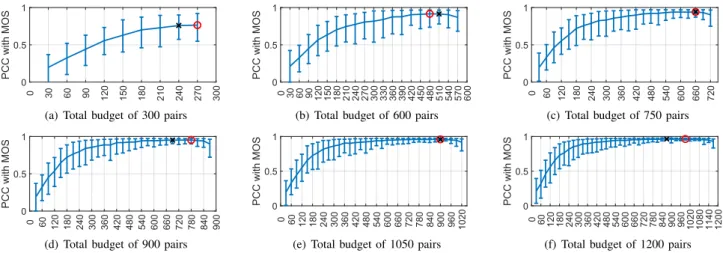
Fig. 4. The fixed-budget simulation results for HDRVDB. The x-axis indicates the number of same-content pairs for a total fixed-budget of N pairs, as N is indicated in the subcaptions. The whiskers indicate confidence interval for each case. The red circle indicates the case with the maximum correlation with MOS, and the black cross indicates the case with the minimum variation of PCC values.
(a) Total budget of 120 pairs (b) Total budget of 180 pairs (c) Total budget of 240 pairs
(d) Total budget of 360 pairs (e) Total budget of 460 pairs (f) Total budget of 540 pairs
Fig. 5. The fixed-budget simulation results for VVDB. The x-axis indicates the number of same-content pairs for a total fixed-budget of N pairs, as N is indicated in the subcaptions. The whiskers indicate confidence interval for each case. The red circle indicates the case with the maximum correlation with MOS, and the black cross indicates the case with the minimum variation of PCC values.
(a) Fixed-budget pairs for HDRVDB
(b) Fixed-budget pairs for VVDB
Fig. 6. The contours for the fixed-budget simulations for both databases. Red dashed lines indicate the locations of slices for the fixed-budget of pairs compared.
same-content pairs for HDRVDB. From Fig. 3(d) and (h), we can clearly see that these slopes are different for the two databases. There may be a couple of reasons for this. One reason may be the number of contents we have, as for VVDB we have 2 and for HDRVDB we have 5 different contents. We can hypothesise that the increasing number of contents can be beneficial for cross-content comparisons. However, we
cannot prove or disprove this hypothesis within the scope of this study, as another controlled experiment is required for this purpose. Another reason can be the difference of the media for the databases we use, i.e., HDR video vs. volumetric video, which may be evaluated differently by human observers.
The main question we are trying to answer in this pa-per is “What is the optimal ratio of cross-content parisons in an experiment, given a fixed budget of com-parisons?”. In order to answer this question, we con-ducted additional sampling simulations constraining the number of total pairs. The selected fixed-pair budgets are BudgetHDRVDB = {300, 600, 750, 900, 1050, 1200} and BudgetVVDB = {120, 180, 240, 360, 460, 540} for both databases. The selected budgets are shown on the contour plots in Fig. 6. The same simulation procedure was repeated for these specific cases of fixed-budget comparisons. Constraining the number of possible pairs, we reduced the total number of cases to compute JOD and PCC dramatically. Therefore, we were able to increase the number of repetitions to NR= 200,
which in turn further reduced the noisy effects of random pair selection.
The results of this second analysis are plotted and shown in Fig. 4 for HDRVDB and Fig. 5 for VVDB. These plots show the mean and CI of PCC values computed between the MOS and simulated JOD values. The red circles indicate the maximum PCC for each case and the black crosses indicate the pair condition where the PCC variation (i.e., CI of PCC) is minimum.
Considering the points where the PCC is maximum, we can also find the optimal ratio of cross-content pairs to the same-content pairs. This ratio is mean([120600, 90
750, 120 900, 150 1050, 210 1200]) =
15.4% for HDRVDB and mean([40 200, 80 360, 100 460, 120 540]) = 21.5%
for VVDB. These findings are also similar to those found in Table I. Considering both the ratios found here and in Table I, we can say that having cross-content comparisons ∼ 20% of the total pairs increases the accuracy of the scaling and reduces the variance.
Fig. 4 and Fig. 5 show how well and reliably we can predict the quality scores (obtained by a much larger number of comparisons) using a limited budget of pairs. Both figures show that the prediction accuracy as a function of same-content comparisons for a fixed-budget saturates after a certain number of comparisons. Interestingly, the knee of the curve does not seem to depend on the pair budget, but it is rather an absolute number of same-content comparisons which is characteristic of the database (around 250 for HDRVDB and 150 for VVDB). A possible interpretation in terms of the comparison graph is that a minimum number of same-content comparisons is required to give a certain “structure” to the graph; however, past the knee point, it seems that the allocation of same to cross-content pairs does not significantly influence the PCC. Yet, we can still observe that the CI of PCC is minimised when a small portion of cross-content comparisons is considered (black cross in the figures), which implies that cross-content comparisons enable to reduce the variance of the scaled quality scores. Finally, it is interesting to observe that the knee point in the two databases corresponds to a number of same-content comparisons per stimuli between 4 and 5. However, at this stage, we cannot speculate further on any precise model linking the dataset size to the number of required same-content comparisons, as the latter probably depends as well on the experimental protocol used, the choice of the stimuli, etc.
V. CONCLUSION
In this study, we analysed the impact of cross-content pairs on pairwise comparison scaling using two publicly available databases which have both MOS values and PWC experiment results. Using the subjective data provided by these databases, we conducted a series of simulations for this analysis. Our findings are coherent across the two datasets, despite their diversity, and show that:
• Same-content pairs are generally more important than cross-content pairs, and we need a minimum number of same-content pairs before starting to add cross-content pairs.
• There is a quantifiable relationship between the
same-content and cross-same-content pairs, which also supports the previous findings.
• The optimal ratio of cross-content-pairs/total-pairs should be around 20% in order to achieve maximum accuracy and minimum error with pairwise scaling.
Notice that in this work we focus on random subsampling of pairs, and thus all our conclusions must be interpreted in terms of the expected PCC with the (approximate) ground-truth quality scores. In other words, we do not take into account the impact of pair selection. The pair selection can have a great effect on the PWC scaling, and it can be done through, e.g., active sampling [16], [17]. However, this is out of the scope of this paper. Instead, our conclusions might guide the design of better pair sampling techniques and provide a lower bound to assess the performance of a sampling algorithm compared to the random sampling baseline. Further formulation and analysis of the relationship between pair-selection (or sampling) and psychometric scaling are left for future work.
REFERENCES
[1] ITU-T, “Subjective video quality assessment methods for multimedia applications,” ITU-T Recommendation P.910, Apr 2008.
[2] ITU-R, “Methodology for the subjective assessment of the quality of television pictures,” ITU-R Recommendation BT.500-13, Jan 2012. [3] EBU, “SAMVIQ - subjective assessment methodology for video
qual-ity,” European Broadcasting Union, Tech. Rep., 2003, BPN 056. [4] E. Zerman, V. Hulusic, G. Valenzise, R. K. Mantiuk, and F. Dufaux, “The
relation between MOS and pairwise comparisons and the importance of cross-content comparisons,” in IS&T EI, HVEI XXII, Jan 2018. [5] E. Zerman, V. Hulusic, G. Valenzise, R. Mantiuk, and F. Dufaux, “Effect
of color space on high dynamic range video compression performance,” in QoMEX. IEEE, June 2017.
[6] R. K. Mantiuk, A. Tomaszewska, and R. Mantiuk, “Comparison of four subjective methods for image quality assessment,” Computer Graphics Forum, vol. 31, no. 8, pp. 2478–2491, 2012.
[7] N. Ponomarenko, L. Jin, O. Ieremeiev, V. Lukin et al., “Image database TID2013: Peculiarities, results and perspectives,” Signal Processing: Image Communication, vol. 30, pp. 57–77, 2015.
[8] D. M. Rouse, R. P´epion, P. Le Callet, and S. S. Hemami, “Tradeoffs in subjective testing methods for image and video quality assessment,” in IS&T/SPIE EI, HVEI XV. SPIE, 2010.
[9] C. Amati, N. J. Mitra, and T. Weyrich, “A study of image colourfulness,” in Proc. of the Works. on Comp. Aest. ACM, 2014, pp. 23–31. [10] D. M. Chandler, K. H. Lim, and S. S. Hemami, “Effects of spatial
correlations and global precedence on the visual fidelity of distorted images,” in HVEI XI. SPIE, 2006.
[11] A. R. Reibman, “A strategy to jointly test image quality estimators subjectively,” in IEEE ICIP. IEEE, 2012, pp. 1501–1504.
[12] A. Mikhailiuk, M. P´erez-Ortiz, and R. Mantiuk, “Psychometric scaling of TID2013 dataset,” in QoMEX. IEEE, 2018, pp. 1–6.
[13] R. A. Bradley and M. E. Terry, “Rank analysis of incomplete block designs: I. the method of paired comparisons.” Biometrika, vol. 39, no. 3/4, pp. 324–345, 1952.
[14] L. L. Thurstone, “A law of comparative judgement,” Psychological Review, vol. 34, no. 4, pp. 273–286, 1927.
[15] E. Zerman, P. Gao, C. Ozcinar, and A. Smolic, “Subjective and objective quality assessment for volumetric video compression,” in IS&T EI, IQSP XVI, 2019.
[16] P. Ye and D. Doermann, “Active sampling for subjective image quality assessment,” in Proc. of the IEEE CVPR, 2014, pp. 4249–4256. [17] J. Li, R. Mantiuk, J. Wang, S. Ling, and P. Le Callet, “Hybrid-MST: A
hybrid active sampling strategy for pairwise preference aggregation,” in Adv. in Neur. Inf. Proc. Syst., 2018, pp. 3479–3489.