Characterizing Function Iining
with Genetic Programming
by
Chris Yu
Submitted to the Department of Electrical Engineering and Computer Science
in Partial Fulfillment of the Requirements for the Degrees of
Bachelor of Science in Electrical [Computer] Science and Engineering
and Master of Engineering in Electrical Engineering and Computer Science
at the Massachusetts Institute of Technology
August 17, 2004
Copyright 2004 Massachusetts Institute of Technology. All rights reserved.
MASSACHUSETTS INS TTE OF TECHNOLOGY
BARKER
JUL
LIBRARIES
Author
Department of E1lt(r jca1 Fipgineering and Computer Science August 17, 2004 Certified by
Saman P. Amarasinghe T sis Supervisor
Characterizing Function Inlining with Genetic Programming
by
Chris Yu
Submitted to the
Department of Electrical Engineering and Computer Science
August 17, 2004
In Partial Fulfillment of the Requirements for the Degree of
Bachelor of Science in Computer [Electrical] Science and Engineering
and Master of Engineering in Electrical Engineering and Computer Science
ABSTRACT
Function inlining is a compiler optimization where the function call is replaced by the
code from the function itself. Using a form of machine learning called genetic
programming, this thesis examines which factors are important in determining which
function calls to inline to maximize performance. A number of different heuristics are
generated for inlining decisions in the Trimaran compiler, which improve on performance
from the current default inlining heuristic. Also, trends in function inlining are examined
over the thousands of compilation runs that are completed.
Thesis Supervisor: Saman P. Amarasinghe
Acknowledgments
I would like to thank my supervisor, Saman P. Amarasinghe, for taking me into his
team and entrusting me with this task. His dedication and affability are contagious, as it is evident to see they are transmitted to all the other members of the research group.
A special thanks to Rodric Rabbah for offering his guidance, his knowledge, and
his patience to me the whole way. Without his constant motivation to do more, this thesis would have been a shell of its current self.
Another special thanks to Mark Stephenson for the countless hours he spent help-ing answer all of my countless questions. This thesis would not have been possible without the groundwork he provided.
Finally, countless others throughout the lab have helped me at one point or an-other. Though too numerous to name, I would like to thank all the members of the Computer Science and Artificial Intelligence Laboratory.
Contents
1 Introduction 1.1 M otivations . . . . 1.2 C ontents . . . . 2 Finch framework 2.1 Genetic Programming . . . . 2.2 Priority Functions . . . . 2.3 Finch Operation . . . . 3 Function Inlining 3.1 Compiler Infrastructure . . . . 4 Implementation4.1 Sorted List Issues 4.2 Platform. . . . .. .
4.3 Features Considered 4.4 Workflow . . . .. .
4.5 Fanalyzer . . . .
5 Experimental Results
5.1 Trimaran Default versus Finch Baseline . . . .
5.2 Individual Benchmark Evolution . . . .
9 10 11 12 12 14 15 19 21 23 24 25 26 27 29 30 30 31 . . . . . . . . . . . . . . . .. . . . . . . .
5.3 Post-Experimental Log Analysis . . . . 32
5.3.1 Fitness Histograms . . . . 32
5.3.2 Inlined Arcs versus Fitness Scatter Plots . . . . 33
5.3.3 Compilation Time versus Fitness Scatter Plots . . . . 35
5.4 Performance Results . . . . 36 5.4.1 164.gzip . . . . 37 5.4.2 181.m cf . . . . 38 5.4.3 197.parser . . . . 39 5.4.4 300.tw olf . . . . 40 5.5 All Benchmarks . . . . 41
5.5.1 Retrospective Function Filtering . . . . 42
5.6 Fanalyzer Analysis . . . . 43
5.7 Feature Examination . . . . 45
6 Related Work 47 7 Conclusion 49 7.1 Future Work . . . . 50
A Best Priority Functions 52
B Tables 64
List of Figures
2-1 Genetic Programming Flowchart . . . . 2-2 Example Finch Expressions . . . .
3-1 Example of Function Inlining. . . . .
4-1 Excerpt of the Original Trimaran Baseline Function. . . 4-2 Example of C-code from genmprobedilcode. .
5-1 Median Speedups . . . .
A-1 164.gzip best Priority Function A-2 181.gzip best Priority Function A-3 197.parser best Priority Function
A-4 300.twolf best Priority Function
A-5 bestall Priority Function . . . . . A-6 bestall2 Priority Function . .
A-7 Fanalyzer best164 Output . .
A-8 Fanalyzer best181 Output . .
A-9 Fanalyzer best197 Output . .
A-10 Fanalyzer best300 Output . .
A-11 Fanalyzer bestall Output... A-12 Fanalyzer bestall2 Output . .
13 14 20 24 28 . . . . 3 6 . . . . 5 3 . . . . 5 3 . . . . 5 4 . . . . 5 5 . . . . 5 6 . . . . 5 7 . . . . 5 8 . . . . 5 9 . . . . 6 0 . . . . 6 1 . . . . 6 2 . . . . 6 3
C-1 164.gzip Histogram of Fitnesses . . . . C-2 181.mcf Histogram of Fitnesses . . . . C-3 197.parser Histogram of Fitnesses . . . .
C-4 300.twolf Histogram of Fitnesses . . . .
C-5 164.gzip Scatter Plot of Inlined Arcs versus Fitness . . . C-6 181.mcf Scatter Plot of Inlined Arcs versus Fitness . . . C-7 197.parser Scatter Plot of Inlined Arcs versus Fitness . . C-8 300.twolf Scatter Plot of Inlined Arcs versus Fitness . . . C-9 164.gzip Scatter Plot of Compilation Time versus Fitness C-10 181.mcf Scatter Plot of Compilation Time versus Fitness
C-11 197.parser Scatter Plot of Compilation Time versus Fitness . . . . C-12 197.parser Zoomed View of Scatter Plot of Compilation Time versus
F itness . . . .. . . . . . . . .
C-13 300.twolf Scatter Plot of Compilation Time versus Fitness . . . .
. . . . 67 . . . . 67 . . . . 68 . . . . 68 . . . . 69 . . . . 69 . . . . 70 . . . . 70 . . . . 71 . . . . 71 72 72 73
List of Tables
2.1 Genetic Programming Primitives . . . . 16
2.2 Genetic Programming Parameters . . . . 17
3.1 Trimaran Pinline Parameters . . . . 22
5.1 Trimaran Default versus Finch Baseline Results . . . . 31
5.2 Benchmark Function Arcs Statistics . . . . 32
5.3 Baseline Function Percentile . . . . 33
B.1 164.gzip Benchmark Statistics . . . . 64
B.2 181.mcf Benchmark Statistics . . . . 65
B.3 197.parser Benchmark Statistics . . . . 65
Chapter 1
Introduction
Function inlining is a compiler optimization technique where the code from the callee (the function being called) is inserted into the caller function thereby replacing the function call. This allows the program to avoid two jumps - one into the callee function, and one out of it - and hence avoid the overhead involved in making function calls. Furthermore, inlining functions can also create larger basic blocks - units of execution without branches or jumps - enabling other optimizations in modern compilers such as register allocation and instruction scheduling.
However, there are also negative performance factors involved with function in-lining. If a function has too many other functions inlined in it, its size could expand so that it clobbers the instruction cache too often, taking a performance hit larger than the benefit gained from inlining. Most compilers have quotas on the amount of codesize expansion the inlining module can produce. Therefore the opportunity cost of inlining a function that produces only a small gain, versus inlining a function that produces a much better gain must be considered as well. Choosing the right mix of functions to inline is an intractable problem, in general.
Deciding which function callsites to inline is normally done by a heuristic created
the benefits of inlining are maximally achieved.
This thesis will (1) examine the important characteristics that a heuristic for inlining should consider and (2) automatically derive an inline heuristic for optimizing compilers. In pursuit of these goals, we will be using a form of machine learning called genetic programming on an open-source C compiler.
1.1
Motivations
Optimal solutions for many problems, such as deciding which functions to inline, require the compiler to solve intractable problems. Since compiler running times must be reasonably bounded, compiler writers are forced to create heuristic algorithms which approximate the ideal solution. One technique used in developing heuristic algorithms is priority (or cost) functions, which combine the various factors of a problem into a single number. For instance, in the Trimaran [14] implementation of function inlining, the higher the priority of a function call, the more likely it is that function will be inlined.
The efficiency of an algorithm is determined by the efficiency of the priority func-tion. And priority functions are ubiquitous in compiler optimizations, making them an ideal candidate for meta optimization: the optimization of the compiler's optimizer. However, a significant amount of time goes into the development of these pri-ority functions: a number of candidate functions are created by the programmer and tested. This tweaking continues until the developer decides a suitable solution has been achieved. The compiler engineer becomes entangled in the time-consuming process of guess-and-test.
As computer architectures evolve and increase in complexity, compilers designed to utilize those architectures also increase in complexity. The process of hand-tuning priority functions in these compilers quickly becomes infeasible as the number and
complexity of the interrelated optimizations increases. However, machine learning techniques can be used to substitute computing resources for human effort.
Genetic programming is one approach to using machine learning for finding suit-able priority functions. Its operation is based loosely on Darwinian evolution: each generation the worst results are killed off, and the population is replenished by crossovers and mutations among the remaining results.
The results obtained from the experiments will be examined across a variety of different criteria. One goal is to develop further insight into function inlining perfor-mance, and its function space for priority functions.
1.2
Contents
The rest of the thesis is organized in the following manner. Chapter 2 describes the benefits of genetic programming, and the Finch framework used for machine learning. Chapter 3 describes function inlining, and how it is implemented in the Trimaran compiler. Chapter 4 describes the implementation of the compiler system used to evolve the inlining priority function. Chapter 5 describes the benchmark testing methodology, and examines the results gathered. Chapter 6 describes related work. And Chapter 7 concludes the thesis, and discusses future work.
Chapter 2
Finch framework
This chapter gives some background on genetic programming and describes the frame-work used for applying machine learning techniques in the context of meta optimiza-tion.
2.1
Genetic Programming
Genetic programming can be used in an unsupervised manner to search large expres-sion spaces. Its operation is loosely based on Darwinian evolution: random function expression trees are created and tested, with crossover combinations occurring be-tween the fittest expressions forming new expressions to test.
Figure 2-1 shows the genetic programming flow. Genetic programming first ran-domly creates an initial population of expressions. Each expression is executed and assigned a fitness. In our case, the fitness is going to be a measure of runtime (either in seconds or in cycles) so smaller is better. A subset of the expressions are 'killed'
off, and replaced with either new random expressions, crossover expressions, or
mu-tated expressions. Then the cycle repeats until the desired number of generations has elapsed, and a winner is chosen.
Compile and run each e xpression
gens < L IMIT?
No Yes
Probabilistically select expressions
Crossover and mutation gens = gens + I
Figure 2-1: Genetic programming flowchart.
al. for compiler meta-optimization. Its design allows it to be easily integrated with a number of existing compilers, including Trimaran. Finch has an array of features very well suited for the purposes of this research, including the creation, testing, and ranking of expressions for optimization.
Genetic programming was chosen as the machine learning technique used in Finch for a multitude of reasons. Compiler optimization often involves a large number of factors, leading to large high-dimensional search spaces. Genetic programming is capable of searching these spaces, whereas many other machine learning algorithms are not as capable of scaling. Genetic programming is especially applicable when the relations between the large number of factors is relatively unknown [9].
Another important property of genetic programming is that the resulting func-tions generated are human-readable expression trees, which are output by the pro-gram using a Lisp-like syntax. Figure 2-2 illustrates some priority functions, and the crossover and mutation operations which create new priority functions. Post-experimental analysis of genetic programming can provide more insight into why the best priority functions perform well.
(a) (b) (C) (d)
frequency 2.3 N~dysize 4.1 frequency 2.3
Figure 2-2: Example Finch expressions. Expressions (a) and (b) are examples of ex-pressions produced by Finch. Expression (c) shows an example of a random crossover created from (a) and (b). Expression (d) is the resulting priority function from a mutation of (a).
Genetic programming is also well-suited to parallelization - an important factor in performing large experiments in a reasonable amount of time. At the beginning of every generation, the harness (the central controlling logic) creates all the expressions for the upcoming generation. A combination of lingering expressions from the last generation, new random expressions, crossover combinations, and mutations are cho-sen. All the expressions are then tested and assigned fitnesses. On a single system, the testing would be run serially and possibly take a very long time to complete. However, since each test has no dependencies on the other tests, the tests can be parallelized by running them on separate machines. With normal configuration pa-rameters, the amount of time required for the centralized work is proportionally tiny, so large savings in runtime are obtained through parallelization. Given that a large cluster of machines was readily available to run experiments, choosing an algorithm which could leverage the resources available was essential.
2.2
Priority Functions
Priority functions are the expressions inside a compiler that Finch targets when op-timizing. Also called cost functions, they are heuristic functions used to distill a
multitude of factors into a numerical result, or a cost. They allow for approximate numerical analysis in areas that are difficult to quantify exactly.
Priority functions are used in compilers to quantitatively compare different com-pilation paths to favor certain directions. For example, deciding which register to spill in a register allocation module, deciding which instruction to schedule next, and the one pertinent to this thesis, deciding which of the candidate functions to inline within the quota restrictions.
2.3
Finch Operation
Finch [11] consists of two related components: a testing harness which drives the ge-netic programming process by generating the priority functions, launching the com-piler trials, and gathering fitness results; and a library which links into the target compiler to enable expression-tree priority function evaluation.
The harness is the component in charge of driving the entire genetic programming process, from generating expressions, to testing expressions, and to collecting and ranking expressions.
At the beginning of every generation, the harness decides what the population for the generation is going to be. The first generation of each run is populated with random expressions and an option to seed the population with initial baseline expressions. Every subsequent generation is created by 'killing' off a percentage of the population, and replacing the voids created with any of the following: randomly created expressions, expressions created by crossovers, or mutated expressions. The
population size stays fixed between generations.
Table 2.1 shows the primitives and syntax that Finch uses to build expressions. The top segment represents the real-valued functions, which all return a real value. Likewise, the functions in the bottom segment all return a Boolean value.
[Real-Valued Function Representation
Real1 + Real2 (add Real1 Real2)
Real1 - Real2 (sub Real1 Real2)
Real1 - Real2 (mul Real1 Real2)
Real1/Real2 if Real
2
#
0 (div Real, Real2)0 if Real2 = 0
R e-a11 (sqrt Real1)
Real1 ifBool 1 (tern Bool1 Real1 Real2)
Rea12 :if notBool1
Real1 - Real2 : ifBool 1 (cmul Bool
1 Reali Real2)
Rea12 :if notBool1
Returns real constant K (dconst K) Returns real value of arg from en- (darg arg) vironment
Boolean-Valued Function Representation
Bool1 and Bool2 (and Bool1 Bool2)
Bool1 or Bool2 (or Bool1 Bool2)
not Booli (not Booli)
Real1 < Real2 (lt Real1 Real2) Real1 > Real2 (gt Real1 Real2)
Real1 = Real2 (eq Real1 Real2)
Returns Boolean constant (bconst {true, false}) Returns Boolean value of arg from (barg arg)
environment
Table 2.1: Genetic programming primitives.
Testing of expressions is done by compiling a set of benchmarks using the expres-sion as a priority function, and measuring the fitness of the expresexpres-sion when it is run. The fitness is a value specific to that run of the benchmark that reveals how well the expression performed relative to your objective. A customary use for the fitness is to measure runtime of a benchmark (lower is better), when the objective is to optimize performance and throughput. The harness ensures that every expression in a generation is run against every benchmark in the set. It batches up all the jobs (expression and benchmark pairs) that must be run, and then farms out the jobs to the parallelizing system.
Parameter Setting
Population size 400 expressions Number of generations 25 generations
Generational Mortality Rate 40%
Mutation rate 8%
Tournament size 7
Elitism Best expression is guaranteed survival.
Fitness Runtime in either seconds or cycles; lower is better Table 2.2: Genetic programming parameters.
The Finch harness collects the results from the jobs as they finish, then the ex-pressions are ranked in order of fitness. The rankings are used to determine which expressions make it into the next generation. For all tests in this paper, Finch used the parameters in Table 2.2.
The Finch library is called from the compiler in three places. The first two calls are for initializing the library when the compiler starts, and finalizing the library when the compiler terminates. The third function call is a replacement for the existing priority function. The function call parses the file that contains the candidate expression, then calculates and returns the correct priority. The features important to the priority function being optimized are sent to the Finch library to aid in this calculation. This way various priority functions can be tested in the compiler without changing the
source code.
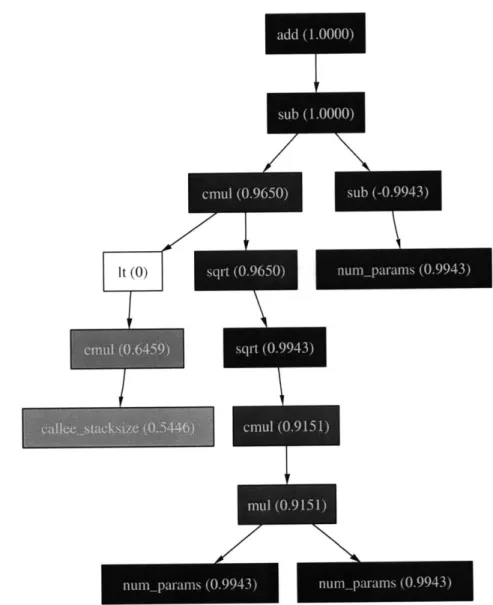
Finch also includes the f analyzer utility, which helps the user gain some numer-ical and visual insight into how a complex priority function works. When the Finch library generates the values for the priority function, it records the values of every subtree into a file. f analyzer then reads the statistics from the file and calculates the Pearson linear correlation coefficient between the subtree and the entire expression. The data is output in the dot [4] format, which can be used to draw a graphical representation of the expression. The head of each subtree is assigned a grayscale color from white to black, with black nodes indicating a correlation of 1 or -1 with
the entire expression, and white nodes indicating a correlation of 0. The very top node of the expression is always colored black, since it represents the entire expression (and has perfect linear correlation with itself). Conversely, constant nodes are always colored white.
Chapter 3
Function Inining
Deciding whether to expand function calls into the caller function is a difficult task. Like many compiler optimizations, function inlining performance is defined by the fitness of its priority function. The key decision is how much a function should be favored for inlining. Since there are often mitigating parameters such as maximum expansion quotas and minimum priority to inline, creating a priority function by hand can be relatively complex.
A function call arc is a data structure representing a function call from the caller
function to the callee function, which contains metadata for both functions. Function inlining is often implemented at the single function call granularity, where each func-tion call from a given funcfunc-tion is considered a separate funcfunc-tion call arc, even if the calls are to the same target function. Since functions can contain calls to other func-tions, inlining one function can create more possible function arcs to inline. Because of this, many programs have circular call graphs, and are impossible to inline com-pletely. Stopping the inlining process has to be done by some type of quota heuristic, since eventually the memory footprint may be large enough to cause performance losses by effects such as deteriorating cache hit rates.
com-double square(com-double input) {
return input * input;
}
void print-square(double input) {
double out = square(input);
cout << square(out);
}
void print-square-inlined(double input) {
double out = input * input;
Cout << out * out;
}
Figure 3-1: Example of function inlining. A C language example. The square function is called from print-square but inlined into print-square-inlined.
pilers implement a quota for codesize growth as a ratio of the original codesize. Other compilers implement a quota for growth of each specific function. And some compil-ers only allow a certain depth of inlining to occur (for instance, you cannot inline a function call that is part of a previous function call that was inlined).
Existing heuristics for function inlining typically focus on two main factors: (callee)
size and frequency.
Function size can be statically calculated at compile time. Small utility functions are often good targets for inline expansion, since inlining the calls results in little codesize expansion for the number of function calls avoided. A simple example of this would be the square function in Figure 3-1. Larger functions may increase the memory footprint of the program to the point where the benefits of inlining are negated.
Callsite frequency is obtainable by a couple different approaches. The most popu-lar way is to use profiling, to determine how many times each function is called during a test run. However, this data is not available at compile time and requires a full test compile and run to obtain the data. Another approach which can be performed at
compile time is static analysis, which can calculate heuristics like how many callsites in the code call the function and how often it is called inside a loop. However, know-ing the callsite frequency is extremely valuable, since inlinknow-ing the functions that are called more often will avoid a larger number of function calls.
Other higher-order effects that are more difficult to qualify include things such as interaction with other phases of compilation (whether the increased freedom for register allocation and instruction scheduling allows for better decisions, or whether it exposes flaws in the compiler that degrade performance or make the completion time of the compile unacceptably long), interactions between the stacksizes of the caller and callee function (whether inlining the function pushes the stacksize past any critical size barriers), the number of parameters to the function, the instruction mix of the function, and so on.
3.1
Compiler Infrastructure
Pinline [3] is the profile-driven function inlining module of Trimaran.
The Trimaran inlining algorithm works by sequentially scanning over the source files, and calculating a priority for every function arc encountered. The arc is added to a sorted list keyed by its priority. Once the list contains all the function arcs in the program, then each arc in the list is processed in descending order of priority.
The algorithm processes one arc at a time as follows. First the arc's priority is recomputed since some of the parameters - such as callee function size - may have changed due to the inlining that has occurred since the file scanning stage. If the newly computed priority is less than the old priority by a significant amount, the arc is retagged with the new priority, and reinserted to the sorted list to be processed later. Otherwise, the arc is inlined if there are not mitigating properties that prevent it from being inlined:
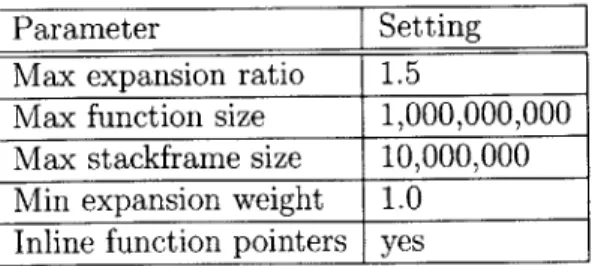
Parameter Setting Max expansion ratio 1.5
Max function size 1,000,000,000 Max stackframe size 10,000,000
Min expansion weight 1.0
Inline function pointers yes
Table 3.1: Trimaran Pinline parameters.
1. The code expansion quota has been exceeded (parameter based)
2. The function takes a varying number of arguments like the C printf function
3. The function's priority is less than the minimum required for expansion
(pa-rameter based)
4. The function's size is greater than the maximum function size that can be inlined (parameter based)
If the inlined function itself contains function calls, then new function arcs are
created and added to the list. The current arc is removed from the top of the list, and the algorithm continues until no more arcs are left to be inlined.
The parameters in Table 3.1 were the ones used throughout the experiments. The expansion size is set to 1.5 to give enough freedom for the function inlining to operate. However, it is not so large that everything is inlined and the selection of arcs is inconsequential. The other parameters are set to extreme values so as to try not to impose more restrictions that Finch has to optimize around.
Chapter 4
Implementation
Trimaran was coupled with Finch to enable us to discover priority functions for func-tion inlining automatically.
Trimaran is composed of many separate executables held together by a number of scripts. Pinline is the process in Trimaran that applies the function inlining optimization. Initialization and cleanup calls to the Finch library were inserted in the main function. The existing priority function for function inlining is the key0f function, which takes in a function call arc that contains all the information needed for a priority function. It was replaced by a call to the Finch library, which takes in the features, parses the priority function from a file on disk (placed there by the harness), and returns the correct value accordingly.
Figure 4-1 shows a simplified excerpt of the Trimaran priority function. For the large majority of cases, the priority function is simply frequency where size is the bodysize of the callee, and frequency is the frequency the arc is called during profiling. However, it does lower the priority by a factor of 0.8 if the arc is both recursive and indirect. It also has a condition where it will return a huge key if the arc meets certain very favorable parameters. The final return statement is included for when the callee function has not been processed yet. The complexity of this function helps
// Note that weight is the profiled frequency if (RECURSIVE(arc) 11 INDIRECT(arc))
weight *= 0.8;
if (weight > 0.0 && !RECURSIVE(arc) && !INDIRECT(arc) &&
size <= SMALLFUNCTION && favorsmallfunctions)
return weight > HUGEKEY ? weight : HUGEKEY;
// size == 0 when callee function's file not yet scanned in
if (size != 0)
return weight/sqrt((double)size);
// optimistic estimate to be corrected later, size = 1
else
return weight;
Figure 4-1: Excerpt of the original Trimaran baseline function.
to illustrate the difficulty in hand-tuning priority functions.
4.1
Sorted List Issues
Trimaran sequentially scans over the program source files in the scanning phase, and adds all function arcs to a sorted list keyed by their priorities. Once the list contains all the function arcs from the entire program, then each arc in the list is processed in descending order of priority in the processing phase. During the scanning phase, if the current file being scanned contains calls to functions which have not yet been scanned in, the callee portion of the function arc data passed into the priority function will be incomplete. Originally, Trimaran dealt with this with an optimistic approach: it assumed the size of the callee function was the absolute minimum of 1, and proceeded accordingly. Note that since the priority function used by Trimaran was fre , the arc would have its highest possible priority for a given frequency.
Then when the arc is encountered in the processing phase for the first time, the callee function information will be present since all of the functions will have been
in the list, maintaining the list's invariant. Also note that during the processing phase, the priority of each item in the list only decreases, since frequency stays constant, and size monotonically increases as functions are inlined.
However, this method does not work with Finch, since for some function arcs, there will be a variety of callee features that are unavailable during the scanning phase. Since nothing can be assumed about the priority function, the trick used by Trimaran is not applicable. Instead, the arc is just assigned a priority of oc (i.e. using the Linux system HUGE double), so that all the infinite priority arcs are processed at the beginning of the processing stage. Their priorities are reduced to the correct values since all the the functions are scanned in at that point.
Unfortunately, since the function sizes will increase as functions are inlined, this could cause the list to have misordered arcs during processing. Size may be positively correlated to priority in a random priority function, so it is possible that some arcs in the list may increase in priority as processing occurs. But the arcs will not rise in the list, since the ordering of the list is only determined by the priority of the arcs at the time of insertion. Modifying the algorithm to recompute priorities for all arcs after each arc is processed would cause the entire process to grow quadratically in runtime relative to the number of arcs, which would be undesirable for scaling the compiler to larger programs. Therefore, as an artifact of the Trimaran implementation, function arcs will only decrease in priority in the list - never increase.
4.2
Platform
Genetic programming was chosen for Finch partly because of its ability to distribute the workload to a machine farm. The Portable Batch System (PBS) was used to parallelize across the workload across multiple identical machines, each equipped with dual 2.2 GHz Intel Xeon processors and 2 GB of RAM running the 2.4.24 Linux
kernel. Each job dispatched consisted of testing a single priority function against a single benchmark. PBS handled the tasks of starting jobs on idle machines, queuing jobs in reserve, and spreading the workload among all eligible machines. Only one
job was allowed to run at one time on each machine, even though they were
dual-processor machines. The jobs reserve both dual-processors in the machine during runtime to eliminate the effects on runtime that the other processor running would have. About a dozen machines were available to process jobs in the PBS queue, though often the queue was shared with other users running unrelated jobs.
4.3
Features Considered
Extracting features from the function inlining module to create a search space for Finch is an important step. The following features were the ones provided to the Finch priority function:
" Boolean: Recursive - Recursive functions arcs are those that have the same function as caller and callee. Pinline can inline recursive arcs, but the inlined copy still makes a function call to itself. Recursive arcs may be less desirable to inline than normal arcs since the function call is not eliminated. This still helps performance since the number of times the arc will be called is significantly reduced. Also, the extra instructions help to create larger basic blocks, exposing more instruction-level parallelism.
" Boolean: Indirect - Indirect arcs are ones that the profiler determines were called using a function pointer. The function call can be inlined by wrapping the inlined code around a check to see if the function pointer is equal to the function inlined. Indirect arcs may be less desirable to inline than normal arcs since the inlined function may not always be the function called from that
" Real: Frequency - This is the profiled frequency of the function arc. More frequently called function arcs may be better candidates for inlining, since more function calls will be eliminated.
" Real: Callee bodysize - Functions with a smaller bodysize may be better targets for inlining, since they increase the size of the code by less. Smaller functions allow more functions to be inlined with respect to the quota.
" Real: Callee stacksize - The callee stack may contain parameters passed to the function and local variables used by the function. A larger stacksize may indicate the function does more computational work. This parameter is included since its relationship with function inlining may be useful, but the relationship is not understood well.
" Real: Caller bodysize - A larger caller bodysize may make the arc less
attrac-tive for inlining, since the resulting function may have too large of a memory footprint.
" Real: Caller stacksize - The caller stack contains the local variables of the caller function. This parameter is included since its relationship with function inlining may be useful, but the relationship is not understood well.
" Real: Number of Parameters - The more parameters a function has, the more register and stack manipulation goes into the overhead of the function call. Functions with a very large number of parameters may benefit more from being inlined to avoid the extra overhead.
4.4
Workflow
_EMcb_6: /* inflate cb 6 */
/* op 20 mov [(r 2 i)] [(r 5 i)] */
_EM_r_2_i = _EM_r_5_i;
/* op 65 jump
[]
[(cb 6)] */ goto _EMcb_6;Figure 4-2: Example of C-code from gen-probed-icode. The output is basically a translation of each intermediate representation assembly statement to a C statement.
scripts based on the default Trimaran ones. A number of modified shell scripts and python scripts were used for executing programs, gathering metrics, and monitoring execution.
Although Trimaran provides a cycle-level simulator to execute the compiled code on, its runtime was found to be prohibitively slow with larger benchmark inputs. Finch runs would have taken weeks instead of days given the computing power we
had available.
To reduce the length of the compile process, Trimaran's facility that outputs low-level C-language code from its intermediate representation was used. First the benchmark C source code is compiled by Trimaran into its intermediate representa-tion using the compile-bench script in basic block formarepresenta-tion mode. The resulting intermediate (.0) files are normally then processed by the backend. However, the gen-probed-lcode script converts the .0 files back into rudimentary C-code. The resulting C-code output mirrors the low-level instructions of the intermediate repre-sentation. An example of the type of code it outputs is shown in Figure 4-2. The gen-probed-lcode script then uses the host compiler (e.g. gcc) to compile the code into an executable binary.
gcc version 3.1.1 was used as the host compiler. It was run in the -02 optimization mode, which enables most of optimizations except function inlining. Furthermore, just to ensure that gcc was not inlining functions, the -f no-inline flag was specified
as well. Using this method, the runtime of the compiler was reduced significantly. Benchmark inputs were chosen so that the runtime would be large compared to the time difference between runs. This meant about 15-30 seconds of runtime was preferable. To minimize the effects of deviations in time between runs, each benchmark is run 5 times, and the median time is reported as the fitness. Scripts are wrapped around all of the above for logging, monitoring, and convenience.
4.5
Fanalyzer
The existing f analyzer was extended with a Java version so the statistical compu-tation would not be hindered by C++ double type precision issues. Java was chosen so the BigDecimal class could be used for easier management of precision. The new program works in exactly the same way f analyzer does.
The only problem encountered in writing the new class was that the Java BigDec-imal class has no method for taking a square root in the standard library. However, the BigSquareRoot [5] class found online helped fill that need.
Chapter 5
Experimental Results
5.1
Trimaran Default versus Finch Baseline
Since the default Trimaran priority function is priority = f7 fc"Y in most cases, this
section explores how much performance difference exists between the default priority function and a Finch model of it as only frequency From here on out, the function
priority = frequency is referred to as the baseline priority function.
The purpose of this experiment was twofold: (1) to determine whether the mod-ifications made to the Trimaran inlining algorithm affected performance, and (2) to determine whether modeling the default priority function with the simpler baseline priority function in Finch affected performance. Ideally neither one of those modifi-cations should have a statistically large affect on performance, so that the baseline priority function can be used in Finch to represent the default Trimaran function.
Using the Trimaran cycle-level simulator, two versions of Trimaran (the unmodi-fied Trimaran, and the Finch-integrated version with the baseline priority function) were compared across a suite of SPEC CPU2000 Benchmarks [6] and inputs. The results are shown in Table 5.1. In all tests performed, the two are virtually indistin-guishable in terms of performance. Hence the Finch approximation for the Trimaran
Benchmark Input Trimaran Baseline Ratio 164.gzip lgred.log 724436564 724435649 1.000 164.gzip lgred.random 1354963908 1355070192 1.000 164.gzip lgred.source 1694078740 1693487362 1.000 164.gzip lgred.graphic 1704649971 1704642310 1.000 164.gzip lgred.program 3183465513 3183475545 1.000 181.mcf smred 161412531 161456524 0.999 181.mcf mdred 254597094 254597094 1.000 181.mcf igred 1085535946 1085515627 1.000 197.parser mdred 861090004 873322404 1.014 197.parser igred 4660703110 4668080108 1.002 197.parser test 5406421526 5407536876 1.000 300.twolf test 452887018 452589756 0.999 300.twolf lgred 1597538417 1600256998 1.002 Table 5.1: Trimaran default versus Finch baseline results.
priority function makes a good model of the existing priority function.
In all runs of Finch, the baseline priority function is used as the initial seed population which all generated priority functions will be measured against. The baseline priority function will represent the default Trimaran implementation, and speedups will be measured relative to its performance.
5.2
Individual Benchmark Evolution
Finch was used to evolve the Trimaran priority function on each of the four bench-marks (164.gzip, 181.mcf, 197.parser, and 300.twolf) individually, using the parameters in Table 2.2. Each of the runs took between 2-4 days. The baseline func-tion, priority = freguenc was provided as a seed in each initial population to use as a metric. The resulting best priority functions for each of the benchmark runs will be referred to as bestl64, bestl8l, best197, and best300, respectively, from here on.
A full listing of the priority functions, and their f analyzer outputs can be found in
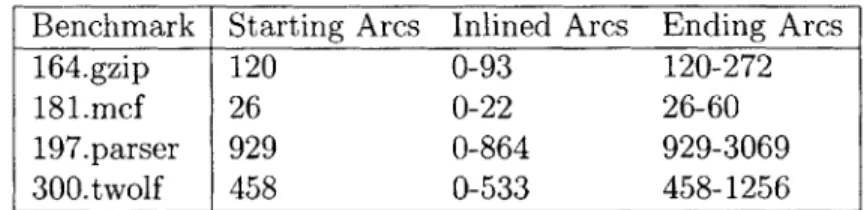
Benchmark Starting Arcs Inlined Arcs Ending Arcs
164.gzip 120 0-93 120-272
181.mcf 26 0-22 26-60
197.parser 929 0-864 929-3069
300.twolf 458 0-533 458-1256
Table 5.2: Benchmark function arcs statistics.
5.3
Post-Experimental Log Analysis
During each of the four individual benchmark Finch runs, about 3,500 priority func-tions are created and tested. For each of those priority funcfunc-tions, the compiler output is logged and archived for later examination. Python scripts were used to retrieve data from the logs and format it into statistics that could be analyzed for trends.
Table 5.2 shows how many function arcs each of the benchmarks begins compi-lation with, and the ranges for the number of arcs inlined, and the number of total arcs when inlining completes.
5.3.1
Fitness Histograms
Figures C-1 through C-4 show the histograms of all priority functions that tested successfully on the benchmarks. Each bar represents how many distinct priority functions fell into the quarter-second range of fitnesses.
It is interesting to note that Figures C-1 through C-3 display a bimodal dis-tribution. These figures correspond to the benchmarks 164.gzip, 181.mcf, and
197. parser respectively.
The larger of the two modes in the figures is the one on the left. It appears there was an abundance of priority functions that performed well. The smaller mode on the right side of the figures indicates there was also a group of priority functions that performed poorly. In all three graphs, there seems to be a clear separation between the group of priority functions that performed well versus the priority functions that
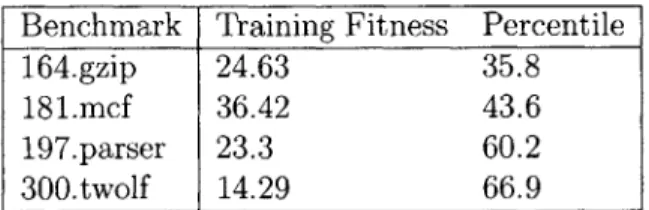
Benchmark Training Fitness Percentile
164.gzip 24.63 35.8
181.mcf 36.42 43.6 197.parser 23.3 60.2
300.twolf 14.29 66.9
Table 5.3: Baseline function percentile.
performed poorly, and there seem to be more priority functions that perform well than poorly.
Figure C-4, corresponding to the 300. twolf benchmark, does not show the same trend as the other three. Its histogram only contains one mode, and it looks very much like a standard normal curve. Table B.4 shows that this benchmark has a very high standard deviation for fitnesses between runs, as a percentage of the fitnesses. An explanation for the normal curve is that the deviation between runs of this benchmark is large enough that it obscures any differences in the priority functions, creating a normal distribution. The large deviation between runs makes analyzing data from this benchmark difficult in subsequent sections, as many of the results obtained are the result of expected statistical outliers.
Table 5.3 shows the performance of the baseline priority functions relative to all the other expressions. The baseline priority functions all fell into the better performing group of the three benchmarks with the bimodal distributions, though their percentile rankings are mediocre. In 300 .twolf, the baseline priority function performed better than the median, with a percentile ranking of 66.9.
5.3.2
Inlined Arcs versus Fitness Scatter Plots
Figures C-5 through C-8 show scatter plots, where each data point depicts a priority function with a specific number of function arcs inlined and its fitness. There is one graph for each of the four benchmarks, and every expression that completed testing
Lower is better for fitnesses in these graphs, since fitness is a measurement of runtime. The best fitness for a given number of arcs inlined in a benchmark will be referred to as the best arc-obtainable fitness.
Figure C-5 and Figure C-7 exhibit a trend where the best arc-obtainable fitness decreases as the number of inlined arcs increases from 0. However, the best arc-obtainable fitnesses reach a minimum, then start to increase with the number of inlined arcs increasing. These figures correspond to the benchmarks 164.gzip and
197. parser respectively.
In the case of 164. gzip, the peak fitness occurs at about 30 function arcs inlined; and for 197. parser, the peak fitness occurs at about 100 function arcs inlined. After those points, there is a clear dropoff in the best arc-obtainable functions as the number of inlined arcs increases. There seems to be evidence that an "optimal" number of arcs to inline exists, and beyond that point each additional function inlined is detrimental to the fitness of the priority function.
Figure C-6 for the 18 1. mcf benchmark does not exhibit this trend as clearly, since the best arc-obtainable fitnesses at 15 and 20 arcs inlined are both local minima. One explanation for this may be that there are just too few function arcs (only 26 at the start of compilation) in this benchmark. There is, however, a slight dropoff in fitness beyond 20 functions inlined, and perhaps the effect would be more pronounced if there were more arcs to inline.
300. twolf has a scatter graph that is completely different from the other 3.
Near-peak fitnesses occur at many different points for the number of arcs inlined. One observation is that each mode - the distribution for a given number of arcs inlined - appears to be a normal distribution itself; this agrees with the results from the previous section that the overall distribution is normally distributed. There are a number of modes for which the number of arcs inlined contain many data points. Note that the extreme fitnesses (very high and very low) tend to appear in these
modes. These are just the statistical outliers expected from a normal distribution.
5.3.3
Compilation Time versus Fitness Scatter Plots
Although the priority function training used runtime as the fitness, another aspect of fitness could measure the amount of time it takes the compiler to produce an output. This section examines that aspect of the results.
Figures C-9 through C-13 show scatter plots where each data point depicts a priority function and its corresponding fitness and time to compile. Figure C-12 is just a closer view of the left portion of Figure C-11. The best fitness for a given time of compilation in a benchmark will be referred to as the best time-obtainable fitness. Figure C-9, Figure C-10, and Figure C-12 all show a similar trend where a larger time of compilation results in better time-obtainable fitnesses only up until a certain point; then the best time-obtainable fitnesses get worse as compilation time increases. These figures correspond to the benchmarks 164.gzip, 181.mcf, and 197.parser respectively. One explanation for this is that the larger amount of runtime is being used to inline more functions; and from the previous section's results, there is a dropoff in priority function performance after a threshold is exceeded.
These results seem to indicate that expressions that take much longer to compile do not result in good fitnesses. If this is the case, then in future Finch runs, the abnormally long compilation runs should just be killed after exceeding a time quota
by a sniper script. This would speed up the genetic programming process since those
expressions take up a disproportionate amount of runtime for their poor fitnesses. Once again 300.twolf is an unusual case. Its scatter plot in Figure C-13 does not show the same correlation between fitness and compilation time as clearly. The lowest fitnesses do come from priority functions that have relatively low compilation times, but then there are functions with high compilation times that have fitnesses that are almost as good. Again, the large deviation between runs of the benchmark
1.05 C-0_ 164.gzip 0. - 181.mcf L 197.parser 0.95 E300.twolf 0.9 0.85-Q0 00 CF) C) =z
4)
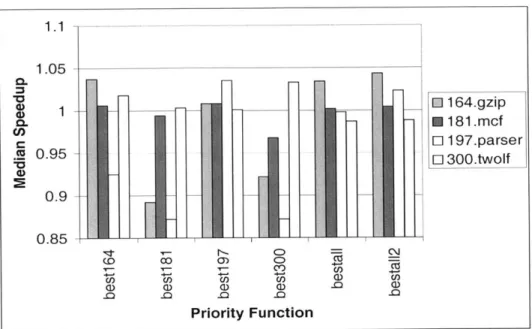
U) U6- - U) -#.-U C) CD) a) CD) . I Priority FunctionFigure 5-1: Median speedups
probably masks any real performance differences between priority functions.
5.4
Performance Results
The speedups achieved by Finch during training were as follows: 164.gzip 1.042;
181.mcf 1.043; 197.parser 1.043; 300.twolf 1.12. Speedup is computed speedup =
(bestfitness)/(baselinefitness). These were the actual speedups obtained during
the running of Finch when choosing priority functions.
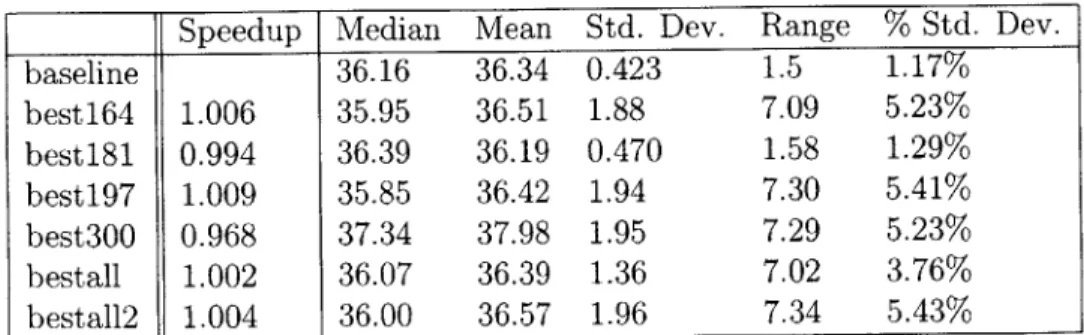
After the Finch runs had completed, the baseline function and the newly found best functions for each benchmark were run 25 times each on all four benchmarks to gather statistical data. Tables B.1 through B.4 show detailed information about the performance of the various priority functions on the different benchmarks. Figure 5-1 shows the median speedups obtained by the various best priority functions on all four
Using the data obtained from the statistical runs, the following median speedups were achieved by the best function over the baseline in the benchmarks on the training
sets: 164.gzip 1.037; 181.mcf .994; 197.parser 1.035; 300.twolf 1.033.
Then the best priority functions for each benchmark were run with another set of data, the testing data, for cross-verification of results. The following speedups were achieved by the best function on the testing sets: 164.gzip 1.037; 181.mcf .984; 197.parser 1.042; 300.twolf 1.014. These were run only once each.
The results show that the improvements from the training set carry through to the testing set, with a similar looking set of figures obtained.
The best181 priority function did not show any speedup on the 181.mcf training set; this will be examined further in an upcoming section. However, the other three
benchmarks all had statistically significant gains.
And to quantify how much function inlining produces speedups in program execu-tion, the following speedups were obtained from running the best priority functions over disabling the inlining module: 164.gzip 1.153; 181.mcf 1.084; 197.parser
1.192; 300.twolf 1.068.
5.4.1
164.gzip
164.gzip was trained with the train. combined input set, and tested against the ref .program input set, to produce the best 164 priority function in Figure A-1.
This benchmark is a modified version of the gzip compression program designed work entirely in memory, so the effects of disk loading are isolated. The inputs vary from logs to programs to binaries to random bits; and the output is a losslessly compressed chunk of data.
The best164 priority function obtained the following median speedups on the four benchmarks: 164.gzip 1.037; 181.mcf 1.006; 197.parser 0.925; 300.twolf 1.018. The only real speedup obtained by this priority function was in the benchmark it
trained on, so there may be benchmark-specific properties in the priority function.
A simplified version of best164 is: (callsite-stacksize)3/2*
frequency*(frequency+
1.5812)/9.5964.
This frequency has a positive influence on the priority of this function, which makes sense as arcs with higher frequencies of execution are better candidates for inlining. The priority is also positively influenced to callsite-stacksize, which is in-teresting since it rewards callsites with larger stacksizes. This may be the benchmark-specific part of the priority function.
5.4.2
181.mcf
181.mcf was trained with the train input set, and tested against the ref input set, to produce the best181 priority function in Figure A-2.
This benchmark solves a problem similar to creating public transit schedules, where a vehicle fleet with a single depot is analyzed to determine a schedule. The inputs are the parameters for the problem, which is a listing of the type of trip and the time length required. The output is an optimal schedule from the benchmark.
The best181 priority function obtained the following median speedups on the four benchmarks: 181.mcf 0.994; 164.gzip 0.892; 197.parser 0.872; 300.twolf 1.003.
Since the median speedup for best181 on 181. mcf was actually a slight slowdown, the next two best expressions were tested 25 times to see if they performed better. None of them could produce even a 1% speedup. The priority function created by this run did not create any real improvement in any of the benchmarks, including the one it was trained on. In fact, significant slowdowns in 164.gzip and 197.parser indicate this function has little research value.
One reason why this benchmark could have been difficult to improve upon is that there was a magnitude fewer function arcs than in the other 3 benchmarks. Fewer than 25 arcs were inlined in every single trial, in contrast to the 90-900 maximum
inlined arcs in the other benchmarks. With only about 30 decisions to make, there does not appear to be a lot of room to improve over the baseline function. Perhaps the benchmark is just not well suited for inlining research, as many priority functions will produce the same subset of arcs to inline.
5.4.3
197.parser
197.parser was trained with a shortened version of the ref input set, since the second-longest input still had too short a runtime (about 6 seconds) to train on. The testing was done on the entire ref input set. Shortening of the ref input set was done via taking a "head -n 600" of the normal ref input set. 25 generations of Finch produced the best197 priority function in Figure A-3.
This benchmark is a syntactic parser of English. The input is a list of sentences, each of which is analyzed by the parser. The parser outputs its interpretations and annotations of each sentence, such as whether certain words are unneeded. Expec-tations for this benchmark were that it would have large gains in speedup, since function inlining is especially beneficial to programs like parsers which spend most of their time running in loops and dispatching requests to small functions.
The best197 priority function obtained the following median speedups on the four benchmarks: 197.parser 1.035; 164.gzip 1.008; 181.mcf 1.008; 300.twolf 1.001. Although the only appreciable gain in performance is on the benchmark it trained on, this was the only priority function of the four that produced speedups of at least 1 on all four benchmarks. This is also easily the best performing function of the four.
A simplified version of the best197 priority function is: (Recursive ? .8 : 1) *
(frequency3)
* (num-params)* (5+callee bodysize)
This priority function is similar to the baseline function in that frequency con-tributes positively to the priority, and that callee-bodysize concon-tributes negatively. The power to which both contribute is different though. An additional factor, num-params,
also contributes positively to the priority, which makes sense since more parameters requires more function call overhead in moving the parameters into the correct reg-isters and stack positions. Inlining allows the register allocator more freedom, since the extra register activity would create more dependencies. Much like the default Trimaran implementation, there is a multiplicative penalty for the function arc being recursive; possibly since inlining a recursive arc does not fully remove the function call.
5.4.4
300.twolf
300. twolf was trained with the train input set, and tested against the ref input
set, to produce the best300 priority function in Figure A-4.
This benchmark is a transistor placement and global routing algorithm that is similar to one which would be used in the production of microchips. According to the benchmark's description, much of the workload from doing inner loop calculations and traversing large enough amounts of memory to force cache misses. The inputs are a series of files which describe the cells to be placed, and the outputs are a routing plan and a placement plan.
As discussed earlier, this benchmark had a large variance in fitnesses between identical runs. The standard deviation was between 3-5% of the median for the baseline and the best300 functions. Since the median speedup obtained was only
3.3%, the variation was extremely significant. Perhaps the fact that most of the work
done by this benchmark is done in inner loop calculations, means that the function call performance is comparatively insignificant. The normal distribution of the histogram in Figure C-4 seems to support this theory.
The best300 priority function obtained the following median speedups on the four benchmarks: 300.twolf 1.033; 164.gzip 0.922; 181.mcf 0.968; 197.parser 0.872. Although the function achieved a speedup in the benchmark it trained on, in all other
benchmarks it recorded significant slowdowns. The large deviation in runtimes could indicate there were better functions in the population, but that this one happened to be an outlier. The fact this function performed so poorly on the other three benchmarks may indicate the presence of many benchmark-specific features in its priority function.
Since Finch only runs each expression once during training, the large deviation could have had an adverse effect on ranking the expressions during training. For instance, during training, both the baseline and best times were smaller than the median times obtained later in the statistical runs. The speedup found during training was a very high 1.12.
A simplified version of the best300. priority function is: (nTiJm-params * 1.18) +
num-params
This priority function is quite unusual in that neither frequency nor callee-stacksize, the two variables in the baseline priority function, appear in it. Instead, it is relies on the positive influence of the num-params variable, which could indicate something benchmark-specific in this expression. Perhaps this benchmark is not well suited to inlining research either.
5.5
All Benchmarks
Using the same setup as with the individual benchmarks, Finch was used to run 25 generations of priority functions on all four of the benchmarks at once. When running multiple benchmarks, Finch determines the fitness for each priority function by the arithmetic mean of the speedups over the baseline. The bestall priority function was produced by this process, and then run 25 times against all four benchmarks for statistical data. It is shown in Figure A-5.