L’aménagement de l’habitat du caribou forestier
permet-il la conservation de la biodiversité?
Mémoire
Orphé Bichet
Maîtrise en Biologie
Maître ès sciences (M.Sc.)
RÉSUMÉ
Cette étude a évalué l’effet de scénarios d’aménagement de l’habitat du caribou forestier (Rangifer tarandus) sur la diversité aviaire. Un indice d’occupation de 29 espèces d’oiseaux a été développé à partir d’observations de terrain, puis comparé entre sept paysages simulant différentes répartitions des coupes forestières et deux cycles de rotation de coupe. Alors que la répartition des coupes influençait peu les assemblages d’oiseaux, la diversité aviaire était maintenue davantage après une rotation de 100 ans qu’une de 60 ans. Les assemblages d’espèces attendus après ces deux cycles étaient différents de ceux d’un paysage sans coupe, indiquant qu’un temps de révolution plus court que le cycle de perturbations naturelles affecterait la diversité aviaire. Notre méthodologie permet donc d’évaluer l’impact de stratégies d’aménagement sur la biodiversité avant leur mise en œuvre. Nous avons ainsi pu démontrer que l’aménagement de l’habitat du caribou actuellement préconisé ne suffirait pas à conserver les oiseaux boréaux.
ABSTRACT
This study assessed the effect of habitat management for the recovery of boreal caribou (Rangifer tarandus) on the diversity of boreal birds. An index of occupancy was estimated for 29 bird species from surveyed data, and then compared among seven simulated landscapes contrasting in cut-block distribution and harvest rotation. Whereas cut-block distribution had little effect on bird assemblages, bird diversity was better maintained under a 100-year harvest rotation than a 60-year rotation. Bird assemblages for both harvest rotations differed significantly from assemblages expected in an uncut landscape, implying that rotations shorter than natural disturbance cycles could affect regional biodiversity. Our method thus allows the assessment of the long-term impact of various management strategies on biodiversity prior their implementation. On this basis, we showed that the current habitat management guidelines for boreal caribou recovery would not be sufficient to conserve bird diversity in the boreal forest.
TABLE DES MATIÈRES
RÉSUMÉ ... iii
ABSTRACT ... v
TABLE DES MATIÈRES ... vii
LISTE DES TABLEAUX ... ix
LISTE DES FIGURES ... xi
LISTE DES APPENDICES ... xiii
AVANT-PROPOS ... xv
Remerciements ... xvii
INTRODUCTION ... 1
Impact des activités anthropiques sur la biodiversité ... 1
Stratégies de conservation de la biodiversité ... 2
L’écotype forestier du caribou des bois (Rangifer tarandus) en tant qu’espèce parapluie de la biodiversité forestière boréale ... 4
Impact potentiel du plan de rétablissement du caribou forestier sur la biodiversité boréale ... 6 Objectif de l’étude ... 7 Approche empirique ... 8 CHAPITRE PRINCIPAL ... 9 Résumé ... 10 Methods ... 15 Study area ... 15 Management scenarios ... 15 Bird sampling ... 18
Modelling bird species occurrence probability ... 18
Results ... 22
Effect of cut aggregation on bird diversity ... 22
Effect of harvest rotation cycle on bird diversity ... 27
Discussion ... 28 Acknowledgements ... 32 References ... 32 Appendices ... 39 CONCLUSION GÉNÉRALE ... 45 Originalité du projet ... 49 Perspectives ... 50 BIBLIOGRAPHIE GÉNÉRALE ... 51
LISTE DES TABLEAUX
Table 1. Description of stand- and landscape scale variables used to build bird species occurrence probability models ... 19 Table 2. Summary of the best models of mixed logistic regression (N = 630 sampling sites) predicting probability of occurrence ps of bird species s, calculated as ps = exp(w(x)) /
[1 + exp(w(x))] (logit link) or as ps = 1 – exp(-exp(w(x)) (cloglog link), with
associated area under curve (AUC). ... 21 Table 3. Description and percentage cover of the land cover types comprised in the 2012
landscape, together with six landscapes simulated in the Côte-Nord region of Québec, Canada. ... 23 Table 4. Jaccard similarity index between bird assemblages in the uncut and harvested
landscapes and number of bird species with increasing or declining probability of occurrence in a harvested landscape compared to an uncut landscape (Luncut) according
to species habitat association. ... 24 Table 5. Percent change in index of occupancy (Ps) of 29 bird species between the uncut
landscape (Luncut) and six harvested landscapes expected under three management
LISTE DES FIGURES
Figure 1. Forest age distribution in different management scenarios simulated in an area of the Côte-Nord region in Québec, Canada. ... 17
LISTE DES APPENDICES
Appendix 1. Classification of boreal bird species according to habitat preference (from www.birds.cornell.edu), together with the percentage of sampling stations (n = 630) where the species was detected during six summers from 2004 to 2011, in eastern Canada boreal forest. ... 39 Appendix 2. Jaccard similarity index between bird assemblages predicted across seven
landscapes subjected to different forest management, in eastern Canada boreal forest. ... 43
AVANT-PROPOS
Ce mémoire de maîtrise vise à évaluer le potentiel de conservation de la stratégie d’aménagement de l’habitat du caribou forestier pour maintenir la diversité aviaire en forêt boréale. Ce mémoire se présente en trois parties : une introduction générale, un chapitre présenté sous la forme d’un article scientifique rédigé en anglais et une conclusion générale. En tant que première responsable du projet et étant donné ma contribution au projet (compilation et analyses des données, écriture du mémoire et de l’article), je serai première auteure de l’article. Les autres auteurs de l’article sont:
‐ Daniel Fortin, directeur de maîtrise et professeur au département de biologie de l’Université Laval.
‐ Christian Hébert, codirecteur de maîtrise et chercheur scientifique en écologie et diversité des insectes forestiers au Centre de foresterie des Laurentides.
‐ Angélique Dupuch, professeure au Département des sciences naturelles de l’Université du Québec en Outaouais.
Remerciements
J’aimerais avant tout remercier mon directeur de recherche, Daniel Fortin, pour l’opportunité qu’il m’a offerte d’entreprendre ce projet et la confiance qu’il a placé en moi alors que la forêt boréale m’était encore inconnue. Je le remercie pour le temps et le travail qu’il m’a dédié tout au long de ma maîtrise.
Je remercie également mon codirecteur de recherche, Christian Hébert, pour m’avoir acceptée dans son laboratoire. Son soutien, sa confiance en mon travail et nos discussions m’ont grandement stimulée durant ces dernières années.
Je dois également un grand merci à Angélique Dupuch pour son aide et son support dès le début du projet. Son aide m’a été précieuse autant sur le terrain que pendant les analyses et l’écriture, et je ne serais pas où j’en suis aujourd’hui sans ses efforts.
J’aimerais aussi remercier les personnes qui ont participé à la collecte de données: David Pinaud, Aurore Malapert, Adam Moreira, Jérôme Lemaître, Jean-Philippe Legaré, Mélanie-Louise Leblanc, ainsi que les aides de terrain sans qui la tâche aurait été impossible. Notamment j’envoie un grand merci à Pascal Royer-Boutin et lui souhaite du bon vent pour la suite de ses études.
Je remercie Jacques Duval et Sandra Heppell du Ministère des Ressources Naturelles (MRN) pour leur assistance dans le développement des scenarios d’aménagement forestier. Je suis également reconnaissante du travail de Gabriel Emond et Philippe Goulet pour l’obtention et la compilation des données éco-forestières indispensables à l’étude. Je remercie énormément Pierre Racine pour son extrême disponibilité, son aide précieuse et sa patience avec les logiciels de GIS. Un grand merci également à Yves Dubuc pour son aide au laboratoire.
Je tiens à remercier Conrad Cloutier pour ses suggestions sur mon proposé de recherche. Je remercie André Desrochers et Pierre Drapeau pour avoir accepté d’évaluer mon mémoire.
xviii
Je remercie aussi les membres du laboratoire, pour leur support tout au long des années: Sabrina Courant, Marie-Claude Labbé, Guillaume Moreau, Hélène Le Borgne, Jerod Merkle, Marie Sigaud, Chrystel Losier, Olivia Tardy, Angélique Dupuch, Mathieu Basille, Léa Harvey, Qing Zao, Carolyn Nersesian, Julie Martineau et Caroline Gagné. Notamment un grand merci à Hélène pour son aide et ses commentaires tout au long du projet, à Jerod qui a toujours été prêt à partager ses connaissances en R, à Chrystel pour son aide et sa patience lors de nombreuses étapes, et Olivia pour son aide avec ArcGIS et Colosse. Merci à tous aussi pour votre accueil, pour les belles soirées et sorties toujours mémorables, et pour le dynamisme que vous m’avez transmis durant ces années.
Je dois plus qu’un merci à ceux qui m’ont entourée, endurée et faite rire au cours des saisons : Stéphanie Guilherme qui a été une source de motivation et une amie depuis le premier jour, Sébastien Blade Bélanger pour son éternelle bonne humeur, ses encouragements et nos discussions sur la glace, Maxime Tanguay qui a rendu agréables les longues heures de laboratoire et pour les bons moments partagés depuis, Olivier Norvez pour son accueil dans le laboratoire et son enthousiasme communicatif, et Léo Chaumond-Lessard pour nos belles discussions, son support et ses talents de peintre.
Je ne peux assez remercier Jérémy Le Luyer, pour son support et ses encouragements surtout dans les moments difficiles, son extrême patience et sa foi en moi. Mais aussi pour l’inspiration, les rires et les magnifiques moments passés ensemble qui ont éclairé ces dernières années dans la chaleur de l’été et la grisaille des tempêtes.
Pour finir, j’envoie un grand merci à ma mère qui malgré la distance a toujours été à mes côtés. Elle a toujours été la première à m’encourager dans mes choix et à croire en moi.
Deixe de ser quem era, e se transforme em quem é.
Paolo CoelhoINTRODUCTION
Impact des activités anthropiques sur la biodiversité
La biodiversité est définie comme la richesse des variations biologiques, soit la variété des fonctions et structures des organismes, leur agencement et leur dynamique (Freedman et al. 1996). Elle peut être évaluée à différents niveaux du vivant (génétique, population, communauté, écosystème) et à diverses échelles spatiales (DeLong 1996). La biodiversité a souvent été mesurée en fonction du nombre d’espèces présentes et de l’abondance des individus. Cependant dans un contexte de changements environnementaux, au-delà de la richesse spécifique, c’est l’identité et l’abondance respective des espèces qui déterminent le fonctionnement de l’écosystème dans les limites de sa variabilité naturelle ainsi que sa capacité de résilience (Chapin et al. 2000), c’est-à-dire sa capacité à résister et se rétablir face à des événements extrêmes. C’est donc à l’échelle des communautés d’espèces qu’il faut évaluer l’effet des modifications de l’environnement.
La majorité des activités humaines, notamment depuis l’avènement de l’ère industrielle, altèrent les milieux naturels, et par conséquent les communautés d’organismes qui y vivent (Foley et al. 2005; Fahrig 2013). Les modifications de l’habitat engendrées par l’agriculture et l’élevage intensifs, l’industrie forestière et minière et l’urbanisation influencent particulièrement la faune sauvage, des invertébrés aux grands mammifères, en passant par les oiseaux, les reptiles et les micromammifères (Gibbon et al. 2000; McKinney 2008; Fortin et al. 2010; Batáry et al. 2012). Les espèces rares et les espèces spécialistes sont très sensibles aux changements du milieu, et souvent déclinent ou disparaissent suite aux perturbations anthropiques (Gibbon et al. 2000; Imbeau et al. 2001; Fortin et al. 2010). Au contraire, les paysages modifiés deviennent souvent plus favorables pour les espèces communes et généralistes (Schmiegelow & Mönkkönen 2002). Le déclin des unes et l’accroissement des autres remodèlent les assemblages d’espèces (McKinney & Lockwood 1999) et peuvent avoir des conséquences sur le fonctionnement de l’écosystème (Olden et al. 2004).
La perte de biodiversité et l’homogénéisation des communautés animales engendrées par les perturbations humaines affectent le fonctionnement et la résilience des
2
écosystèmes (Folke et al. 2004; Olden et al. 2004). L’effet direct des modifications de l’habitat sur la faune est accentué par les interactions intra- et interspécifiques. Les changements d’abondance de certaines espèces clés influencent directement et indirectement d’autres espèces (Mönkkönen et al. 1997; Thomson et al. 2003; Angers et al. 2005; Courtois et al. 2007). Ainsi la disparition d’espèces clés ou de groupes fonctionnels entiers peut altérer la capacité d’un écosystème à remplir certaines fonctions et services, ainsi que sa résistance et résilience aux changements (Chapin et al. 2000). Afin de maintenir l’intégrité de l’écosystème, il est donc nécessaire de conserver la biodiversité et la complexité des relations biotiques.
Stratégies de conservation de la biodiversité
Diverses stratégies ont été proposées et employées pour préserver la biodiversité tout en assurant la continuité des activités anthropiques. La perte d’habitat étant une des principales menaces sur la biodiversité, plusieurs stratégies reposent sur la préservation des caractéristiques de l’habitat à différentes échelles (Lindenmayer et al. 2006). L’aménagement écosystémique, par exemple, recommande de garder les perturbations anthropiques dans les limites de variabilité des perturbations naturelles régionales (Gauthier et al. 2008). Cette stratégie permettrait de maintenir l’hétérogénéité du paysage aménagé en générant des milieux auxquels les espèces sont les plus adaptées. D’autres stratégies sont basés sur la végétation mais nécessitent aussi, pour être efficaces, de considérer les caractéristiques de la faune. Par exemple, maintenir la connectivité spatiale et temporelle entre les parcelles d’habitat (Lindenmayer et al. 2006) ne suffirait pas si cette connectivité n’est pas également fonctionnelle (Baguette & Dyck 2007; Dancose et al. 2011). Cela signifie qu’un lien physique doit être perçu comme utilisable par la faune. La connectivité fonctionnelle pour une espèce dépend notamment de sa capacité de déplacement, de sa tolérance aux autres types de milieux et du risque de prédation perçu par l’espèce considérée dans les corridors fauniques ou les parcelles reliées (Bélisle 2005). Une autre stratégie est de conserver l’aire totale d’habitat dans le paysage au-dessus d’un seuil (Drapeau et al. 2009a; Rompré et al. 2010). Ces seuils d’habitats sont aussi définis par
rapport aux besoins et aux caractéristiques d’une espèce. Il apparaît alors indispensable de considérer la faune dans les stratégies d’aménagement du territoire.
Le concept d’espèce indicatrice a été beaucoup exploré pour la conservation de la biodiversité dans un paysage aménagé. Une espèce indicatrice est une espèce dont les caractéristiques, telles que sa présence, son abondance et le succès reproducteur des individus sont des indicateurs de la qualité de l’habitat pour les autres espèces (Landres et al. 1988). Souvent appliquée pour évaluer l’impact des changements environnementaux ou l’efficacité de mesures d’aménagement, l’idée d’utiliser une espèce comme représentant des autres organismes et fonctions de l’écosystème se retrouve dans plusieurs stratégies de conservation de la biodiversité (Simberloff 1998; Roberge & Angelstam 2004; Froese et al. 2008). L’espèce représentative peut être sélectionnée selon divers critères. L’effet disproportionné d’une espèce sur l’écosystème par rapport à son abondance l’identifie comme espèce clé (Simberloff 1998). De par leur position dans le réseau trophique, leurs relations interspécifiques ou leur capacité à modeler l’environnement, plusieurs espèces clés ont été au centre de stratégies de conservation de la biodiversité (Simberloff 1998). En particulier, une espèce envahissante possède généralement des qualités d’espèce clé et suscite des mesures pour la protection des espèces locales (Bax et al. 2003). La taille du domaine vital est un autre critère de choix pour orienter les efforts de conservation sur une espèce particulière, alors appelée espèce parapluie. Préserver le territoire nécessaire à une espèce parapluie, généralement plus grand que celui des autres espèces de l’écosystème, permettrait d’englober les besoins en habitat de toutes les autres espèces de l’écosystème (Roberge & Angelstam 2004). Le caractère menacé d’une espèce est aussi souvent une motivation dans l’élaboration de stratégies d’aménagement du paysage (Roberge & Angelstam 2004). Finalement, le degré de popularité d’une espèce auprès du public est un atout qui permet d’en faire une espèce phare des actions de conservation (Roberge & Angelstam 2004).
Les stratégies de conservation de la biodiversité basées sur une espèce unique présentent plusieurs avantages. Tout d’abord, l’échantillonnage d’une seule espèce est généralement plus simple à réaliser et permet notamment de réduire les coûts d’inventaires. De plus, de telles stratégies sont simples et intuitives, ce qui facilite leur mise en application et la communication avec le public et les différents acteurs impliqués dans
4
l’effort de conservation. Les stratégies établies autour d’une seule espèce n’ont, toutefois, montré que peu de succès pour la conservation de la biodiversité (Simberloff 1998; Roberge & Angelstam 2004; Branton & Richardson 2011). Les critères de sélection de l’espèce cible ne sont que rarement définis clairement (Favreau et al. 2006) et l’efficacité d’une stratégie visant à préserver la biodiversité a souvent été évaluée après sa mise en œuvre (Roberge & Angelstam 2004; Branton & Richardson 2011). La principale critique de telles stratégies réside dans le fait que les caractéristiques de l’habitat favorisées par une seule espèce ne peuvent englober l’entière variabilité du paysage (Roberge & Angelstam 2004; Hurme et al. 2008; Roberge et al. 2008). La préservation d’une espèce nécessitant de très grands espaces devrait, dans ce cas, permettre de conserver les ressources de beaucoup d’espèces de l’écosystème.
L’écotype forestier du caribou des bois (Rangifer tarandus) en tant qu’espèce parapluie de la biodiversité forestière boréale
L’écotype forestier du caribou des bois est une espèce symbolique de la forêt boréale canadienne répondant à plusieurs critères de sélection des espèces parapluies. C’est un des plus grands herbivores présent dans l’écosystème boréal, avec un domaine vital annuel variant de 200 à 1500 km2 selon les individus (Faille et al. 2010) et pouvant atteindre près de 4000 km2 dans certaines aires perturbées (Brown et al. 2011). La préservation des attributs naturels de l’habitat au sein de domaines vitaux individuels devrait englober les besoins des autres espèces sylvicoles boréales. Le caribou a également une importance économique et sociale pour les peuples des Premières Nations qui le chassent traditionnellement (Équipe de rétablissement du caribou forestier au Québec 2013). De plus, ce cervidé est particulièrement affecté par les activités anthropiques, notamment la foresterie (Hins et al. 2009; Fortin et al. 2013).
Le caribou forestier sélectionne préférentiellement les vieilles forêts ouvertes à lichen (Courbin et al. 2009; Hins et al. 2009; Moreau et al. 2012); or, ces peuplements sont également la cible de l’industrie forestière. Le développement de la foresterie au Canada a conduit à une perte d’habitats propices au caribou et à une diminution de son aire de répartition. Autrefois présent jusqu’au nord des États-Unis d’Amérique, il n’est aujourd’hui
retrouvé, hormis quelques hardes isolées, qu’au-dessus du 49ème parallèle (Courtois et al. 2001; Schaefer 2003; Venier & Pearce 2005). L’activité humaine en forêt boréale altère aussi la qualité de l’habitat pour le caribou (Courtois et al. 2008). Sensible au dérangement humain, ce cervidé a tendance à éviter les coupes récentes et les routes (Hins et al. 2009; Bastille-Rousseau et al. 2011). Indirectement, la foresterie augmente le risque de prédation du caribou par le loup gris (Canis lupus), via l’augmentation des populations d’orignaux (Alces americanus), sa proie principale, suite à l’enfeuillement des parterres de coupe (Bergerud 1988; Courtois et al. 2007). En effet, cette augmentation d’orignaux est alors suivie d’une réponse numérique des populations de loups. Les menaces directes et indirectes des activités anthropiques sur l’espèce et son habitat ont provoqué son déclin, et l’écotype forestier du caribou des bois est inscrite depuis 2002 sur la liste des espèces en péril (Thomas & Gray 2002). Des stratégies d’aménagement forestier ont alors été mises en place dans plusieurs provinces (Environment Canada 2012; Équipe de rétablissement du caribou forestier au Québec 2013). Au Québec, le plan de rétablissement du caribou forestier reprend certains principes de l’aménagement écosystémique (Gauthier et al. 2008) pour les adapter à la conservation de l’habitat du caribou forestier tout en assurant un niveau de récolte de bois économiquement viable (Courtois et al. 2004).
Les principales lignes directrices du plan d’aménagement reposent sur la gestion de massifs de coupe et de massifs de protection temporaire, et sur l’implantation d’une rotation entre ceux-ci (Équipe de rétablissement du caribou forestier au Québec 2013). Les coupes doivent être agglomérées afin de réduire la fragmentation de l’habitat et de simuler un paysage perturbé par le feu ou de grandes épidémies d’insectes, principales perturbations naturelles en forêt boréale de l’est du Canada (Courtois et al. 2004; Gauthier et al. 2008; Jetté 2007; Pouliot et al. 2010). Les massifs de protection temporaire doivent inclure des types de milieux favorables au caribou forestier, mais où les activités humaines sont réduites (Courtois et al. 2004). Ils pourront être récoltés lorsque les massifs de coupe adjacents ne seront plus perturbés, selon la définition d’Environnement Canada (2011) qui considère qu’un peuplement où au moins 65 % de la forêt est âgée d’au moins 50 ans n’est plus un peuplement perturbé. Basée sur cette définition, un cycle de rotation de 50-60 ans entre les massifs a été établi. Le plan de rétablissement du caribou forestier a pour but d’assurer la présence en quantité suffisante d’habitats de qualité en tout temps pour le
6
maintien des populations de caribous dans un paysage aménagé. Cette stratégie d’aménagement est prometteuse car, étant centrée sur une espèce présentant de nombreux attributs d’espèce parapluie, elle reprend aussi des principes de l’aménagement écosystémique. L’étendue des conséquences d’une telle stratégie sur la biodiversité boréale reste cependant incertaine.
Impact potentiel du plan de rétablissement du caribou forestier sur la biodiversité boréale
Les modifications de l’habitat à l’échelle du peuplement et du paysage causées par l’activité forestière affectent la biodiversité. À l’échelle du peuplement, la coupe forestière altère la structure et la composition de l’habitat des espèces animales (Haeussler & Kneeshaw 2003). Contrairement à un feu qui laisse des arbres vivants sur pied et des chicots, une coupe totale se caractérise par l’absence de canopée et un sol exposé en début de succession (Perron et al. 2009). La régénération de la végétation après coupe est aussi plus homogène qu’après perturbation naturelle, se caractérisant par l’absence de gros débris ligneux jusqu’à un stade avancé de la succession forestière (Buddle et al. 2000; Imbeau et al. 2001). Les espèces animales spécialistes d’un stade de succession particulier (e.g. vieilles forêts hétérogènes, Imbeau et al. 2001) ou de certains éléments structuraux de l’habitat tels que les cavités ou le bois mort (Imbeau et al. 2001; Fortin et al. 2010) sont alors particulièrement affectées par la coupe forestière. Indirectement, les changements de répartition et de taille des populations de ces espèces peuvent se répercuter sur d’autres. Par exemple, la perte de gros arbres sur pied dans les coupes forestières entraîne le déclin des espèces excavatrices dans le paysage et l’effet se répercute sur toutes les espèces dépendantes des cavités (Imbeau et al. 2001). Au contraire, d’autres espèces possédant des traits fonctionnels particuliers (e.g. insectivores du feuillage, Azeria et al. 2011; Zhao et al. 2013) peuvent bénéficier des modifications de l’habitat associées à la récolte forestière. Par conséquent, les assemblages d’espèces animales retrouvés dans les divers stades de succession après coupe totale diffèrent de ceux retrouvés après une perturbation naturelle (Crête et al. 1995; Keller et al. 2003; Palladini et al. 2007; Zhao et al. 2013).
La qualité de l’habitat dans un peuplement est également déterminée par la qualité de la matrice environnante (Lemaître et al. 2012). La coupe forestière modifie la structure et la composition du paysage et, par conséquent, la qualité et l’accessibilité des peuplements pour certaines espèces fauniques (Drolet et al. 1999; Villard et al. 1999; Drapeau et al. 2000; Imbeau et al. 2001; Schmiegelow & Mönkkönen 2002). De plus l’impact des changements du paysage sur une espèce ou un groupe d’espèces peuvent se répercuter sur d’autres espèces (Mönkkönen et al. 1997; Thomson et al. 2003; Angers et al. 2005; Courtois et al. 2007). En forêt boréale, par exemple, plusieurs espèces d’oiseaux migrateurs choisissent leur site de nidification en fonction de la présence d’espèces résidentes (Schmiegelow & Mönkkönen 2002). Or, ces dernières abandonnent les parcelles de forêt mature favorables aux migrateurs quand la qualité de la matrice environnante est réduite par les coupes forestières (Schmiegelow & Mönkkönen 2002). L’impact négatif de la foresterie sur les oiseaux résidents peut donc avoir des conséquences sur beaucoup d’autres espèces d’oiseaux (Schmiegelow & Mönkkönen 2002). En raison de la complexité des relations intra- et interspécifiques, du délai dans la réaction de la faune aux changements environnementaux, de l’absence de données récoltées sur de longues périodes, et de la variabilité naturelle du paysage forestier, l’impact des modifications de l’habitat par l’industrie forestière sur la biodiversité régionale est encore mal connu.
Objectif de l’étude
Cette étude évalue l’efficacité d’une stratégie d’aménagement pour la conservation d’une seule espèce à maintenir la biodiversité régionale. Les besoins du caribou forestier étant maintenant intégrés dans la planification de l’aménagement de la forêt boréale québécoise, le cervidé est un bon candidat pour vérifier le potentiel d’espèces parapluies à maintenir la biodiversité dans les écosystèmes boréaux. De plus les caribous sont sensibles aux changements environnementaux et ont de grands domaines vitaux annuels (Faille et al. 2010), deux attributs de choix pour une espèce parapluie. Les oiseaux ont été choisis en tant qu’indicateurs de la biodiversité régionale. Ce groupe taxinomique est reconnu comme un indicateur efficace de la biodiversité et des fonctions de l’écosystème car il regroupe un grand nombre d’espèces occupant divers rôles trophiques, écologiques et économiques
8
réagissant différemment aux modifications de l’habitat (Freedman et al. 1994; Gregory 2006; Gregory & Strien 2010).
Approche empirique
Les oiseaux ont été dénombrés, entre 2004 et 2011, par méthode de point d’écoute à 630 sites le long d’un gradient de succession après coupe et après feu. La probabilité d’occurrence des 29 espèces, présentes dans 5 à 95% des sites, a été modélisée au moyen de régressions logistiques en fonction des caractéristiques de l’habitat à l’échelle du peuplement et du paysage dans un rayon de 1 km, distance jusqu’à laquelle les coupes affecteraient les oiseaux boréaux (Zhao et al. 2013). Un indice d’occupation a ensuite été estimé pour chacune des espèces dans un paysage de 90 000 km2 de la région de la Côte-Nord, où le plan de rétablissement du caribou forestier est mis en œuvre. Trois scénarios d’aménagement contrastaient deux configurations spatiales des parterres de coupe, soit l’agglomération et la dispersion, et deux cycles de rotation de coupe, soit de 60 et 100 ans. L’indice de Jaccard a permis de comparer la similarité dans les assemblages d’espèces d’oiseaux entre les scénarios de coupe et un paysage sans coupe forestière.
CHAPITRE PRINCIPAL
Can habitat management for threatened forest-dwelling caribou preserve
biodiversity in boreal ecosystems?
ORPHÉ BICHET1, ANGÉLIQUE DUPUCH2, CHRISTIAN HÉBERT3 and DANIEL FORTIN1
1 NSERC-Université Laval industrial research chair in silviculture and wildlife,
Département de biologie, Université Laval, Québec, QC GIV 0A6, Canada E-mail: orphe.bichet.1@ulaval.ca
Phone: +1 418 656-2131 ext. 2917/Fax: +1 418 656-2043
2 ISFORT-Institut des Sciences de la Forêt Tempérée, Département des sciences naturelles,
Université du Québec en Outaouais, Ripon, Québec, Canada J0V 1V0
3 Laurentian Forestry Centre, Canadian Forest Service, Natural Resources Canada, P.O.
10
Résumé
La protection ou le rétablissement d’une espèce à grand domaine vital nécessite souvent l’aménagement de son habitat sur de grandes superficies. Les stratégies d’aménagement basées sur une seule espèce peuvent toutefois influencer non seulement l’espèce cible mais également un grand nombre d’espèces de l’écosystème. En forêt boréale de l’est du Canada, l’aménagement de l’habitat pour le rétablissement du caribou forestier (Rangifer tarandus) recommande l’agglomération des parterres de coupe, la protection temporaire de massifs de forêt mature et l’instauration d’une rotation entre les agglomérations de coupes et les massifs de protection. Les conséquences de cette stratégie sur la biodiversité sont inconnues. Cette étude visait à évaluer comment la diversité de la faune aviaire serait affectée par divers scénarios d’aménagement de l’habitat du caribou. Sept paysages ont été simulés dans une région de vieilles forêts afin de contraster l’influence de la répartition spatiale des parterres de coupe et du temps de rotation entre les agglomérations de coupes et les massifs de protection. Les oiseaux ont été inventoriés au moyen de 630 points d’écoute répartis le long d’un gradient de succession forestière après coupe et après feu. Des modèles de probabilité d’occurrence ont été développés pour 29 espèces en fonction des caractéristiques de l’habitat à l’échelle du peuplement et de la matrice environnante (rayon de 1 km). Un indice d’occupation du paysage par espèce a été comparé entre les scénarios simulés. Les différences d‘assemblage d’oiseaux attendus entre un paysage coupé et non-coupé étaient similaires que les coupes soient agglomérées ou dispersées dans le paysage. D’autre part, un temps de rotation plus court accentuait ces différences entre les assemblages d’espèces. Spécifiquement, les espèces associées aux forêts matures déclinaient plus fortement après une rotation de 60 ans qu’une de 100 ans. De plus, l’indice d’occupation de la plupart des espèces, indépendamment de leur préférence d’habitat, était plus élevé après un cycle de 100 ans. Nos résultats indiquent que l’aménagement de l’habitat du caribou actuellement préconisé ne suffirait pas à atténuer les effets des modifications anthropiques du paysage associées à la coupe sur la diversité aviaire. Ainsi, notre méthodologie, basée sur la probabilité d’occurrence et les assemblages d’espèces, permet l’évaluation des effets au long terme sur la biodiversité de différents plans d’aménagement avant leur mise en œuvre.
Abstract
Protection or recovery of species with large home ranges often involves broad-scale habitat management. Single-species management strategies, however, may not only influence the target species, but also multiple co-occurring species. In Eastern-Canadian boreal forests, habitat management for the recovery of the threatened boreal woodland caribou (Rangifer tarandus) consists in aggregating cut-blocks and applying a rotation between spatially aggregated cut-blocks and temporary protected forest blocks. Long-term consequences of this single-species strategy on boreal biodiversity remain unknown. This study aimed to assess how boreal bird diversity would be affected under different management scenarios. Seven landscapes were simulated in a region dominated by old-growth boreal forests, varying in cut stands distribution and harvest rotations. Birds were sampled at 630 point-count stations along post-harvest and post-fire forest successions. An index of occupancy was estimated for 29 bird species as a function of the characteristics of the stands and their surroundings (1-km radius buffer) and compared across the simulated landscapes. Bird assemblages differed similarly from communities expected in an uncut landscape whether cut stands were dispersed or aggregated. Shorter harvest revolution, however, deepened differences between species assemblages found in logged and uncut landscape. Differences mainly lied in the stronger decline of old-growth forest specialists under a 60-year than a 100-year cycle. Furthermore, most species, regardless of their habitat association, had higher occupancy index after the longest harvest revolution. Results suggest that the current habitat management guidelines for boreal caribou recovery would not be sufficient to mitigate long-term effects of human-induced habitat modifications linked to timber harvesting on bird diversity. Our quantitative approach, based on species probability of occurrence and species assemblages, allows for prior-implementation assessment of the long-term impact of various management strategies on biodiversity.
12
Introduction
One of the main contemporary challenges in conservation biology is to preserve biodiversity despite the increasing impact that humans have on wildlife habitats. Over the last few decades, human-induced habitat modifications in natural ecosystems have led to a substantial loss of biodiversity (Foley et al. 2005; Fahrig 2013). Activities such as logging, agriculture, or urbanisation impact a variety of animal taxa, from invertebrates to large mammals (Imbeau et al. 2001; Fortin et al. 2010; Batáry et al. 2012). Species that are rare and specialised to a particular habitat composition or structure tend to decline in human-disturbed ecosystems (Gibbon et al. 2000; Imbeau et al. 2001; Fortin et al. 2010), while common and generalist species increase in number (Schmiegelow & Mönkkönen 2002). When ubiquitous species become more abundant and rare species decline or disappear, species assemblages homogenise across the landscape (McKinney & Lockwood 1999). Biodiversity loss and homogenisation of communities, driven by human activities, consequently affect ecosystem integrity (Drapeau et al. 2000; Olden et al. 2004) and resilience to further environmental changes (Folke et al. 2004).
Several strategies have been proposed to preserve biodiversity while ensuring human activities continuity (Lindenmayer et al. 2006). Many researchers recommend habitat-based approaches, such as maintaining availability of particular habitat types above specific thresholds (Drapeau et al. 2009a; Rompré et al. 2010), connectivity among habitat patches (Lindenmayer et al. 2006), or keeping anthropogenic disturbances within the range of variability observed under natural disturbance regime (Lindenmayer et al. 2006; Gauthier et al. 2008). Management strategies developed for a single species or taxon have also been widely applied in various settings (Simberloff 1998; Roberge & Angelstam 2004; Froese et al. 2008). Single-species strategies are useful shortcuts for land management as one species can be monitored while serving as surrogate for preserving all other species and maintaining ecosystem functions. Various criteria have been developed to help identify target species for conservation actions. These criteria include the target species conservation concern (Simberloff, 1998; Rubinoff, 2000), its charisma for conservation campaigns (Leader-Williams & Dublin 2000), its role as keystone species ensuring the integrity of ecosystem functioning (Sergio et al. 2008), and whether its monitoring is already established (e.g. harvested species, Roberge & Angelstam, 2004; Froese et al.
2008) or is needed (e.g. pest species, Bax et al. 2003). The umbrella species concept is a single-species strategy defined as the protection of a species requiring large areas or specific habitat attributes that would ensure conservation of many co-occurring species (Roberge & Angelstam 2004). Single-species approaches, however, have often been criticised for their poor efficiency in maintaining biodiversity in managed landscapes (Roberge & Angelstam 2004), as they are more likely to help preserve species with similar habitat requirements or living within the same area (Roberge & Angelstam 2004; Hurme et al. 2008; Roberge et al. 2008). As an efficient management strategy should conserve all species of an ecosystem, it is crucial to assess the effect of such strategies on biodiversity prior to implementation.
Boreal caribou (Rangifer tarandus) is a forest-dwelling large herbivore that has several characteristics making it a good candidate as an umbrella species for boreal biodiversity conservation. First, annual home ranges of caribou vary from 200 to 1,500 km2
(Faille et al. 2010) and can extend to more than 4,000 km2 in disturbed landscapes (Brown
et al. 2011). Most boreal wildlife species have much smaller home ranges (Swihart et al. 1988). Boreal caribou tend to select mature conifer forest and open lichen woodlands (Courbin et al. 2009; Hins et al. 2009; Moreau et al. 2012), which are also targeted for harvest. Secondly, caribou avoid cut-blocks and roads (Hins et al. 2009; Fortin et al. 2013) making the species particularly sensitive to logging-related habitat changes.
Because the boreal woodland caribou is threatened in Canada (Thomas & Gray 2002), the Canadian government as well as many provincial governments have developed strategies for population recovery (Ontario Woodland Caribou Recovery Team 2005; Environnement Canada 2011; Équipe de rétablissement du caribou forestier au Québec 2013). In the province of Québec, the strategy involves aggregating cut-blocks and establishing a network of temporary protection blocks (Équipe de rétablissement du caribou forestier au Québec 2013). Protection blocks should be at least 250 km2 (ideally >1,000 km2), include land cover types favoured by boreal caribou, and exclude human activities (Courtois et al. 2004; Équipe de rétablissement du caribou forestier au Québec 2013).
The long-term impact of the caribou recovery strategy on boreal biodiversity is currently unknown. In fact, few studies have evaluated the long-term impacts of logging
14
activities on boreal forest biodiversity (Imbeau et al. 2001; Keller et al. 2003; Palladini et al. 2007; Azeria et al. 2009). Logging alters forest cover and age structure, as well as habitat type distribution and configuration (Bergeron et al. 2002; Bouchard & Pothier 2011), thereby influencing habitat quality for many animal species (Drolet et al. 1999; Drapeau et al. 2000; Imbeau et al. 2001; Schmiegelow & Mönkkönen 2002; Zhao et al. 2013). The management plans for the recovery of woodland caribou recommends the establishment of a rotation between cut-aggregation and temporary protection blocks (Équipe de rétablissement du caribou forestier au Québec 2013). Current guidelines allow for a 60-year harvest rotation to be implemented. In a forest ecosystem naturally disturbed by a long fire cycle (>250 years), a 60-year harvest cycle would decrease mean forest age (Bouchard et al. 2008; Bouchard & Pothier 2011) and reduce landscape heterogeneity (Angers et al. 2005). Responses of animal species to landscape-scale habitat changes are complex and variable (Villard et al. 1999; Drapeau et al. 2000; Baker et al. 2013) but concern has been raised about biotic homogenisation of the boreal fauna as a result of harvesting (McKinney & Lockwood 1999).
Our objective was to assess how the recovery strategy of boreal caribou populations in a region dominated by old-growth forests would affect bird diversity by simulating forest landscapes varying in cut-block distribution and harvest rotations. Birds were chosen as indicators to measure biodiversity response to environmental changes (Freedman et al. 1994; Gregory 2006; Gregory & Strien 2010). We first modelled probability of occurrence of individual bird species as a function of time since last disturbance and characteristics of the surrounding landscape matrix. These models were then used to predict bird diversity over 90,000 km2 of boreal forest in a region currently harvested following the proposed caribou recovery strategy. Bird diversity was estimated in landscapes under two harvest rotation times (60-year and 100-year), as well as two different spatial configurations of cut blocks (aggregated and dispersed). By comparing bird diversity expected in harvested and uncut landscapes, we were able to assess the effects of different implementations of a single-species management on regional biodiversity conservation.
Methods
STUDY AREA
The study took place in the eastern spruce-moss sub-domain of the boreal forest on the Côte-Nord region of Québec, Canada. The area is characterised by rolling hills of 300 to 1,000 m high influenced by a marine climate, with abundant precipitation (900-1,300 mm annually) and mean annual temperatures varying between -1.0 and 2.5 °C. Dominant tree species are black spruce (Picea mariana) and basalm fir (Abies balsamea). White spruce (Picea glauca), white birch (Betula papyrifera), trembling aspen (Populus tremuloides), jack pine (Pinus banksiana) and larch (Larix laricina) are also present. The long fire cycle, between 270 and >500 years, explains the large proportion (70%) of irregular old-growth forest stands found in this region. Forest harvesting began in mid-twentieth century along the Saint-Lawrence river shores and is now the main forest disturbance in the southern part of the study area (Bouchard & Pothier 2011). In the northern part, wildfires remain the principal forest disturbance, although insect outbreaks and windthrows also occur (Bouchard & Pothier 2011). In the southern part of the study area, clear-cutting was mainly used until 1996 when careful logging was implemented. Careful logging consists of only harvesting trees with a diameter at breast height (DBH) >9 cm while protecting soils and regeneration (Groot et al. 2005). The landscape mosaic is thus composed of variously aged post-logging and post-fire forest stands (Bouchard & Pothier 2011).
MANAGEMENT SCENARIOS
We simulated seven landscapes across 90,000 km2 of the Côte-Nord region where the
boreal caribou recovery strategy is presently implemented (Fig. 1). The first landscape (L2012) corresponded to the observed situation in 2012. Two scenarios (four landscapes)
contrasted 60-year and 100-year harvest revolutions. Landscapes were generated by altering L2012 at potential locations of cut-blocks and temporary protection blocks,
according to the basic guidelines of the caribou recovery strategy. The age structure and composition of the landscape matrix surrounding cut-blocks and protection blocks were conserved as in L2012, because most of this part of the boreal forest had never been
16
harvested. The fire cycle exceeding 270 years (Bouchard et al. 2008), we thus assumed the forest dynamic had reached equilibrium in the unmanaged portion of the landscape, i.e. the age distribution of forest stands would not change over time. Cut-blocks and temporary protection blocks represented 13% of the landscape. Within blocks, two harvest revolutions were simulated: first, cut-blocks were completely logged over nine years between 2072 and 2081 in the 60-year cycle scenario (L60y-cycle:Y2081) and between 2112 and 2121 in the
100-year cycle scenario (L100y-cycle:Y2121); second, former protection blocks were harvested in the
same way 60 (L60y-cycle:Y2141) and 100 years (L100y-cycle:Y2221) later, for each scenario
respectively. Blocks logged during the first harvest were assumed to regenerate into conifer-dominated forest stands so as to become protection blocks by the second harvest (Fig. 1). As annual harvest rates vary, we considered that logging only took place during the last nine years of each harvest time interval. Accordingly, recent cut-blocks were <10 years old in harvested scenarios. To assess the effect of the duration of a harvest cycle on bird diversity, landscapes were only compared after a full harvest revolution between harvest and protection blocks.
In parallel, we simulated a landscape harvested without following the woodland caribou recovery guidelines (Lnoplan:Y2121). We modelled northward road network expansion
from roads present in L2012 and placed cut stands along it over a 9 years period, from 2112
to 2121. Total harvested area added up to 13% of the landscape, which was equivalent to the proportion of forest stands logged within blocks in L100y-cycle:Y2121. The proportions of
the various land cover types were similar in both the aggregated-cut (L100y-cycle:Y2121) and the
dispersed-cut (Lnoplan:Y2121) landscapes, so we were able to isolate the effect of spatial
distribution of cut-blocks on bird assemblages.
Finally, a landscape without logging activities (Luncut) was simulated converting all
cut stands found in L2012 back to old-growth forest. Road area was not considered in the
Figure 1. Forest age distribution in different management scenarios simulated across 90,000 km2 of the Côte-Nord region in Québec, Canada. Three scenarios generated from
the observed 2012 landscape (L2012) contrasted a) a 60-year and b) a 100-year harvest
18
aggregation. An uncut landscape disturbed only by natural events served as reference
(Luncut).
BIRD SAMPLING
Birds were surveyed along a gradient of post-harvest and post-fire forest succession stands ranging in age from 0 to 201 years old. Bird species presence was recorded at 630 conifer-dominated stands over six summers from 2004 to 2011, using 10-min point-count surveys. Each sampling station was visited twice during the breeding season (early June to early July), between 05:00 and 10:00. All individuals seen or heard within a 50 m radius during 10 min were recorded. A species was coded as present if it was detected at least once during the two visits. To minimise observer and time bias, each point count station was surveyed by different observers and at different times of the morning. Point-count stations were located at least 100 m from stand edges or major water bodies, and were at least 150 m from each other.
MODELLING BIRD SPECIES OCCURRENCE PROBABILITY
We modelled the probability of occurrence of every bird species recorded at more than 5% of point-count stations (Appendix 1) with mixed-effect logistic regression in the lme4 package of the R software (Bates et al. 2011; R Development Core Team 2012). Species occurrence probabilities were modelled as a function of the characteristics of the stand and the surrounding matrix (1-km buffer), identified from digital eco-forest maps updated every year from information provided by the local forest companies and verified during sampling (Table 1). Sampling year was included as random effect.
Models were built by first including an interaction between stand age, as a continuous variable, and disturbance type (dichotomous variable: careful logging versus fire). Stand age was log-transformed or squared when the relationship with a bird species presence/absence data was not linear. When significant, the interaction between disturbance type and stand age was kept in the model because all surveyed harvested stands were <70 years old while burned stands were >60 years old. We then added landscape variables to
the model (Table 1). Conifer-dominated forest stands from 0 to 100 years old were classified into 10-year age categories and stands older than 100 years were classified into old-growth forest (Bergeron et al. 2006). Proportion cover of each age category was calculated within a 1-km radius buffer around each sampling point (Zhao et al. 2013). Consecutive age categories that showed significant (p ≤ 0.05) were grouped according to bird species-specific model estimate values. Significant interactions between stand age at the sampling points and the proportion cover of age groups were also included in the models. Finally, Shannon’s diversity index (Shannon & Weaver 1949) was included in the models to characterise landscape heterogeneity. This index was calculated with the number and relative proportions of land cover types in the 1-km radius buffer. Land cover types included the 10-year age categories previously retained in species-specific models (conifer-dominated forests), as well as deciduous and deciduous-(conifer-dominated mixed forests, and non-forested areas (i.e. water bodies, peatland and bare ground). An index value of 0 indicated a homogeneous landscape with only one land cover type in the 1-km radius buffer. A higher SHDI value indicates a more heterogeneous landscape.
Table 1. Description of stand- and landscape scale variables used to build bird species occurrence probability models.
Variables Description
Age Stand age at sampling site location
Disturb Last disturbance type that occurred on sample stand (careful logging or wildfire)
Prop_0_9 Proportion of conifer-dominated stands disturbed 0 to 9 years ago in a 1-km radius buffer
Prop_10_19 Proportion of conifer-dominated stands disturbed 10 to 19 years ago in a 1-km radius buffer
Prop_20_29 Proportion of conifer-dominated stands disturbed 20 to 29 years ago in a 1-km radius buffer
Prop_30_39 Proportion of conifer-dominated stands disturbed 30 to 39 years ago in a 1-km radius buffer
Prop_40_49 Proportion of conifer-dominated stands disturbed 40 to 49 years ago in a 1-km radius buffer
Prop_50_59 Proportion of conifer-dominated stands disturbed 50 to 59 years ago in a 1-km radius buffer
Prop_60_69 Proportion of conifer-dominated stands disturbed 60 to 69 years ago in a 1-km radius buffer
20
Prop_70_79 Proportion of conifer-dominated stands disturbed 70 to 79 years ago in a 1-km radius buffer
Prop_80_89 Proportion of conifer-dominated stands disturbed 80 to 89 years ago in a 1-km radius buffer
Prop_90_100 Proportion of conifer-dominated stands disturbed 90 to 100 years ago in a 1-km radius buffer
Prop_OGF Proportion of old-growth forest (>100 years since last disturbance) in a 1-km radius buffer
Deciduous Proportion of mixed to deciduous-dominated forest in a 1-km radius buffer Other Proportion of other non-forested landscape types in a 1-km radius buffer
(water bodies, peatland, bare ground) SHDI Shannon’s index of landscape heterogeneity
0 : homogeneous landscape ; >0 : the higher the value the more heterogeneous the landscape
For each individual bird species, we only included stand- and landscape-scale variables with p ≤ 0.05, and retained models for which we obtained an area under the curve (AUC) of 0.7 or above (Hosmer et al. 2013) (Table 2). Models for three species did not meet satisfactory prediction accuracy (AUC < 0.54) and were thus discarded from further analysis. We predicted the probability of occurrence of species s (ps) for every pixel i (25 ×
25 m) of each of the seven landscapes, as a function of characteristics of the stand and the surrounding matrix (1-km radius buffer), with the raster package of R (Hijmans & van Etten 2012; R Development Core Team 2012). An index of a species occupancy, Ps, was
estimated for a given scenario by first summing the log-transformed probabilities ps of all
pixels of the landscape, then dividing the sum by the total number of pixels in the landscape (Ps = (Σlog[psi + 1]) / 143,941,128). Values of Ps varied between 0, indicating complete
absence of the species in the landscape, and 0.69 indicating the highest occurrence probability of the species in each pixel of the landscape.
We evaluated the percent change in Ps between managed landscapes and the uncut
landscape following: [(Ps - Ps (Luncut)) / Ps (Luncut))]×100, where Ps is the occupancy index of
species s in a given managed landscape, and Ps (Luncut) the occupancy index of species s in
Luncut (Table 4).
We then computed the Jaccard similary index (JSI) (Jaccard 1908; Rahel 2000) on occupancy indices to assess the similarity in bird assemblages across the simulated management scenarios. JSI was calculated following the equation 1 - ( 2×B / (1 + B)),
where B is the Bray-Curtis dissimilarity index determined from the relationship Bjk = Σ|( Psj
- Psk)| / Σ(Psj + Psk) where Psj and Psk refer to the mean probability of occurrence of a
species s in landscapes j and k (Oksanen et al. 2012).
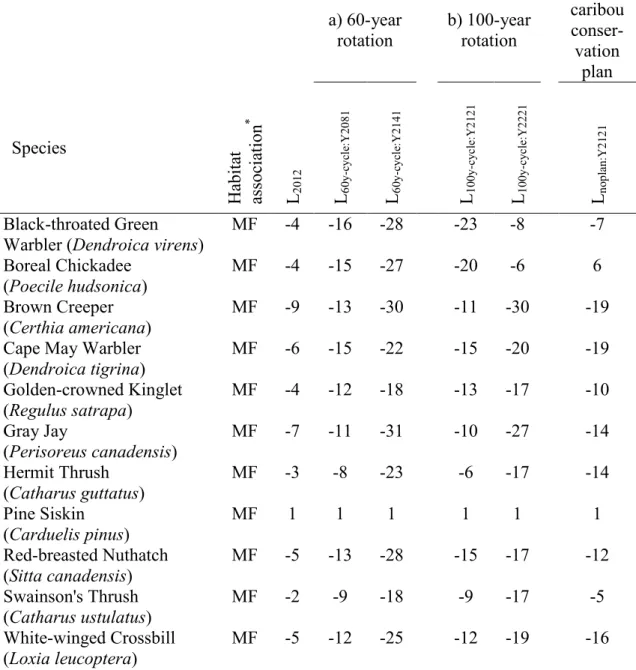
Table 2. Summary of the best mixed logistic regression models (N = 630 sampling sites) predicting probability of occurrence ps of bird species s, calculated as ps = exp(w(x)) / [1 +
exp(w(x))] (logit link) or as ps = 1 – exp(-exp(w(x)) (cloglog link), with associated area
under curve (AUC). Probability was calculated according to continuous stand age, disturbance type (harvest or wildfire), proportion of conifer forest of different age classes in a 1-km radius buffer, Shannon’s index of landscape heterogeneity (conifer forest age classes, mixed/deciduous forest, non-forested areas) in a 1-km buffer and interactions between stand age and proportion of various conifer forest age classes.
Species Model AUC
Alder Flycatcher w(x) = 2.00 - 0.36 Ln(Age) - 3.06 Prop_20_OGF -
1.13 SHDI 0.8
American Goldfinch w(x) = 11.36 - 3.23 Ln(Age) × Disturb + 1.38
SHDI 0.7
American Robin w(x) = -0.84 - 0.004 Age - 1.19 Prop_20_59 - 0.02
Age × Prop_0_9 0.7 Bay-breasted Warbler w(x) = -19.09 + 2.89 Ln(Age) × Disturb + 3.67
Prop_0_79 + 1.30 SHDI 0.8 Black-throated Green
Warbler w(x) = -6.06 + 0.02 Age + 7.26 Prop_80_OGF - 0.05 Age × Prop_80_OGF 0.7 Boreal Chickadee w(x) = -0.43 - 7.45E-05 Age2 - 2.58 Prop_0_79 0.7
Brown Creeper w(x) = -4.00 + 2.43 Prop_OGF 0.8 Cape May Warbler w(x) = -2.65 - 8.27 Prop_0_19 0.8 Dark-eyed Junco w(x) = -0.97 + 0.25 Ln(Age) + 0.15 Ln(Age)2 -
1.18 Prop_20_79 - 0.35 SHDI 0.7 Golden-crowned Kinglet w(x) = -5.31 + 0.83 Ln(Age) + 6.10 Prop_60_OGF
- 1.20 Ln(Age) × Prop_60_OGF 0.7 Gray Jay w(x) = -3.00 + 2.61 Prop_OGF + 1.03 SHDI 0.8 Hermit Thrush w(x) = -0.85 + 0.0001 Age2 - 2.54 Prop_0_9 - 1.05
Prop_OGF 0.7
Least Flycatcher w(x) = -3.88 + 2.19 Age2 - 7.05 Prop_0_19 + 2.27
SHDI 0.8
Lincoln's Sparrow w(x) = -2.22 - 0.29 Ln(Age) + 2.95 Prop_0_19 0.8 Magnolia Warbler w(x) = -0.44 + 0.10 Ln(Age)2 - 0.63 Prop_OGF 0.7
22
Age × Prop_60_79 + 1.99 Prop_80_100
Northern Waterthrush w(x) = -3.75 - 2.09 Prop_OGF + 2.07 SHDI 0.8 Pine Siskin w(x) = -3.37 + 1.95 Prop_50_59 0.8 Red-breasted Nuthatch w(x) = -5.66 + 1.15 Ln(Age) - 1.38 Prop_0_79 +
8.65 Prop_80_OGF - 1.94 Ln(Age) × Prop_80_OGF
0.7 Red-eyed Vireo w(x) = -7.55 + 3.74 Prop_20_79 + 3.18 SHDI 0.9 Ruby-crowned Kinglet w(x) = 0.79 - 4.73E-05 Age2 - 0.67 Prop_60_79 -
0.65 SHDI 0.7
Swainson's Thrush w(x) = -2.39 + 0.44 Ln(Age) + 5.37 Prop_OGF -
0.97 Ln(Age) × Prop_OGF 0.7 Tennessee Warbler w(x) = -1.07 + 1.64 Prop_20_79 - 0.92
Prop_80_OGF 0.8 White-throated Sparrow w(x) = 1.07 - 0.16 Ln(Age) + 1.26 Prop_0_19 0.7 White-winged Crossbill w(x) = -5.21 + 0.69 Ln(Age) + 0.25 Ln(Age)2 -
2.73 Prop_0_79 0.8 Wilson's Warbler w(x) = -1.77 - 2.81 Prop_OGF 0.7 Winter Wren w(x) = -2.51 + 0.39 Ln(Age) + 0.12 Ln(Age)2 +
1.19 Prop_0_9 - 0.89 Prop_60_79 + 0.66 Prop_OGF
0.7 Yellow-bellied
Flycatcher w(x) = -3.36 + 0.27 Ln(Age) + 1.15 Prop_0_19 0.7 Yellow-rumped Warbler w(x) = 0.26 - 1.83 Prop_0_79 0.8 Age: stand age, Disturb: disturbance type, Prop_X: proportion of age class X in a 1-km radius buffer, OGF: proportion of old-growth forest (>100 years) in a 1-km radius buffer, SHDI: Shannon’s diversity index.
Results
EFFECT OF CUT AGGREGATION ON BIRD DIVERSITY
A total of 12,779 individual birds from 81 species were recorded at the 630 point-count stations over six years. Among the 29 species included in the analysis, 13 were associated with old-growth forests, 10 with young forests to mid-succession stages forests, two with early-succession stages, two were generalist species and two were associated to riparian or deciduous areas. The probability of occurrence of 20 species was significantly influenced by stand age, and only two species, the Bay-breasted Warbler (Dendroica castanea) and the American Golfinch (Carduelis tristis), were influenced by both stand age and stand origin (logging or wildfire) (Table 2). All 29 modelled species were influenced by landscape age
composition (Table 2). Ten species were further influenced by landscape heterogeneity within a 1-km radius buffer (SHDI; Table 2).
In 2012 (L2012), old-growth forest covered 55% of the landscape. Post-logging
regeneration (≤ 60 years after harvest) represented 5% of the area, whereas remaining forest stands younger than 100 years old originated from wildfire (Table 3). In the uncut landscape (Luncut) old-growth forest covered 60% of the study area (Table 3).
Table 3. Description and percentage cover of the land cover types comprised in the 2012 landscape, together with six landscapes simulated in the Côte-Nord region of Québec, Canada. Scenario a) 60-year rotation b) 100-year rotation c) No caribou conservation plan Landscape Lun cu t L20 12 L60 y-cy cl e: Y 20 81 L60 y-cy cl e: Y 21 41 L10 0y -c yc le :Y 21 21 L10 0y -c yc le :Y 22 21 Lno pl an :Y 21 21 Early-succession (0-9 yo) 1 1 9 13 9 13 9 Young forest (10-59 yo) 10 15 11 11 11 11 11 Mid-succession (60-79 yo) 4 4 3 11 3 3 3 Mature forest (80-100 yo) 4 4 4 3 3 11 3 Old-growth forest (>100 yo) 60 55 52 41 53 41 53 Mixed and deciduous forest 4 4 4 4 4 4 4 Other land cover types 17 17 17 17 17 17 17 Total 100 100 100 100 100 100 100 Total harvest area 0 5 13 26 13 26 13
Luncut: Landscape without harvest, L2012: Actual landscape in 2012, L60y-cycle:Y2081:
Landscape after a first round of harvest 60 years from 2012, L60y-cycle:Y2141: Landscape after
a second round of harvest 60 years from 2072, L100y-cycle:Y2121: Landscape after a first round
of harvest 100 years from 2012, L100y-cycle:Y2221: Landscape after a second round of harvest
100 years from 2112, Lnoplan:Y2121: Landscape harvested without cut aggregation or block
rotation.
Bird assemblages in the harvested landscape (L2012) were similar to assemblages
24
between the uncut (Luncut) and the harvested (L2012) landscapes were relatively low for most
species (Table 5). The strongest changes indicated relatively higher occupancy in L2012 for
generalist species and species associated with early-succession stages and young forests (Table 5).
Table 4. Jaccard similarity index between bird assemblages expected in the uncut (Luncut)
and the harvested landscapes, including the number of species for which the probability of occurrence increased or declined with harvest. Bird species were classified according to habitat association.
Scenario Landscape Tendency Habitat association
*
MF YF/ MF YF OH DF G Total JSI R/ L2012 decline increase 12 1 0 3 2 1 0 1 5 1 2 1 16 0.96 13
a) 60-year rotation
L60y-cycle:Y2081 decline increase 12 1 1 2 2 0 0 1 5 2 2 1 16 0.90 13
L60y-cycle:Y2141 decline increase 12 1 1 2 3 1 0 1 4 1 2 1 18 0.81 13
b) 100-year rotation
L100y-cycle:Y2121 decline increase 12 1 0 3 3 0 0 1 4 2 2 1 16 0.90 13
L100y-cycle:Y2221 decline increase 12 1 1 2 2 0 0 1 5 2 2 1 16 0.84 13
c) No caribou
conservation plan Lnoplan:Y2121
decline 11 0 2 0 0 1 14
0.89 increase 2 3 5 2 2 1 15
* From The Cornell Lab of Ornithology (http://www.birds.cornell.edu)
MF: mature and old-growth forest, YF: young forest, OH: open habitat, R: riparian area, DF: deciduous forest, G: generalist species, JSI: Jaccard similarity index.
Old-growth forests were reduced to 53% of the area in both the landscapes with aggregated (L100y-cycle:Y2121) and with dispersed (Lnoplan:Y2121) cuts (Table 3). Bird
assemblages in both harvest design differed similarly from assemblages found in the uncut landscape (Luncut) (JSI = 0.90 in L100y-cycle:Y2121, and 0.89 in Lnoplan:Y2121; Table 4). Whereas 6
out of the 13 mature-forest bird species showed a stronger decline when cut-blocks were dispersed (Lnoplan:Y2121) rather than aggregated (L100y-cycle:Y2121), the inverse was true for five
index in L100y-cycle:Y2121 than in Lnoplan:Y2121, the opposite was predicted for generalist
species, those favouring habitat heterogeneity (positive estimate for SHDI, Table 2) and most species associated with young forests (Table 5).
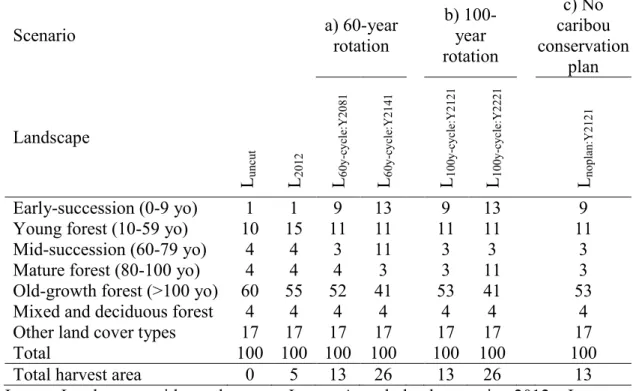
Table 5. Percent change in the index of occupancy (Ps) for 29 bird species between the
uncut landscape (Luncut) and six harvested landscapes expected under three management
scenarios (a-c) over 90,000 km2 of eastern Canada boreal forest. Bird species were
classified according to habitat association.
a) 60-year
rotation b) 100-year rotation
c) No caribou conser-vation plan Species H ab itat as so ci at io n * L20 12 L60 y-cy cl e: Y 20 81 L60 y-cy cl e: Y 21 41 L10 0y -c yc le :Y 21 21 L10 0y -c yc le :Y 22 21 Lno pl an :Y 21 21 Black-throated Green
Warbler (Dendroica virens) MF -4 -16 -28 -23 -8 -7 Boreal Chickadee
(Poecile hudsonica) MF -4 -15 -27 -20 -6 6 Brown Creeper
(Certhia americana) MF -9 -13 -30 -11 -30 -19 Cape May Warbler
(Dendroica tigrina) MF -6 -15 -22 -15 -20 -19 Golden-crowned Kinglet (Regulus satrapa) MF -4 -12 -18 -13 -17 -10 Gray Jay (Perisoreus canadensis) MF -7 -11 -31 -10 -27 -14 Hermit Thrush (Catharus guttatus) MF -3 -8 -23 -6 -17 -14 Pine Siskin (Carduelis pinus) MF 1 1 1 1 1 1 Red-breasted Nuthatch (Sitta canadensis) MF -5 -13 -28 -15 -17 -12 Swainson's Thrush (Catharus ustulatus) MF -2 -9 -18 -9 -17 -5 White-winged Crossbill (Loxia leucoptera) MF -5 -12 -25 -12 -19 -16
26 Winter Wren (Troglodytes hiemalis) MF -2 -8 -19 -8 -13 -7 Yellow-rumped Warbler (Dendroica coronata) MF -4 -7 -24 -7 -10 -7 Bay-breasted Warbler
(Dendroica castanea) YF, MF 22 50 14 76 8 61 Ruby-crowned Kinglet
(Regulus calendula) YF, MF 2 0 11 -4 9 9 Yellow-bellied Flycatcher
(Empidonax flaviventris) YF, MF 0 0 -15 1 -2 3 Alder Flycatcher (Empidonax alnorum) YF 14 90 31 89 147 102 Least Flycatcher (Empidonax minimus) YF -8 -12 -32 -9 -27 -23 Lincoln's Sparrow (Melospiza lincolnii) YF 22 155 64 154 256 103 Magnolia Warbler (Dendroica magnolia) YF -1 -4 -7 -4 -6 -4 Nashville Warbler (Vermivora ruficapilla) YF 1 0 -22 -2 16 2 Tennessee Warbler (Oreothlypis peregrina) YF 8 6 9 5 9 9 Wilson's Warbler (Wilsonia pusilla) YF 12 21 56 19 56 22 American Goldfinch (Carduelis tristis) OH 92 57 57 133 144 141 American Robin (Turdus migratorius) OH 4 -10 -10 -1 11 6 Northern Waterthrush (Seiurus noveboracensis) R 30 38 25 36 53 55 Red-eyed Vireo (Vireo olivaceus) DF 46 34 61 31 30 36 Dark-eyed Junco (Junco hyemalis) G -1 -7 -18 -7 -10 -4 White-throated Sparrow (Zonotrichia albicollis) G 1 3 6 3 5 8
* From The Cornell Lab of Ornithology (http://www.birds.cornell.edu)
MF: mature and old-growth forest, YF: young forest, OH: open habitat, R: riparian area, DF: deciduous forest, G: generalist species.
EFFECT OF HARVEST ROTATION CYCLE ON BIRD DIVERSITY
The first round of harvest expanded the logged area from 5 to 13% of the landscape, through the addition of recent cuts within harvest blocks for both scenarios L60y-cycle:Y2081
andL100y-cycle:Y2121 (Table 3). Because the surrounding matrix was left unchanged and only
protection blocks aged from 2012, landscapes were rather similar 60 years or 100 years after harvest (L60y-cycle:Y2081 andL100y-cycle:Y2121, respectively). The loss of old-growth forest
to logging was partially compensated by fire-originated stands aging to at least 100 years old (5-6% of the landscape). Aging of burnt stands within protection blocks also decreased the proportion of the landscape covered by young forests from 14% in L2012 to 11% after a
first harvest round (Table 3). Similarities in the landscapes 60 years and 100 years after logging were reflected in the equal similarity of bird assemblages predicted for L
60y-cycle:Y2081 andL100y-cycle:Y2121, ascompared to Luncut (JSI = 0.88, Table 4).
In the second round of harvest (L60y-cycle:Y2141 and L100y-cycle:Y2221), the former
protection blocks were cut, increasing logged area from 13 to 26% of the landscape, and reducing old-growth forest from 52-53% to 41% (Table 3). In the 60-year rotation cycle scenario, blocks harvested in 2081 were left to regenerate over the next 60 years, thereby increasing mid-succession forests from 4% in L60y-cycle:Y2081 to almost 11% in L60y-cycle:Y2141
(Table 3). Under a 100-year harvest cycle, harvested blocks regenerated to become 100 years old forests, increasing the percent of mature forest in the landscape from 3% in L
100y-cycle:Y2121 to 11% in L100y-cycle:Y2221 (Table 3).
A 60-year harvest rotation compared to a 100-year rotation slightly increased the differences in species assemblages between logged and unlogged landscapes. Indeed JSI decreased from 0.90 after a first round of harvest (L60y-cycle:Y2081 andL100y-cycle:Y2121) to 0.81
following the second round under a 60-year harvest cycle (L60y-cycle:Y2141) and to 0.84 under
a 100-year rotation (L100y-cycle:Y2121) (Table 4). Most mature forest specialists became
increasingly less likely to be present in a landscape as logged area increased (Table 4), and their decline was stronger under a 60-year (L60y-cycle:Y2141) than a 100-year (L100y-cycle:Y2221)
rotation cycle (Table 5). Indeed, percent change in occupancy index of 11 out the 13 modelled mature-forest species was higher between the uncut landscape (Luncut) and L
![Table 2. Summary of the best mixed logistic regression models (N = 630 sampling sites) predicting probability of occurrence p s of bird species s, calculated as p s = exp(w(x)) / [1 + exp(w(x))] (logit link) or as p s = 1 – exp(-exp(w(x)) (cloglog l](https://thumb-eu.123doks.com/thumbv2/123doknet/6887155.193382/41.918.156.826.510.1073/summary-logistic-regression-sampling-predicting-probability-occurrence-calculated.webp)