O
pen
A
rchive
T
OULOUSE
A
rchive
O
uverte (
OATAO
)
OATAO is an open access repository that collects the work of Toulouse researchers and
makes it freely available over the web where possible.
This is an author's version published in :
http://oatao.univ-toulouse.fr/
Eprints ID : 4158
To cite this document : Teles dos Santos, Moises and Carrillo Le
Roux, Galo and Gerbaud, Vincent ( 2010) Computer-Aided Lipid
Design: phase equilibrium modeling for product design. In:
ESCAPE 20, 20th European Symposium on Computer-Aided
Process Engineering (ESCAPE 19), 06-10 June 2010, Ischia, Italy
Any correspondance concerning this service should be sent to the repository
administrator: staff-oatao@inp-toulouse.fr
.Computer-Aided Lipid Design: phase equilibrium
modeling for product design
Moises T. dos Santos,a,b Galo A.C.Le Roux, a Vincent Gerbaud b*
aUniversidade de São Paulo, Escola Politécnica, Laboratório de Simulação e Controle de Processos, Av. Prof. Lineu Prestes, São Paulo,5088-900 BRASIL
b
Université de Toulouse, Laboratoire de Génie Chimique (LGC) UMR CNRS INP/UPS, Allée Emile Monso, Toulouse, 31000 France. *Vincent.Gerbaud@ensiacet.fr
Abstract
The aim of this work is use phase equilibrium modeling as an auxiliary tool for product design, especially for those whose desired final properties are directly related to solid fat content (SFC) and melting behaviour. Solid-liquid equilibrium (SLE) modeling has been implemented for triacylglycerols mixtures, the main components of vegetable oils, a renewable raw-material for a wide variety of products. Excess Gibbs energy models were used to model solid-phases while direct optimization of Gibbs free energy using Generalized Reduced Gradient was performed aiming to compute the number of molecules in each phases at the whole range of melting. As results, a computed phase diagram was compared with experimental data from literature as well as a DSC curve. The model was also used to simulate a four-component DSC curve as a predictive tool. Keywords: vegetable oils, solid-liquid equilibrium, optimization, triacylglycerol.
1. Introduction
Phase equilibrium calculations have been widely applied in chemical process design. However, equilibrium calculations have also a great potential to be used for product design, as many products have their desired properties directly related to phase behavior in multi-component mixtures (paints, rubber, plastic composites, agglomerated powders, extruded products, foams and foods). (Bruin; Jongen, 2003). Regarding the last ones, in fat-based products (lipids domain), the distribution of several triacylglycerols (TAG) molecules between solid and liquid phases directly impacts final products requirements, as solid fat content (SFC), melting profile, hardness and texture. Besides this, vegetable oils are the main source of TAG molecules used in a large variety of products (food, biofuels, cosmetic, soaps, pharmaceutical and lubricants), and its renewable nature make them proper to chemical industry sustainability issues. New applications are sought with tailor-made lipids (1), which are lipids specially designed for give a desired set of properties and the use of rigorous thermodynamic based models can open opportunities for better predictive knowledge about final properties of such mixtures. However, a general phase equilibrium description of all possible mixtures of TAGs is lacking and experimental data is scarce. Some discussions about general TAG phase equilibrium modeling can be found in literature (Wesdorp, 1990; Won, 1993; Himawan et al., 2006) , but computational results for multi-component mixtures is still scarce. The goal of this work is contribute to phase equilibrium modeling in such mixtures, using thermodynamic based description of solid and liquid phases and direct minimization of the Gibbs energy, allowing calculate the type and amount of triacylglycerols in each phase and solid fraction content (SFC) in a given temperature and overall composition.
2. Problem Modeling
2.1. Multiphase Multicomponent Solid-Liquid Equilibrium (SLE) Modeling
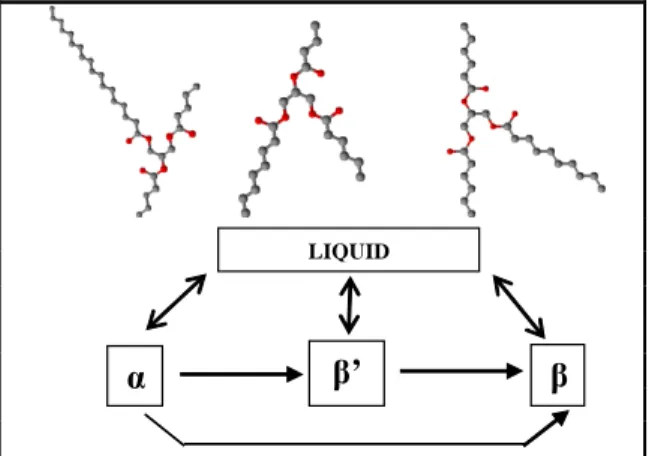
Triacylglycerols (TAG) are made by three fatty acids sterified to a glycerol backbone. Due to their high molecular weight, TAGs tend to crystallize in a solid network with different crystals packing (polymorphisms): unstable α, metastable β’ and stable β form (Sato, 2001) as illustrated in Figure 1.
α
β
’
’
β
α
LIQUIDFigure 1: Triacylglycerol structures and state transitions.
In a multi-component system with a liquid phase and at least one solid phase, the condition for thermodynamic equilibrium is that the chemical potential of each component i in liquid phase must be equal to that in any other j-solid phase:
) ( j solid i liquid i
µ
µ
=
(1) or)
ln(
)
ln(
,0 ( ) ( ) ( ) 0 , j solid i j solid i j solid i liquid i liquid i liquid iRT
γ
x
µ
RT
γ
x
µ
+
=
+
(2)For the chemical potential of molecules i in the reference state:
dP
V
dT
S
d
µ
ip,0=
−
ip,0+
i,p0 (3) where:T
H
S
i,0=
∆
i,0/
∆
and∆
H
i,0=
∆
H
m,i,0+
∆
Cp
i,0(
T
−
T
m,i)
(4) The effect of pressure in condensed phases (solid, liquids) can be neglected at pressures not too high. Assuming ∆Cpi independent of temperature, after some rearrangements Eq. (2) can be rewritten as:T
T
R
C
T
T
T
R
C
T
T
R
H
x
x
j solid i m i p j solid i m i p j solid i m j solid i m liquid i liquid i j solid i j solid i ) ( , , ) ( , , ) ( , ) ( , ) ( ) (ln
...
...
1
1
ln
∆
+
+
−
∆
−
−
∆
=
γ
γ
(5)Experimental and theoretical backgrounds allow considering liquid and alpha solid phases as ideal (Wesdorp, 1990; Bruin, 1999; Himawan et al., 2006). Thus, β’ and β solid phases need description with an excess Gibbs free-energy model. The Margules equations are used, as this model is well-suited for mixtures whose components have similar molar volumes, shape and chemical nature (Prausnitz et al., 1986) and whose parameters can be predictable by using experimental correlation based on the isomorphism concept (Wesdorp, 90). The intensive Gibbs free energy for a phase p is:
)
ln
(
,0 1 p i p i p i nc i p i px
RT
x
g
=
∑
µ
+
γ
= (6)Setting the chemical potential in the pure liquid reference state to zero and taking into account that for TAG mixtures ∆Cp = 0.2 kJ/mol (Wesdorp, 90), Eq.(5) can be simplified and the expressions for the Gibbs free energy becomes:
)
ln
(
1 liquid i nc i liquid i liquidx
x
RT
g
∑
==
(7)And for p being one of the possible solid phases (α, β’ or β):
)
ln
)
1
1
(
(
, , 1 p i p i p i m p i m nc i p i px
T
T
R
H
x
RT
g
=
∑
∆
−
+
γ
= (8)2.2. Direct minimization of Gibbs free energy
Computing phase equilibrium is the solution of a nonlinear problem (NLP) for minimization of the total Gibbs free energy subject to material balance constraints. Therefore, the problem is:
∑∑
= ==
nc i np j j i j in
n
n
G
1 1)
(
)
(
min
µ
(9) s.t:∑
==
=
np j j i in
i
nc
n
1...
1
(10)np
j
nc
i
n
n
i j i1
...
;
1
...
0
≤
≤
=
=
(11)3. Results and Discussions
3.1. Phase Diagram
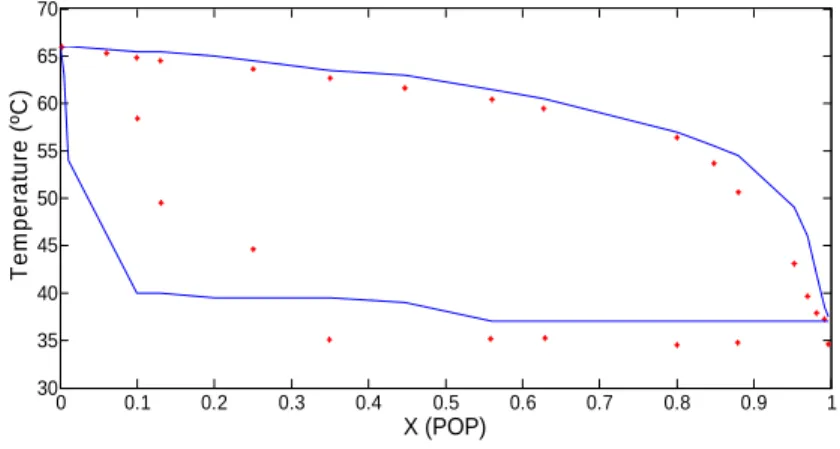
The optimization problem was solved using GAMS (v.23) with solver CONOPT 3 (Generalized Reduced Gradient-GRG algorithm), as this solver gave the best results in terms of CPU time and number of successful solutions obtained. Fig. (2) shows a calculated phase diagram for the binary mixture PPP-POP compared with experimental data from Bruin (99). It can be noted that the model was able to predict the liquid line with good accuracy, while the solid line showed larger deviations, especially for PPP enriched mixtures. 0 0.1 0.2 0.3 0.4 0.5 0.6 0.7 0.8 0.9 1 30 35 40 45 50 55 60 65 70 X (POP) T e m p e ra tu re ( ºC )
Figure 2: Phase diagram for mixture POP-PPP (experimental points in red).
3.2. Differential Scanning Calorimetry (DSC)
Experimental determination of phase diagrams has drawbacks: time consuming, not accurate, relative little data available, impurities leads to large deviations, start and end melting points difficult to determine and unstable forms are not covered (Wesdorp, 90). Besides this, all the intermediary points (solid-liquid mixtures) are not used. To overcome this, all points in a Differential Scanning Calorimetry (DSC) can be used. As all the points in the curve can be used, instead of using just the clear and softening points reported on the phase diagram, DSC curves are well-suited for SLE models validation (Takiyama et al., 2002). DSC simulation is based on the following equation:
∑∑
= =∂
∂
+
∂
∂
+
=
P j N i i j j i E p app pT
n
H
T
G
C
C
1 1(12)
Equation (12) shows that the apparent heat capacity (given by DSC measurements) can be calculated by using two derivatives obtained by numerical differentiation requiring two SLE calculations for each temperature in a DSC curve. A DSC curve was simulated using the results from optimization step (number of mols of each molecule in each phase) for the ternary-mixture MPM-SSO-OOO and the results from the model were compared with experimental points from Wesdorp (90). Fig. (3) shows the curve as well as the corresponding simulated melting curve.
Fig.(4) shows a simulated melting curve and DSC for the mixture PPP, SSS, CCC and OOO. Three peaks are well observed, corresponding to the phase transitions for the molecules CCC, PPP and SSS respectively. The TAG formed by three oleic acids (OOO) in Fig.(3) and Fig.(4) is not observed as a peak, because at the first temperature it is already in liquid phase and it is used just as a liquid medium for make the solid diffusion rates faster.
290 300 310 320 330 0 0.05 0.1 0.15 0.2 0.25 0.3 0.35 0.4 0.45 0.5 Temperature (K) S F C ( m a s s ) 2900 300 310 320 330 200 400 600 800 1000 1200 Temperature (K) C p ( k J /K )
Figure 3: Simulated SFC vs Temperature and simulated (blue) and experimental (red) DSC for mixture MPM, SSO and OOO.
250 300 350 0 0.1 0.2 0.3 0.4 0.5 0.6 0.7 0.8 0.9 1 Temperature (K) S F C ( m a s s ) 250 300 350 0 2000 4000 6000 8000 10000 12000 Temperature (K) C p ( k J /K )
Figure 4: Simulated SFC vs Temperature and simulated DSC curve for mixture PPP, SSS, CCC and OOO.
4. Conclusions
SLE modeling and direct minimization of Gibbs free energy was used to compute a phase diagram and DSC curves for triacylglycerols mixtures. The model was able to
predict the melting behavior of such mixtures, and was evaluated with experimental data from literature. The present modeling has the advantage to be used as an auxiliary tool for product design using glycerol structure, as phase related properties can be evaluated in a pre-experimental step.
5. Acknowledgements
We acknowledge the financial support received from The National Council for Scientific and Technological Development (CNPq-Brazil) and ALFA programme (France).
LIST OF SYMBOLS G : extensive Gibbs
free energy
GE : excess extensive Gibbs free energy
g: intensive Gibbs free energy
nc number of
components
np: number of phases n: total number of mols R: gas constant T: temperature p i
x :
mol fraction of i in phase p p in :
number of mols of i in phase p p i mT
,:
temperature of melting of component i in polymorphism p p i mH
,∆
:
molar enthalpy of melting of component i in polymorphism p∆Cp,i: molar heat capacity
difference of component i between solid and liquid C: capric acid (C10:0) M: myristic acid (C14:0) O: oleic acid (C18:1) P: palmitic acid (C16:0) S: stearic acid (C18:0) Greek: p i
γ
: activity coefficient of i in phase p p iµ
: chemical potential of i in phase p p i 0,µ
: chemical potential of i in phase p at the reference state ReferencesBruin S., Th.R.G. Jongen, 2003, Food Process Engineering: The Last 25 Years and Challenges Ahead, Comprehensive Reviews in Food Science and Food Safety, 2, 42 – 81.
Bruin S., 1999, Phase equilibrium for food product and process design, Fluid Phase Equilibrium, 158–160, p. 657–671.
Himawan C., V.M. Starov, A.G.F. Stapley, 2006, Thermodynamic and kinetic aspects of fat crystallization, Advances in Colloid and Interface Science, 122, 3 – 33.
Prausnitz J.W., Lichtenthaler R.N., Gomes de Azevedo, E., 1998, Molecular thermodynamics of fluid phase equilibria, New York, Prentice-Hall, 3 edition.
Sato K., 2001, Crystallization behaviour of fats and lipids - a review, Chemical Engineering Science, 56, 2255 – 2265.
Takiyama, H., Suzuki, H., Uchida, H., Matsuoka, M. 2002. Determination of solid–liquid phase equilibrium by using measured DSC curves. Fluid Phase Equilibrium, 194–197, p. 1107–1117. Wesdorp L.H. et al., 1990. Liquid – Multiple Solid Phase Equilibria in Fats: Theory and
Experiments. In A.G. Marangoni, ed. Fat Crystal Networks, New York, 2005.
Won K.W., 1993, Thermodynamic Model of Liquid-Solid Equilibrium for Natural Fats and Oils, Fluid Phase Equilibrium, 82, 261-273.