OATAO is an open access repository that collects the work of Toulouse
researchers and makes it freely available over the web where possible
Any correspondence concerning this service should be sent
to the repository administrator:
[email protected]
This is an author’s version published in: http://oatao.univ-toulouse.fr/21575
To cite this version:
Faucet-Marquis, Virginie
and Joannis-Cassan, Claire
and Hadjeba-Medjdoub,
Kheira
and ballet, Nathalie and Pfohl-Leszkowicz, Annie
Development of an in
vitro method for the prediction of mycotoxin binding on yeast-based products: case
of aflatoxin B1, zearalenone and ochratoxin A. (2014) Applied Microbiology and
Biotechnology, 98 (17). 7583-7596. ISSN 0175-7598
DOi 10.1007/s00253-014-5917-y
Development of an in vitro method for the prediction of mycotoxin
binding on yeast-based products: case of aflatoxin B
i
, zearalenone
and ochratoxin A
Virginie Faucet-Marquis • Claire Joannis-Cassan •
Kheira Hadjeba-Medjdoub • Nathalie Ballet• Annie Pfohl-Leszkowicz
Abstract To date, no official method is available to accurate
ly define the binding capacity ofbinders. The goal is to define general in vitro parameters ( equilibrium time, pH, mycotoxin/ binder ratio) for the determination ofbinding efficacy, which can be used to calculate the relevant equilibrium adsorption constants. For this purpose, aflatoxin B1 (AFB1), zearalenone
(ZEA) or ochratoxin A (OTA) were incubated with one yeast cell wall in pH 3, pH 5 or pH 7 buffers. The percentage of adsorption was recorded by quantitation of remaining myco toxins in the supernatant and amount of mycotoxin adsorbed on the residue. The incubation of yeast cell wall in the pres ence of mycotoxins solved in buffer, lead to unexpected high adsorption percentage when the analysis was based only on remaining mycotoxins in the supematant. The decrease of
Electronic supplementary material The online version of this article
(doi:10.1007/s00253-014-5917-y) contains supplementary material, which is available to authorized users.
V. Faucet-Marquis · C. Joannis-Cassan · K. Hadjeba-Medjdoub · A. Pfohl-Leszkowicz (�)
Laboratory Chemical Engineering, University of Toulouse, UMR-CNRS/lNPT/UPS 5503, 1 avenue agrobiopôle, 31320 Auzeville-Tolosane, France
e-mail: [email protected]
V. Faucet-Marquis · K. Hadjeba-Medjdoub · A. Pfohl-Leszkowicz Department Bioprocess and Microbial system, ENSAT, 1 avenue agrobiopô\e, 31320 Auzeville-Tolosane, France
C. Joannis-Cassan
Department Bioprocess and Microbial system, ENSIACET, 6 allée Emile Monso, 31049 Toulouse, France
N. Ballet
Lesaffre International, 147 rue Gabriel Péri, 59703 Marcq-en-Baroeul, France
Present Address:
V. Faucet-Marquis
Anabiotox, 16 allée Monclam, Ramonville-St Agne, France
mycotoxins in the supematant was not correlated to the amount of mycotoxins found in the residue. For this reason we modified the conditions of incubation. Yeast cell wall (5 mg) was pre-incubated in buffer (990 µl) at 37 °C during 5 min and then 10 µl of an alcoholic solution of mycotoxin ( concentration 100 times higher than the final concentration required in the test tube) were added. After incubation, the solution was centrifuged, and the amount of mycotoxins were analysed both in the supernatant and in the residue. A plateau of binding was reached after 15 min of incubation whatever the mycotoxins and the concentrations tested. The adsorption of ZEA was better at pH 5 (75 % ), versus 60 % at pH 3 and 7. OTA was only significantly adsorbed at pH 3 (50 %). Depending on the pH, the adsorptions of OTA or ZEA were increased or decreased when they were together, indicative of a cooperative effect.
Keywords Binder • Aflatoxin • Ochratoxin • Zearalenone •
Yeast • In vitro screening method
Introduction
Mycotoxins are fungal secondary metabolic products growing on a variety of crops. These compounds pose a potential threat to human and animal health through the ingestion of food or feed Yannikouris and Jouany (2002). Aflatoxin B1 (AFB1) is a
potent human carcinogen (group 1) (International Agency for Research on Cancer [IARC] 1993) mainly produced by
Aspergillus jlavus and A. parasiticus. Aflatoxin contamination
occurs frequently in agricultural products, particularly in maize and groundnuts. This mycotoxin is a potent liver toxin that can be lethal when consumed in large amount, and it induces cancer by chronic exposure. Ochratoxin A (OTA) produced by several Aspergillus and some Penicillium species (Varga et al. 2003; Ostry et al. 2013), is a main contaminant of
cereals ( corn, barley, wheat) and to some extent beans ( coffee, soy, cocoa). The IARC rated OTA as a possible carcinogen (group 2B) (IARC 1993). The presence of OTA in several commodities (feed, food and beverages) is considered as a serious health hazard in view of its nephrotoxic, teratogenic, hepatotoxic and carcinogenic properties (Varga et al. 2001; Pfohl-Leszkowicz and Manderville 2007, 2012). Zearalenone (ZEA), produced by numerous Fusarium species, exhibits an estrogenic activity (Mirocha et al. 1971). It contaminates grains (wheat, barley, sorghum and corn) and fiuits. ZEA is frequently implicated in reproductive disorders or physical
changes in genital organs of farm animals (Zinedine et al.
2007; Fink-Gremmels and Malekinejad 2007).
Primary strategies to reduce the risk of mycotoxin contam ination include good agricultural practices in the field ( crop rotation, soil cultivation, weed and insect control, careful use offungicides) and upon harvest, as well as transportation and storage under dry and cool conditions (Jouany 2007). However, complete avoidance of mycotoxins is not possible. Severa} approaches have been investigated to reduce the risk of mycotoxicosis in livestock (Jouany 2007; Kolosova and Stroka 2011 ). Biological, chemical, or physical treatments can minimize toxin production and eliminate contaminants in food and feed. The most applied method to prevent mycotoxicosis in animals consists in the addition of adsor bents to animal feed, in order to bind the mycotoxins in the gastro-intestinal tract (Regulation EC No. 386/2009). The e:fficacy ofbinders appears to depend on the chemical structure ofboth the adsorbent and the mycotoxin. The most important
feature is the physical structure of the adsorbent, i.e., the total charge and charge distribution, the size of the pores and the accessible surface area (Di Natale et al. 2009). On the other hand, the properties of the adsorbed mycotoxins, like polarity, solubility, shape and charge distribution, also play a significant role (Huwig et al. 2001; Avantaggiato et al. 2005).
Silicates are the most widespread commercially available feed additives for mycotoxins binding. Minerai adsorbents such as clays or activated carbons have been extensively tested for their potential to bind aflatoxin and impair their
gastrointestinal absorption (Kabak et al. 2006). However, these compounds are relatively ine:fficient toward others my cotoxins and can also impair the absorption of some micronutrients (Huwig et al. 2001).
Organic adsorbents such as yeast cell wall (YCW) both in vitro and in vivo have shown much larger sorption capa bilities across a wider spectrum ofmycotoxins (Binder 2007; Huwig et al. 2001; Jouany 2007; Yiannikouris et al. 2004,
2006, 2013; Karaman et al. 2005; Kabak et al. 2006; Kabak and Dobson 2009; Shetty and Jespersen 2006; Shetty et al. 2007; Ringot et al. 2007; Sabater-Vilar et al. 2007; Korosteleva et al. 2007; Matur et al. 2010; Firmin et al.
2010, 2011; Joannis-Cassan et al. 2011). Saccharomyces
cerevisiae occurs as part of natural microbial population in
food fermentation and as starter cultures in the food and beverage industries. Yeast glucans are major cell wall compo nents often present as the inner wall layer and associated with other cell wall components such as chitin (together, they represent 50--60 % of the wall dry weight) which insured the mechanical strength (physical protection and osmotic sup port). The outer cell wall layer is made ofheavily glycosylated mannoproteins, which are involved in cell--cell recognition events and limitation of wall porosity (Kollar et al. 1997; Manners et al. 1973; Zekovic et al. 2005).
Adsorption on the cell wall surface is an interaction be tween the toxins and functional groups of the cell surface, based on physical adsorption, ion exchange and complexa tion. The cell walls harbouring polysaccharides (glucan, man nan), proteins and lipids exhibit numerous different and easily accessible adsorption centers as well as different binding mechanisms (i.e., hydrogen bonds, ionic or hydrophobie in teractions; Huwig et al. 2001; Ringot et al. 2007). The mannoproteins contain hydrophobie domain enabling hydro phobie interactions to occur with OTA especially at the pH of the YCW adsorption system (pH 3) where OTA is mainly in its non-ionized form (Ringot et al. 2005). The measurement of enthalpy/entropy of OTA adsorption on YCW suggested a possible role of the phenylalanine moiety of OTA (Ringot et al. 2005). OTA biosorption onto YCW involves both polar and non-polar non-covalent interactions and the concomitant reorganization of the water molecules of the solvent. The non polar interactions involve the aromatic rings of OTA and hydrophobie amino acids of yeast. The polar interactions can be explained in different complementary ways: (1) electrostat ic ionic interactions involving carboxyl group of OTA and basic amino acids of YCW, (2) electrostatic n-n interactions involving aromatic ring of OTA and aromatic amino acids of YCW, (3) hydrogen bounds of OTA phenol and amide group as donor and acceptor group ofYCW, ( 4) hydrogen bounds of OTA involving aromatic rings as acceptors interacting with donor groups ofYCW (Ringot et al. 2005).
The beta-glucan fraction ofYCW is directly involved in the binding strength (Jouany 2007; Shetty and Jespersen 2006; Yiannikouris et al. 2004). Carvet et al. (2010) tested different /3-glycans and showed that the bound type (1-3 or 1-6) or ramification might not be su:fficient to characterize their ad sorption properties. The binding e:fficiency is a more quanti tative phenomenon (large surface area) than a qualitative phenomenon (chemical structure involved in the interaction), and in this sense the analysis of the glucomannan and pepti doglycan chemical structures did not indicate major differ ences in the capacity to produce hydrophobie interactions or hydrogen bonds, which are presumably involved in the bind ing (Pizzolitto et al. 2011). The interaction between /3-0-glucans and the mycotoxins is driven by steric complemen tarities enabling a marked involvement of van der Waals interaction causing some stacking effects as well as stable
intermolecular hydrogen bonding involving the hydroxyl, lactone, and ketone groups commonly found on mycotoxins. (1-3)- (3-o-Glucans were involved in both mechanisms, whereas (1-6)-(3-o-glucans seemed to strengthen the van der Waals bonds and consequently to strongly stabilize the toxin glucan interaction. However, the mycotoxins were not all equivalent in their ability to bind with (3-o-glucans. Also, the environmental conditions such as pH were determining for the stability of the toxin-glucan complexes generated. The stereo-chemistry and hydrophobie properties of mycotoxins are of prime importance and account for the differences in their a:tfmity for (3-o-glucans (Yiannikouris et al. 2006). The cell diameter/cell wall thickness relation showed a correlation between cell wall amount and mycotoxin removal ability (Armando et al. 2012).
The obvious advantage of in vitro model is the possibility to rapidly screen the efficacy of high numbers of different substances enabling a pre-selection of products.
The experimental conditions for in vitro experiments re ported in literature are often not sufficiently described to be reproduced or the designs are very different (e.g., pH, filtra tion versus centrifugation for binder/toxin separation, one single concentration or equilibrium point, percentage ofbind er, concentration of the toxin, incubation parameters )impeding comparison of the results. Until now, no official method is available to accurately defme the adsorption capacity ofyeast products. Only some guidelines have been recently published (EFSA 2009). The aim of this work was to test different conditions to define a protocol which is reproducible. In the end, as a validation of the protocol several yeast-based prod ucts were tested for their ability to bind together AFB1, OTA
andZEA.
Material and methods
Binders
The binding material used to develop the in vitro procedure was YCW from baker industry called Y0. This YCW contains 27.1 g/100 g ofproteins, 14.5 g/100 g oflipids, 27.1 g/100 g of mannans, 20.1 g/100 g of glucans, with a ration Mannans/ Glucans of 1.08. Eight other binders including inactivated
yeasts and yeast cell walls from baker and brewer yeast
industries have been used to validate the new protocol. The products were labelled with a letter code (Yl to Y8), and some of their characteristics including proteins contents and lipids are summarized in Table S 1.
Chemicals
AFB1 , OTA, ZEA were supplied by Sigma-Aldrich (France).
All chemicals used were of analytical grade unless otherwise
stated. All sol vents (HPLC grade) were purchased from ICS (France).
The binding of mycotoxins was studied under three differ ent pHs: pH 3 (citrate buffer), pH 5 (acetate buffer) and pH 7 (phosphate buffer). These pHs were chosen to determine the effects of pH on mycotoxin binding within the range found in the gastrointestinal tract.
Preparations of the bujfers
Citrate buffer (pH 3), 0.1 mol/1: 4.27 g of tri-sodium citrate 2-hydrate (C6H5Na3O,2H2O, MW=294.l) were dissolved
in approximately 900 ml of distilled water. Tuen, the solution was adjusted to pH 3 with 17.96 g of citric acid (C6H8O,
H2O, MW=210.13, d=l.5) and filled up to 1,000 ml with
distilled water.
Acetate buffer (pH 5), 0.1 mol/1: 13.608 g of sodium acetate 3-hydrate (C2H3NaOz-3H2O, MW= 136.08) were dis
solved in approximately 900 ml of distilled water. Then, the solution was adjusted to pH 3 with acetic acid (C2H4O2,
MW=60.05, d= 1.05) and filled up to 1000 ml with distilled water.
Phosphate buffer (pH 7), 0.1 mol/1: a 0.1 mol/1 solution of sodium di-hydrogen phosphate 2-hydrate was prepared by dissolving 15.601 g of NaH2PO4-2H2O (MW=l56.0l) in
1,000 ml of distilled water. A 0.1 mol/1 solution of di sodium hydrogen phosphate 12-hydrate was prepared by dis solving 35.814 g of Na2HPOçl2H2O (MW=358.14) in
1,000 ml of distilled water. Tuen, the Na2HPO4 solution was
adjusted to pH 7 by adding the NaH2PO4 solution.
Incubation conditions for optimisation of the method
Preliminary testslevaluation of the relative concentrations mycotoxin/yeast both solved in buffers
The YCW numbered Y0 (1, 5, 50 mg/ml) was incubated during 90 min at 37 °C in the presence of AFB1 (2 µg/ml)
or ZEA (20 µg/ml) dissolved in the buffers. The adsorption was compared to control tube containing buffer (pH 3, 5, 7) and either 2 µg of AFB1 or 20 µg of ZEA solved in the buffer
(final volume= 1 ml). After 90 min of incubation at 37 °C
under shaking, the mixture was centrifuged 10 min at 9,200xg. The amount of unbound mycotoxins was deter mined without any extraction directly in the supematant and the adsorbed mycotoxin was determined after extraction in the residue. Data are expressed as the mean value of three incu bations per conditions.
Kinetic of adsorption
YCW (Y0, 5 mg) was pre-incubated during 5 min in the presence of 990 µ1 of buffer (pH=3, 5, 7). Then 10 µ1
mycotoxins solved in methanol (100 titnes higher than final concentration required in the test tube) were added. The amounts of mycotoxins in 1 ml (final volume) were 0.5 or 10 µg for either AFB1 or OTA; 1 or 50 µg for ZEA. The
mixture was shaken from 0 to 90 min at 3 7 °C, and centrifuged as described above. The amount of unbound mycotoxins was determined without any extraction directly in the supernatant and the adsorbed mycotoxin was determined after extraction in the residue. Data are expressed as the mean value of three incubations per conditions.
Equilibrium point
YCW (Y0, 5 mg) was pre-incubated for 5 min in the presence of990 µl ofbuffer (pH=3, 5, 7). Tuen increasing amounts of mycotoxins solved in methanol (10 µl) were added. The amounts of OTA tested in 1 ml were 0.05, 0.5, 2, 5, 10 µg; and for ZEA l, 5, 20, 50, 80 µg. The mixture was shaken 15 min at 37 °C and centrifuged 10 min at 9,200xg. The amount ofunbound mycotoxins was determined without any extraction directly in the supematant and the adsorbed myco toxin was determined after extraction in the residue.
Simultaneous binding of the three mycotoxins
YCW (Y0, 5 mg) was pre-incubated during 5 min in the presence of 990 µl of buffer (pH 3, 5). Then, 10 µl of methanol mycotoxin solution ( concentration 100 titnes higher than final concentration requited in the test tube) was added. Two different mixtures of mycotoxins were tested: (1) ZEA (1 µg/ml)+OTA (0.5 µg/ml)+ AFB1 (0.5 µg/ml); (2) ZEA
(20 µg/ml)+OTA (2 µg/ml)+ AFB1 (2 mg/ml). The mixture
was shaken15 min at 37 °C and centrifuged 10 min at 9,200xg. The amount of unbound mycotoxins was deter mined without any extraction directly in the supematant and the adsorbed mycotoxin was determined after extraction in the residue. Data are expressed as the mean value of three incu bations per conditions.
Evaluation ofbinding capacities of eight yeast-based products compared to Y0
To validate the new method, comparison ofbinding capacities of eight yeast-based products (Yl-Y8) against AFB1 , OTA,
ZEA - alone or in combination - was done and compared to Y0 ( called Y9) as described in the following paragraphs.
Five milligrams of each yeast-based product was pre incubated during 5 min in the presence of 990 µl of buffer pH 3 ( citrate buffer). Tuen, 10 µl of methanol mycotoxin solutions ( at concentration 100 titnes higher than the final concentration required in the test tube) was added.
The amount of ZEA was 20 µg/ml; the amount of AFB1 or
OTA was 0.5 µg/ml. Two different mixtures of mycotoxins
were tested: (1) ZEA (20 µg/ml)+ AFB 1 (0.5 µg/ml); (2) ZEA (20 µg/ml)+AFBl (0.5 µg/ml)+OTA (0.5 µg/ml)
The mixtures were shaken 15 min at 3 7 °C and centrifuged 10 min at 9,200xg. The amount of mycotoxins was de termined in the supematant without any extraction and on the residue after extraction. The % of binding were calculated using the both results, taking as reference the amount of mycotoxin engaged and measured in the control tube. Activated carbon was tested as reference binding substance for each mycotoxin. Data are expressed as the mean value of three incubations per conditions.
Extraction of mycotoxin from residue
Extraction of OTA
OTA was extracted from residue by 900 µl of the following mixture MgClz (0.2 M)/HCL (1 M) vol/vol. Chloroform (900 µl) was added to the mixture and shaken for 10 min. After 10 min of centrifugation at 4 °C, and 10,000xg, the aqueous phase was isolated. The chloroform phase (at the bottom of the tube) containing the mycotoxins was taken off and kept in a new tube for following purification. Again, 900 µl of chloroform was added to the aqueous phase, shaken for 10 min, and centrifuged for the collection of the chloro form phase, which was added to the previous one. The chlo roform phase was evaporated to dryness. The dry extract was dissolved in 1 ml methanol and put in ultrasonic bath for 1 min. The solution was filtered on a filter SPARTAN 0.2 µm. Before adding the solution, the filter received 500 µl of methanol. After the solution pass through the filter, 500 µl methanol was added again. The methanol was evapo rated to dryness under nitrogen. Finally, the extract was solved in 300 µl of methanol, stored in glass tube at minus -20 °C until HPLC analysis.
Extraction of AFB 1
AFB1 was extracted by addition of300 µl ofmethanol to the
yeast residue and shakenl 0 min. The mixture was centrifuged at 9,200xg for 10 min, at4 °C. The supematant was taken off for analysis by HPLC.
Extraction of ZEA
ZEA was extracted by 300 µl of mixture water/acetonitrile (AcN) (1/3). The mixture was shaken for 10 min, and then centrifuged at 9,200xg during 10 min. The supematant was recovered and used for HPLC.
Chromatographie conditions
Mycotoxin concentration was analysed by HPLC with fluo rescence detection. Unbound mycotoxin was analysed using 20 µl of the supematant. Bound mycotoxin was analysed using 20 µl of the extract. HPLC system (ICS, France) was equipped with an injector 20 µl loop, a C18 spherisorb col umn (Prontosil; 25 x 0.4 cm) with inner porosity of 3 µm, and a fluorescence detector Shimadzu Fluorescence Detector RF-lOAXK. The HPLC was run in a thermostatic room (25 °C).
Zearalenone analysis
The mobile phase was acetonitrile/water (70:30, v/v) at a flow rate of0.5 ml/min. The spectrofluorimetric conditions were of 275 nm for ZEA excitation and 450 nm for emission.
Ochratoxin A analysis
The mobile phase for separation of OTA was methanol/ acetonitrile/natrium acetate 0.005 M (0.68 g/1 of water) (300:300:400, v/v/v) at a flow rate of 0.5 ml/min. The spectrofluorimetric conditions for OTA were 330 nm for ex citation and 465 nm for emission.
Aflatoxin B 1 analysis
AFB1 was detected after derivatization in Kobra® cells.
The mobile phase was methanol/acetonitrile/water (200:200:600, v/v/v) added with 119 mg/l of kalium bro mide and 350 µl/l of nitric acid 4 M, at a flow rate of 0.5 ml/min. The spectrofluorimetric conditions for AFB1
were 362 nm for excitation and 425 nm for emission.
Separation for simultaneous evaluation of the three toxins
To separate in one run AFB1 , OTA and ZEA, HPLC was run
using gradient conditions.
Phase A: methanol/acetonitrile/water (200:200:600) + ammonium formate 0.34 g (6.5 mM). The pH was ad justed by addition to formic acid till pH 3 .5.
Phase B: methanol/acetonitrile/water (350:350:300) + ammonium formate 0.34 g (6.5 mM). The pH was ad justed by addition to formic acid till pH 3.5.
The gradient was run as follows: TOmin 100 % A, Tl 5min 100 % A, T25min 65 % A, T40min 65 % A, T60min 100 % B (0 % A), T70min 100 % B, T75min 100 % A
The elution times were 27.5 min for AFBl, 60.7 min for ZEA, and 61.9 min for OTA (see Fig. Sl).
Quantitation of the percentage of mycotoxins bound
Percentage of adsorption was calculated either using amount of remaining mycotoxin in the supematant or using mycotoxin bound on the residue.
where Ci is the initial amount of mycotoxin; Cs the amount of
mycotoxin in the supematant % binding
=
Cr/Ci x 100,where Cr is the amount extracted from the residue. Statistical analysis
For the comparison of binding capacities of several yeast based products when mycotoxins are in binary or temary mixture, the results are expressed as means±SD. Data were analysed by one way analysis of variance, and multiple com parisons of each treatment were calculated by applying the Tukey test (Keppel 1973).
Results
Development of an in vitro screening method for mycotoxin binding
Evaluation of the best relative concentrations of binder and mycotoxin
The physical properties ofmycotoxins like polarity, solubility, size, specific shape and in the case of ionized compounds, charge distribution and dissociation constants play a signifi cant role in the binding processes. For this reason, the binding tests have been done at different pHs to mimic the gastroin testinal tract.
Binding capacity ofYCW against 2 µg of AFB1 or 20 µg
of ZEA dissolved in buffer was tested using increasing amount of YCW in different buffers. The final volume of incubation was 1 ml. Control tube contained only AFB1 or
ZEA in buffers and was incubated in the same conditions to test the stability of the mycotoxin in the buffer. After 90 min of incubation tubes were centrifuged and the amount of AFB1 or
ZEA in the supematant and in the residue were analysed. Based on remainingAFB1 in the supematant compared to
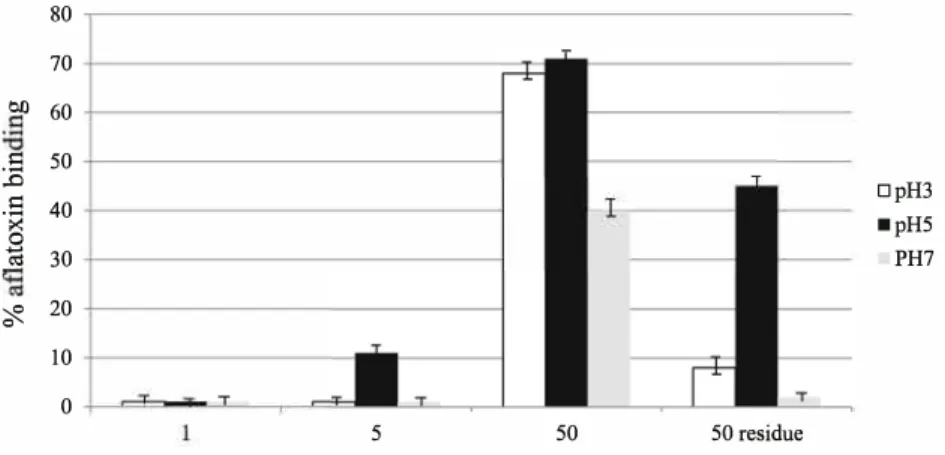
the control tube, no adsorption could be observed with 1 mg of yeast-based product, whereas it seems that 50 mg of YCW was highly efficient to adsorb 2 µg of AFB1 (Fig. 1).
Fig. 1 Binding efficacy of
2 µg/ml AFB1 by increasing
amounts ofyeast cell wall (Y0) in different buffers: pH 3 (white); pH 5 (black); pH 7; (grcy). The data are expressed as percentage of binding calcwated on amount of ABF 1 remained in the supernatant
in the presence of 1, 5 or 50 mg/ml yeast; or based on mycotoxin bound on yeast cell walls (50 mg/ml) 80 70 Oil 60
.s
50 .0.s
40 � � 30 � 20 10 0relevant AFB1 adsorption at pH 3 and pH 7 with this high
amount ofYCW. Indeed, the percentage of adsorption calcu lated on AFB1 extracted from the residue was 8 %, 45 % and
2 % at pH 3, pH 5 and pH 7, respectively.
Conceming ZEA, the % of adsorption increased with the amount of YCW. With 50 mg/ml of yeast whatever the pH, again it seems that almost 100 % of ZEA were adsorbed. N evertheless, based on ZEA in residue the % of adsorption is about 60 % at pH 3; 80 % at pH 5; 55 % at pH 7.
Influence of the pH on jluorimetric response of mycotoxin
The reason of the unexpected high adsorption seen above is due to the fact that large amount ofYCW ( 50 mg/ml) modified the pH of the buffer which was dramatically lowered (Table 1).
The fluorimetric response of AFB1 but also of ZEA was
lower in acidic condition (Fig. 2), and thus virtually less mycotoxin was detected when they are analysed directly on supematant leading to a misinterpretation on high adsorption. In contrast in the same conditions (2 µg/ml OTA; 50 mg/ml YCW) a lower % of adsorption as expected compared to OTA found in the residue was observed. Acidification of media by YCW in the case of OTA, virtually increases the amount of residual OTA in supematant because fluorimetric response is higher at pH 3 compared to pH 5 or pH 7 for OTA ( see Fig. S2).
Using 5 mg YCW/ml, the pH of the buffer was stable whatever the buffer (Table 1 ).
Table 1 Stability of pH in the presence ofyeast (50 or 5 mg/ml)
Water pH3 pHS pH7 6.5 3 5 7 1.63 2.5 4.08 5.5 4.5 3.1 4.9 6.99 Initial pH Without yeast
With yeast (Y0) (50 mg/ml) With yeast (Y0) (5 mg/ml)
DpH3 ■pHS
PH7
T
5 50 50 residue
Amount of yeast cell wall engaged in mg
For all of these reasons, further experiments have been done with 5 mg of YCW pre-incubated 5 min in the buffer followed by the addition of a minimal volume (10 µl) of mycotoxin solved in methanol in a final volume of 1 ml buffer.
Evaluation of the best incubation time and the stability ofbinding
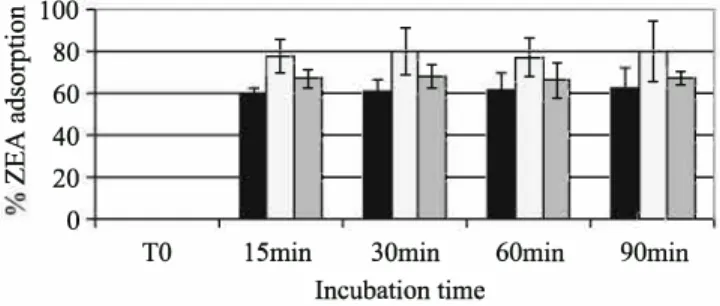
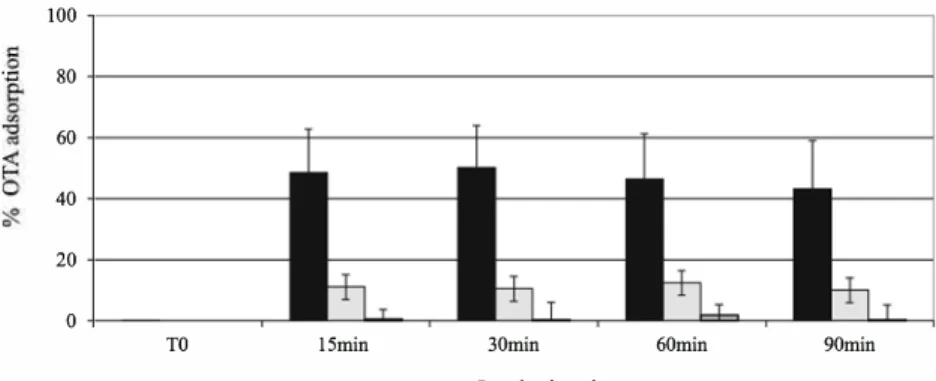
Figure 3 shows the kinetic ofbinding of ZEA. Whatever the mycotoxins and the concentrations of mycotoxin, the adsorp tion equilibrium was reached before 15 min, with almost no change after longer incubation times. The adsorption of ZEA was better at pH 5 than at pH 3 or 7 (Fig. 3). The maximum of adsorption reached 80 % at pH 5 and 60 % at pH 3, whatever the concentration of ZEA. The adsorption of OTA was around 50-60 % for 0.5 µg/ml in buffer pH 3 (Fig. 4). At pH 5, the adsorption of OTA was negligible. No adsorption of OTA could be observed in pH 7.
As a plateau was reached after 15 min of incubation, the following experiments have been done with 15 min incuba tion time.
Equilibrium points at different pH values/validation step of the in vitro method
To check the best pH and validate concentration ranges, increasing amounts of mycotoxins were incubated with fixed concentration ofbinder (5 mg) during 15 min at 37 °C. The binding capacities were calculated using both the amount of mycotoxin remaining in the supematant and the amount of mycotoxins bound on the residue.
As no binding of AFB1 can be observed with Y0, equilib
rium point has been evaluated only with ZEA and OTA. Adsorption equilibrium was established when the quantity of the toxin being adsorbed (Qeq) was equal to the quantity being
desorbed. Tuen, the equilibrium concentration in solution ( Ceq) remained constant. Whatever the pH, the isotherm curves drawn using mycotoxins in the supematant, are similar
Fig. 2 Calibration curves and
fluorescence signal of ZEA
solved in different buffers: red
triangle: methanol, blue diamond:
buffer pH 3; pink square: buffer pH 5; green circle: buffer pH 7
.t;:: 14000000 ...---, � 12000000
+---
�
�-
--l
-!:l 10000000+---
..,,.-:,
.,,,,_
___,,,
,....
__
---i -+-pH3!
8000000 +---7""-7"--::7""---1 ----pHS5
6000000 --+-pH7 � 4000000 +----"""7�7""------;j
2000000 +--7"-.�=---------i -MeOHto curves drawn using mycotoxins in the residue (see Figs. S3
and S4). This lead to the conclusion that evaluation could be done using only the amount of mycotoxin in the supernatant or both data can be mixed.
For ZEA whatever the concentration, the percentage of binding was around 60 % at pH 3 or pH 7, and 70 % at pH 5. The saturation point was not reached even with 80 µg/ml (Fig. 5). The % of binding of OTA increased with the con centration of ochratoxin from 0.05 to 5 µg/ml. Whatever the concentration, the OTA binding was better at pH 3 than at pH 5, and no adsorption occurred at pH 7. A saturation ofbinding was reached at 5 µg/ml (Fig. 6).
Simultaneous binding ofZEA and OTA
To check if the presence of one mycotoxin can modify the adsorption of another, ZEA (1 or 20 µg/ml) and OTA (0.5 or 2 µg/ml) were incubated together with 5 mg of Y0 in buffer pH 3 and pH 5. The binding of low concentration of ZEA (1 µg/ml) in the presence of OTA was significantly reduced (50 % vs. 60 %) at pH 3 (p<0.05) and slightly decreased ( 68 % vs. 7 5 % ) at pH 5. In contrast with higher amount of ZEA (20 µg/ml), the binding ofZEA at pH 3 was significantly higher(p<0.01) in the mixture (80 % vs. 60 %) whereas at pH
d 100 0
·i
80 Sl 60 "g <: 40 N� 20 0 TO TT
-r 1-f
-
1ft--
-15min 30min Incubation time TT
rr -f_
1-r
>--
>-- � �-� 60min 90minFig. 3 Binding kinetic ofZEA. Data are expressed as average percentage
ofbinding of ZEA (20 µg/ml), calculated taking into account amount of ZEA in the supernatant and on the residue. Incubation in different buffers: pH 3 (black); pH 5 (white); pH 7 (grey) in the presence of 5 mg/ml of Yeast cell wall (Y0)
2 3 4 5 6
concentration of ZEA in µg/ml
5, the binding was similar when ZEA was alone or in mixture (Fig. 7). Concerning OTA, the presence of low concentration of OTA (0.5 µg/ml) in the mixture favoured the adsorption of this toxin on YCW whatever the pH. For higher concentration (2 µg/ml), at pH 3 the adsorption was similar, and a trend to decrease was observed at pH 5. For AFB, the presence of the other mycotoxins decreased the adsorption of low concentra tion of AFB1 at pH 3 (18 % vs. 30 %). The decrease was
significant (p<0.01) at pH 5 (5 % vs. 22 %). In contrast for high concentration, the adsorption of AFB1 was similar at pH
3 (about 20 %) and a decrease at pH 5 was observed (5 % vs. 10%).
Comparisons of several yeast-based products on adsorption of mycotoxins
Comparison of the binding capacity of nine yeast-based products using the new validated in vitro screening method
Nine yeast-based products (Table S1) were used to evaluate the pertinence of the new in vitro procedure to compare e:fficacy to bind the three mycotoxins (AFB1, ZEA, OTA).
The incubation was done only in buffer pH 3 (citrate) as it was the buffer for which relevant adsorption has been observed for the three mycotoxins in the presence of 20 µg/ml ZEA or 0.5 µg/ml AFBl or 0.5 µg/ml OTA individually.
The percentage of adsorption of ZEA ranges from 30 % to 60 %. The less effective products are product Yl, Y2, Y7 and Y8 (about 30 %). Three ofthem are from brewer origin. The e:fficacy ofproducts Y4, Y6, Y9, Y3 and Y5 is almost similar (about 60 %). The percentage of adsorption of ZEA on char coal was 99.6±0.4 %.
The % ofbinding of AFB1 ranged from 15 % (products Y2,
Y9 and Y6) to 45 % (product Y5). The percentage of AFB1
binding on charcoal was 99.9±0.05 %.
The% ofbinding of OTA ranged from 40 % (products Yl, Y2) to 70 % (product Y3). There was almost no difference between binding capacity ofproducts Y3, Y4, Y5, Y8, Y9 for
Fig. 4 Binding kinetic of OTA. Data are expressed as average percentage ofbinding of OTA (0.5 µg/ml), calculated taking into account amount of OTA in the supernatant and on the residue. Incubation in different buffers: pH 3 (black); pH 5 (white); pH 7 (grey) in the presence of 5 mg/ml
of yeast cell wall (Y0)
·.c 100 80 60 40 20 0 TO
OTA (more than 65 %). The% ofbinding of OTA on charcoal was 98.7±0.3 %.
The product Y5 (inactivated yeast-based product enriched in glutathione) seemed to be the most interesting products as it bound the three mycotoxins to an extent higher than 50 % for OTA and ZEA and 45 % for AFB1.
Comparison of the adsorption of two or three mycotoxins simultaneously on several yeast products
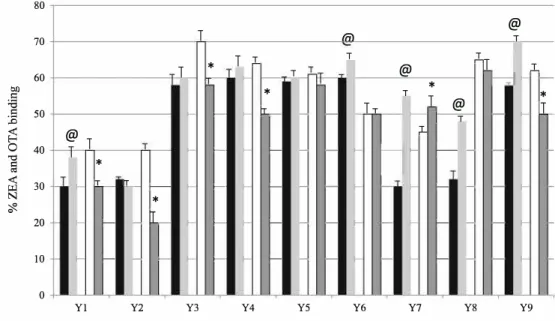
To test if the binding of one toxin was modified by the others we tested the binding capacities of the several products in two conditions: (1) ZEA (20 µg/ml)+AFB (0.5 µg/ml); (2) ZEA (20 µg/ml)+ AFB (0.5 µg/rnl)+OTA (0.5 µg/rnl) (Fig. 8).
The simultaneous presence of ZEA with OTA and AFB1
modified the % of binding on yeast products. Depending on the products this adsorption could be increased or decreased. With yeast products Yl and Y7 (YCW brewer), Y9; Y6 (YCW baker) and Y8 (alcoholyeast) the simultaneous pres ence of the three mycotoxins increased the binding of ZEA. This increase was already observed when ZEA was only in the presence of AFB1(data not shown).
With yeast products Y3 (Se Yeast) and Y5 (GSH Yeast), the binding of ZEA was similar when ZEA was alone or in the presence of the two other toxins but was lower when ZEA was
15min 30min Incubation time
60min 90min
in the presence only of AFB1. With product Y2 (YCW from
brewer) a trend of decreasing ZEA binding was observed when ZEA was in the presence of AFB1 or both toxins.
OTA binding is increased on Y7, whereas it is decreased on products Yl, Y2, Y3, Y 4, Y9 when the two other mycotoxins are simultaneously present (Fig. 8).
Discussion
Adsorption on the cell wall surface is an interaction between the toxins and functional groups of the cell surface, based on physical adsorption, ion exchange and complexation. The cell walls harbouring polysaccharides (glucan, mannan), proteins and lipids exhibit numerous different and easily accessible adsorption centers as well as different binding mechanisms (i.e., hydrogen bonds, ionic or hydrophobie interactions (Huwig et al. 2001; Ringot et al. 2007). On the other hand, the properties of the adsorbed mycotoxins, like polarity, solu bility, shape and charge distribution also play a significant role (Huwig et al. 2001; Avantaggiato et al. 2005).
Most studies conceming the effects of mycotoxins binders are focused on AFB1. OTA and ZEA were selected in addition
to AFB1 as mode! mycotoxins for the current study due to
their very different structure and physico-chemical properties and, due to their toxic properties notably in pig husbandry,
Fig. 5 ZEA binding of
increasing amount of ZEA in different buffers in the presence of 5 mg/ml Y0. Percentage of ZEA binding in function of initial concentration of ZEA and according to the pH: pH 3 (black);
pH 5 (white); pH 7 (grey) 100 ....---, 90
---
--<
80 ---
-70 6050
4015
30 � 20 10 0 1 5 2050
80
Concentration in µg/ml
Fig. 6 OTA binding of
increasing amount of OTA in different buffers in the presence of 5 mg/ml YO. Percentage of OTA binding in function of initial concentration of OTA and according to the pH: pH 3 (black); pH 5 (white); pH 7 (grey) Cl)
.s
.D � 0 �1
00
80
60
40
20
0
which is considered as the most sensitive animal species (EFSA 2004a, b ). OTA has a carboxyl group at the phenylal anine moiety and a phenol group at the dihydroisocoumarin part with a pKa of 4.4 and 7.3, respectively. Being a
polyaromatic molecule, OTA is hydrophobie when unionized. ZEA is a resorcyclic acid lactone. It has a pKa of 7 .62 and is
also a weak acid due to the presence of the diphenolic moiety. ZEA will be found almost completely in its deprotonated form at pH 8.4. (Dakovic et al. 2005).
The aim of the present work was to adapt a reliable method to explore, using an in vitro test, the e:fficacy of mycotoxin adsorption on a natural organic adsorbent made of isolated
S. cerevisiae cell wall fraction.
Originally, in vitro tests have been performed at a defined pH, sometimes acidic (Kurtbay et al. 2008), but more often at a neutral pH (Carvet et al. 2010; Yiannikouris et al. 2004) and using a single mycotoxin concentration (Shetty and Jespersen
2006). The methods of selection using a unique mycotoxin concentration may lead to erroneous result when the concen trations of mycotoxin changed (Shetty and Jespersen 2006; Bueno et al. 2007; Pizzolitto et al. 2011). Next to single concentration experiments, the evaluation of adsorption
Fig. 7 Comparison ZEA or OTA 90
binding in mixture in the presence
of 5 mg/ml YO either in buffer pH 80 3 or pH 5. Percentage of ZEA 70 binding: black (alone); light grey
(in the presence of OTA); i: 60
@ 0
percentage of OTA binding: white
·i
50 ( al one); dark grey (in the presence 0of ZEA). Significant differences
i
40 of ZEA binding in mixture � 30compare to ZEA alone
@@p<0.01, @p<0.05. Significant 20 differences of OTA binding in 10 mixture compare to OTA alone:
**p<0.01, *p<0.05 0
0,05
0,5
2
5
10
Concentration of OTA in µg/ml
isotherms have been recommended to characterize mycotoxin adsorption (Ringot et al. 2007; EFSA 2009; Joannis-Cassan et al. 2011). Under defined conditions, an adsorption equilib rium is reached at which the quantity of the toxin being adsorbed is equal to the quantity being desorbed. Table 2
summarizes the different protocols used for testing yeast bind ing capacity of mycotoxins.
However, the binding affmity of a polar substance is influ enced by pH and, therefore, it is recommended to measure adsorbent characteristics under the conditions of the gastroin testinal tract at neutral, acid and basic pH (Sabater-Vilar et al.
2007). Previously, it has been shown that adsorption of ZEA and AFB1 by mineral clays and humic acid polymers, respec
tively, is pH-dependent (Dakovic et al. 2005; Ye et al. 2009), and that the transition to alkaline conditions may lead to desorption.
The first step of this study was to defme the best ratio (binder/mycotoxin) using the most common incubation time (90 min) and temperature (37 °C) during the analysis ofresidual mycotoxins in the supematant. Comparison with real amount of mycotoxin bound in the pellet, pinpointed inaccurate conclusion of high biosorption with huge amount
**
*
pH 3 pH 5
f pH3 1 pHS
Fig. 8 Percentage of ZEA and 80 OTA binding in mixture by
several yeast-based products. 70
Black column: ZEA alone; light grey column: ZEA+ AFB1 +
60 OTA; white column: OTA alone; bll
dark grey column: OTA+ ZEA + .!3 AFB1. The percentages are '"O .!3 50
expressed as means value using ..0
�
ZEA remaining in supematant 0 40 and ZEA bound in residue. '"O @Significant difference between 1;I
<
ZEA alone and ZEA in mixture. � 30
@ T
*
-
T Tc-The percentages are expressed as N '#.
means value using OTA 20
-
1- - [I_*
_ remaining in supernatant andOTA bound in residue.
*Significant difference between 10
-
1- - ,_OTA alone and OTA in mixture
0
YI Y2
ofYCW both with AFBl and ZEA. High quantity ofYCW (50 mg/ml) even in buffer solution lowered significantly the pH, modifying the analytical performance leading to incorrect analytical :findings and as consequence to a rnisclassification ofbinder ability. Such interference with analytical method of OTA has been previously observed (Bazin et al. 2013). Yiannikouris et al. 2013 excluded data obtained with pH 7 because ZEA eluted in two peaks instead of a single peak with the pH values of 3.0 and 5.0. Another interference with analytical method was due to the precipitation of the myco toxins over some concentrations (> 10 µg/ml for OTA; >60 µg/ml ZEA). This was also observed by Yiannikouris et al. (2013), who reported a large variation between replicate samples from 60 µg/ml of ZEA. Thus, for avoiding any interference for the subsequent experiments, the incubations were done with 5 mg/ml of binder in the presence of the mycotoxins solved in methanol.
Secondly, the best incubation time was checked. By vary ing the incubation time, no significant difference in the amount of AFB1 , ZEA or OTA removed from YCW were
observed. The process was fast, since in less than 5 min ( data not shown) the YCW was able to bind the same amount of mycotoxin as in 90 min. This result was consistent with those of Pizzolitto et al. (2012) and Shetty et al. (2007), who have not observed differences between 1 min and 6 h, or 0.5 and 12 h of time contact, respectively. Fifty minutes has been chosen for the following experiments.
Third, the modelling of mycotoxin adsorption was per formed to characterize OTA and ZEA adsorption at neutral, acidic and basic pHs and with increasing mycotoxin concen trations to evaluate the robustness of the method for forthcom ing assessments of new mycotoxin adsorbents. There was almost no pH effect on ZEA adsorption ( eventhough the binding was slightly better at pH 5) and the binding capacity
I
T /ri) @ I_ 1 T l. T;r.l
*
-
T @ l.1
*
---:-1 --*
,:1
*
ÎT1
@L
-
,_-
tr._ - --
-,,-
- -l.-
,_-
-
- --1
-
H-
--
--
,
-
-
1- - --
--
1- - --
--
,
_
-
1- - --
--
1- - --
->--,
_
>-- 1- - - >-- - >-- 1- - - >-- -Y3 Y4 YS Y6 Y7 Y8 Y9is almost independent of the concentrations of ZEA. In con trast, OTA was only correctly bound at pH 3. Moreover, OTA binding was dependent on its concentration (0.05-10 µg/ml). It was always linear at low values of OTA and showed the transition to a plateau with higher toxin concentrations. Such curve can be modelled using Hill model (data not shown) indicating several binding sites, and a putative cooperative effect. The slight decrease observed with highest OTA dose could be explained by the fact that yeast has several binding sites for OTA, and a cooperative effect play a major role. The first molecule of OTA bound on YCW modifies the affmity for the following one. Even a decreasing capacity with OTA concentration over 5 µg/ml suggests a dynamic equilibrium between the binder concentration and relative binding effi ciency. The process reached equilibrium between bound toxins (occupied sites) and unbound toxins (free sites) and therefore a reversible process could be involved as it was demonstrated with AFB1 by Pizzolitto et al. (2012) and with
ZEA by Yiannikouris et al. (2013). These results indicate that the sorption capacity of yeast products depends greatly on the initial concentration of the mycotoxin. Therefore, a compari son from single tests, frequently used in previous studies by assuming the linear sorption of the mycotoxin, is not adequate. When the isotherms are not linear, the com parison of adsorption capacity of yeast products could lead to opposite conclusions, depending on the initial mycotoxin concentration tested. Thus, adsorption of my cotoxin by yeast products was not a linear phenomenon, which means that isotherm studies are necessary to com pare the sorption capacity of yeast products. Analysis of individual results of the efficient isotherm models confirmed that adsorption capacity and affinity depend on the interac tions between mycotoxin, adsorbent and pH. Therefore, iso therm models to describe adsorption equilibrium cannot be
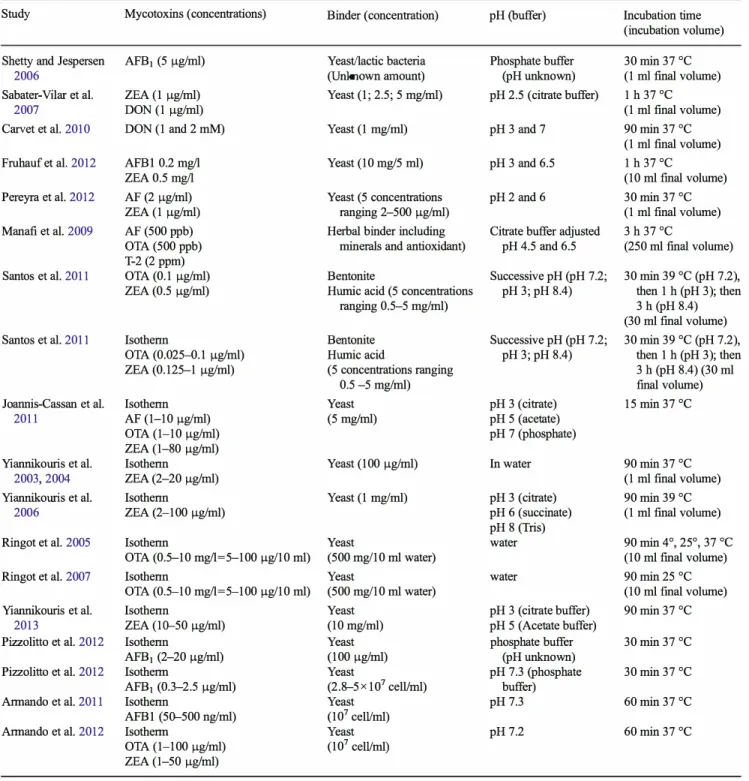
Table 2 Comparison of the method use for binding screening
Study Mycotoxins (concentrations) Binder (concentration) pH (buffer) Incubation time (incubation volume) Shetty and Jespersen AFB1 (5 µg/ml) Yeast/lactic bacteria Phosphate buffer 30 min 37 °C
2006 (Unknown amount) (pH unknown) (1 ml final volume) Sabater-Vilar et al. ZEA (! µg/ml) Yeast (1; 2.5; 5 mg/ml) pH 2.5 (citrate buffer) 1 h 37 °C
2007 DON (1 µg/ml) (1 ml final volume) Carvet et al. 2010 DON (1 and 2 mM) Yeast (1 mg/ml) pH 3 and 7 90 min 37 °C
(1 ml final volume) Fruhauf et al. 2012 AFBI 0.2 mg/1 Yeast (10 mg/5 ml) pH 3 and 6.5 1 h 37 °C
ZEA 0.5 mg/1 (10 ml final volume) Pereyra et al. 2012 AF (2 µg/ml) Yeast (5 concentrations pH2 and 6 30 min 37 °C
ZEA (1 µg/ml) ranging 2-500 µg/ml) (1 ml final volume) Manafi et al. 2009 AF (500 ppb) Herbai binder including Citrate buffer adjusted 3 h 37 °C
OTA (500 ppb) minerais and antioxidant) pH 4.5 and 6.5 (250 ml final volume) T-2 (2 ppm)
Santos et al. 2011 OTA (0.1 µg/ml) Bentonite Successive pH (pH 7.2; 30 min 39 °C (pH 7.2),
ZEA (0.5 µg/ml) Humic acid (5 concentrations pH3;pH 8.4) then 1 h (pH 3); then ranging 0.5-5 mg/ml) 3 h (pH 8.4)
(30 ml final volume) Santos et al. 2011 Isothenn Bentonite Successive pH (pH 7.2; 30 min 39 °C (pH 7.2),
OTA (0.025-0.1 µg/ml) Humic acid pH3;pH 8.4) then 1 h (pH 3); then ZEA (0.125-1 µg/ml) ( 5 concentrations ranging 3 h (pH 8.4) (30 ml
0.5 -5 mg/ml) final volume) Joannis-Cassan et al. lsothenn Yeast pH 3 (citrate) 15 min 37 °C
2011 AF (1-10 µg/ml) (5 mg/ml) pH 5 (acetate) OTA (1-10 µg/ml) pH 7 (phosphate) ZEA (1-80 µg/ml)
Yiannikouris et al. lsothenn Yeast (100 µg/ml) In water 90 min 37 °C
2003,2004 ZEA (2-20 µg/ml) (1 ml final volume) Yiannikouris et al. Isothenn Yeast (1 mg/ml) pH 3 (citrate) 90 min 39 °C
2006 ZEA (2-100 µg/ml) pH 6 (succinate) (1 ml final volume) pH 8 (Tris)
Ringot et al. 2005 lsothenn Yeast water 90 min 4°, 25°, 37 °C
OTA (0.5-10 mg/1=5-100 µg/10 ml) (500 mg/10 ml water) (10 ml final volume) Ringot et al. 2007 Isothenn Yeast water 90 min 25 °C
OTA (0.5-10 mg/1=5-100 µg/10 ml) (500 mg/10 ml water) (10 ml final volume) Yiannikouris et al. Isothenn Yeast pH 3 ( citrate buffer) 90 min 37 °C
2013 ZEA (10--50 µg/ml) (10 mg/ml) pH 5 (Acetate buffer)
Pizzolitto et al. 2012 lsothenn Yeast phosphate buffer 30 min 37 °C
AFB1 (2-20 µg/ml) (100 µg/ml) (pH unknown)
Pizzolitto et al. 2012 lsotherm Yeast pH 7.3 (phosphate 30 min 37 °C
AFB1 (0.3-2.5 µg/ml) (2.8-5 X 10⁷ cell/ml) buffer)
Armando et al. 2011 lsothenn Yeast pH 7.3 60 min 37 °C
AFBl (50--500 ng/ml) (107 cell/ml)
Armando et al. 2012 Isotherm Yeast pH7.2 60 min 37 °C
OTA (1-100 µg/ml) (107 cell/ml) ZEA (1-50 µg/ml)
generalized, but serve as a valuable tool to identify and com pare new products (Joannis-Cassan et al. 2011).
>OTA and involved both the (1-3)-13-o-glucans and the (1-6)-/3-0-glucans. Alkaline conditions, owing to their destructuring action on glucans, were favorable only for the adsorption of patulin (Guo et al. 2012). Using molecular mechanics, Yiannikouris et al. (2004, 2006) found that hy droxyl, ketone, and lactone groups are involved in the forma tion of both hydrogen bonds and van der Waals interactions between aflatoxins B1, deoxynivalenol, ZEA and patulin, and The stereo chemistry and hydrophobie properties ofmyco
toxins are of prime importance and account for the differences in their affmity for !3-0-glucans. The environmental condi tions such as pH were determining for the stability of the toxin-glucan complexes generated. Acid and neutral condi tions gave the highest affinity rates for AFB1 >deoxynivalenol
j3-o-glucans (Yiannikouris et al. 2006). Protonation of OTA is changed in the pH course, as it has a pKa of 4 .4 and 7.3. At pH
3.0, ahnost all OTA will be in the neutral (non-charged) form, while at pH 7.4 it will be present as a monoanion or a dianion, and at pH 8.4 most OTA will be in the dianion form (Santos et al. 2011; Bazin et al. 2013).
As the balance ( amount of mycotoxin adsorbed + amount in the supernatant) was correct and the acidic pH was the best one for the three mycotoxins, we compared several yeast derivatives by incubating fixed amount of mycotoxins (0.5 µg/ml of OTA or AFB1 and 20 µg/ml of ZEA, individ
ually or in binary or ternary mixture) and analysing the bind
ing capacity taking into account the mycotoxins remaining in the supematant and bound on the residue. This method allows making discrimination between the different products against the three mycotoxins tested. It is also applicable to analyse binding capacity ofyeast-based products in multi contamination conditions and gives a piece of information about interaction ( cooperative effect/competition).
The products Y9 and Y 4 (YCW from baker) and Y 5 (GSH yeast), had a similar efficacy for ZEA and OTA binding. Products Yl, Y2 (YCW from brewer), Y3 (Se yeast), Y7 (YCW from brewer) and Y8 (alcohol yeast) bound more OTA than ZEA. On1y Y6 (YCW from baker) bound a little bit more ZEA than OTA. This later product Y 6 was the best binder for ZEA, whereas it was the worst for AFB1• Product
Y5 (GSH yeast) seems to be an interesting product as it boundthe three toxins with an efficacy close to 50 % (AFB1)
and over 60 % (ZEA and OTA). In the same way, product Y3 (SE yeast) was a relatively interesting binder against AFB1,
and good binder for the two others mycotoxins. Nevertheless, these two latter products are not YCW but enriched yeasts. Thus the decrease could be due to some biotransformation of the mycotoxins and not exlusively due to binding.
In general, when the binding of ZEA increased in the presence of the two other toxins, the binding of OTA de creased (i.e., Yl [YCW brewer], Y9 [YCW baker]). In case of an increase of ZEA binding associated with a decrease of OTA binding ( or the reverse), this means that both toxins act on the same binding site, but with a different affinity; or two binding sites exit and the binding of one mycotoxin modifies the binding capacities of the other site (cooperative affect).
There was also a competition between OTA and AFB1.
Although AFB1 binding on Yl and Y9 was decreased in the
presence of ZEA, this decrease was no more pronounced when OTA was also present. In contrast, with product Y7 the binding of both ZEA and OTA increased, indicating a cooperative effect.
Product Y6 (YCW baker) was the sole product for which ZEA's binding increased in the presence of the two other mycotoxins without decreasing the adsorption either of AFB1 or OTA. Probably the binding sites are multiple and
different for each mycotoxin.
These data could be explained by cooperative inter action. The biosorption capacity of yeast 13-o-glucans in vitro was shown to be modulated by the amount of ZEA added to the medium according to a cooperative phenomenon. The binding of the first mycotoxin mole cules induces conformation changes in j3-glucans that facilitates access to new sites of fixation improving binding efficiency until saturation of all sites of adsorp tion (Yiannikouris et al. 2003, 2004).
In this study, no correlation could be draw between myco toxins binding capacity and the amount of glucans and/or mannan. This data is in line of that of Carvet et al. (2010), who tested different 13-glycans and shown that bound type (1-3 or 1-6) or the ramifications might not be sufficient criteria to characterize their adsorption prop erties. In contrast to ZEA binding, the AFB1 binding did not
correlate with the mannoligosaccharides (MOS) and glucan content of the investigated products (Fruhauf et al. 2012; Pizzolitto et al. 2012).
Pereyra et al. 2012 tested AFB1 and ZEA binding capacity
of two YCWs differing in their chemical compositions. The first YCW contained5.9 and 17.4 % of mannans and 13-glucans while the second YCW contained a higher percentage ofmannans (21 %) and 13-glucans (23 %), respectively. The both YCWs adsorbed ZEA at the studied pH conditions. Conceming ZEA at pH 2 there was a much more pronounced cooperative effect than at pH 6 with the first YCWl. It was the opposite for second YWC. The authors concluded that ZEA binding can be attributed to the presence of j3-glucans in the walls as the effect of pH on binding constants was systematic and similar for both YCW. They bound both a similar amount of AFB1 at pH 2. The cooperative indexes
obtained for both adsorbents were higher at pH 2. In contrast, they bound much less AFB1 at pH 6. The interaction
of AFB 1 with glucomannan ofYCW was presumably through hydrogen bonds (Pereyra et al. 2012).
Altogether, to be able to obtain a good and reproducible response to screen different adsorbent materials, ZEA, AFB1 or OTA should be dissolved in methanol, because
dissolution directly in buffer induces a precipitation and distorts the results. Mycotoxins should be dissolved in methanol to appropriate concentration (lOOx the final concentration required in the test tube) and 10 µl of this solution is added to the yeast-based product (5 mg) pre-incubated in the buffer (990 µl). In these conditions, the balance (amount of mycotoxin adsorbed + amount in the supematant) is correct. With this protocol, it is possible to make a pre-screening of adsorbent capacities against several mycotoxins present together in range of my cotoxin concentrations corresponding to permitted value in food and feed. This method will be applied to other adsorbent materials such as bentonite and humic acid, and to other mycotoxins including deoxynivalenol or fumonisins.
Acknowledgments This study was supported by Program county
"Midi-Pyrénées" (Food Safety, 2008-2012). ARC (association de la
recherchecontre le cancer, France) is acknowledged for KHM's doctoral
grant. The authors thank GM for English proofreading.
References
Armando MR, Pizzolitto RM, Escobar F, Dogi RP, Peirano MS, Salvano MA, Sabini II, Combina M, Dalcero AM, Cavaglieri LR (2011)
Saccharomyces cerevisiae strains from animal environment with
in vitro aflatoxin B 1 binding ability and antipathogenic bacterial influence. World Mycotoxin J 4:59--68
Armando MR, Pizzolitto RM, Dogi RP, Cristofolini A, Merkis C, Polini V, Dalcero AM, Cavaglieri LR (2012) Adsorption of ochratoxin A and zearalenone by potential probiotic Saccharomyces cerevisiae strains and its relation with cell wall thickness. J Appt Microbiol 113:256--264
Avantaggiato G, Solfrizzo M, Visconti A (2005) Recent advances of the use of adsorbent materials for detoxification of Fusarium myco toxins. Food Addit Contam 22:379-388
Bazin I, Marquis-Faucet V, EIK.houry M, Marty JL, Pfohl-Leszkowicz A (2013) Impact of pH on the stability and cross reactivity ofochra toxin A and Citrinin. Toxins 5:2325-2340
Binder EM (2007) Managing the risk of mycotoxins in modern feed production. Anim Feed Sei Technol 133:149-166
Bueno D, Casale C, Pizzolitto R, Salvano M, Oliver G (2007) Physical adsorption of aflatoxin B1 by lactic acid bacteria and Saccharomyces
cerevisiae: a theoretical mode!. J Food Prot 70(9):2148--2154
Carvet S, Laurent N, Videmann B, Mazallon M, Lecœur S (2010) Assessment of deoxynivalenol (DON) adsorbents and characterisa tion of their efficacy using complementary in vitro tests. Food Addit Contam 27(1):43-53
Dakovic A, Tomasevic-Canovic M, Dondur V, Rottinghaus GE, Medakovic V, Zaric S (2005) Adsorption of mycotoxins by organozeolites. Colloids SurfB: Biointerfaces 46(1):20-25 Di Natale F, Gallo M, Nigro R (2009) Adsorbents selection for aflatoxins
removal in bovine milks. J Food Eng 95:186--191
EFSA (2004a) Opinion of the scientific panel on contaminants in the food chain on a request from the Commission related to Zearalenone as undesirable substance in animal feed. EFSA J 89:1-35
EFSA (2004b) Opinion of the scientific panel on contaminants in the food chain on a request from the Commission related to ochratoxin A (OTA) as undesirable substance in animal feed. EFSA J 101:1-36 EFSA (2009). Review of mycotoxin-detoxifying agents used as feed
additives: mode of action, efficacy and feed/food safety. Scientific report subnùtted to EFSA. (http://ww w.efsa.europa.eu/)
Fink-Gremmels J, Malekinejad H (2007) Clinical effects and biochenùcal mechanisms associated with exposure to the mycoestrogen zearalenone. Anim Feed Sei Technol 137:326--341
Firmin S, Gandia P, Morgavi DP, Houin G, Jouany JP, Bertin G, Boudra H (2010) Modification of aflatoxin BI and ochratoxin A toxicokinetics in rats administered a yeast cell wall preparation. Food Addit Contam 27:153-1160
Firmin S, Morgavi DP, Yiannikouris A, Boudra H (2011) Effectiveness of modified yeast cell wall extracts to reduce aflatoxin B1 absorption in dairy ewes. J Dairy Sei 94:5611-5619
Fruhauf S, Schwartz H, Ottner F, K.rska R, Vekiru E (2012) Yeast cell based feed additives: studies on aflatoxin B1 and zeralenone. Food Addit Contam 29(2):217-231
Guo C, Yue T, Hatab S, Yuan Y (2012) Ability of inactivated yeast powder to adsorb patulin from apple juice. J Food Protect 75(3): 585-590
Huwig A, Freimund S, K.iippeli 0, Dutler H (2001) Mycotoxin detoxi cation of animal feed by different adsorbents. Toxicol Lett 122: 179-188
!ARC, International Agency for Research on Cancer, Geneva. 1993, 56, p. 489.
Joannis-Cassan C, Tozlovanu M, Hadejba-Medjdoub K, Ballet N, Pfohl Leszkowicz A (2011) Binding of Zearalenone, Aflatoxin B1 and Ochratoxin A by yeast based-products: a rapid method for quantifi cation of adsorption performance. J Food Prot 74(7):1175-1185 Jouany JP (2007) Methods for preventing, decontaminating and mini
nùzing the toxicity ofmycotoxins in feeds. Anim Feed Sei Technol 137:342-362
Kabak B, Dobson ADW, Var I (2006) Strategies to prevent mycotoxin contamination of food and animal feed: a review. Crit Rev Food Sei Nutr 46:593-619
Kabak B, Dobson ADW (2009) Biological strategies to counteract the effects ofmycotoxins. J Food Prot 72:2006--2016
Kararnan M, Basmocioglu H, Ortatali M, Oguz H (2005) Evaluation of the detoxifying effect of yeast glucomannan on aflatoxicosis in broilers as assessed by gross exanùnation and histopathology. Br Poult Sei 46:394--400
Keppel G (1973) Design and analysis: researcher's handbook. Prentice Hall, Englewood Cliffs, NJ, pp 658-663
Kollar R, Reinhold BB, Petrakova E, Yeh HJC, Ashwell G, Drgonova J, Kapteyn JC, Klis FM, Cabib E (1997) Architecture of the yeast cell wall. i3(!,6)-o-Glucan interconnects mannoprotein, 13-(1,3)-o-glu can, and chitin. J Bio! Chem 272:17762-17775
Kolosova A, Stroka J (2011) Substances for reduction of the contamina tion offeed by mycotoxins: a review. World Mycotoxin J 4(3):225-256
Korosteleva SN, Smith TK, Boermans HJ (2007) Effects of feed borne
Fusarium mycotoxins on the performance, metabolism, and immu
nity of dairy cows. J Dairy Sei 90:3867-3873
Kurtbay H, Bekçi Z, Merdivan M, Yurdkoç K (2008) Reduction of ochratoxin A levels in red wine by bentonite, modified bentonite and chitosan. J Agric Food Chem 56(7):2541-2545
Manafi M, Narayanaswamy HD, Pirany N (2009) In vitro binding ability of mycotoxin binder in commercial broiler feed. Afr J Agric Res 4(2):141-143
Manners DJ, Masson AJ, Patterson JC (1973) The structure of a 13(1,3)-o glucan fromyeast cell walls. Biochemistry Jl35:19-30
Matur E, Ergul E, Akyazi I, Eraslan E, Cirakli ZT (2010) The effects of
Saccharomyces cerevisiae extract on the weight of some organs,
liver, and pancreatic digestive enzyme activity in breeder hens fed diets contarninated with aflatoxins. Poult Sei 89:2213-2220 Mirocha CJ, Christensen CM, Nelson GH (1971) Alga! and fungal toxins.
In: Kadis S, Ciegler A, Ajl SS (eds) Microbial toxins, Vol. VII. New York, Acadenùc Press, pp 107-117
Ostry V, Malir F, Ruprich J (2013) Producers and important dietary sources ofochratoxin A and citrinin. Toxins 5:1574-1586 Pereyra CM, Cavaglieri LR, Chiacchieria SM, Dalcero A (2012)
The corn influence on the adsorption levels of aflatoxin B1 and zearalenone by yeast cell wall. J Appl Microbiol 114: 655-662
Pfohl-Leszkowicz A, Manderville RA (2007) Review on ochratoxin A: an overview on toxieity and carcinogenicity in animais and humans. Mol Nutr Food Res 51:61-99
Pfohl-Leszkowicz A, Manderville RA (2012) An update on direct genotoxicity as molecular mechanism of ochratoxin A carcinoge nicity. Chem Res Toxicol 25:252-262
Pizzolitto RM, Bueno DJ, Armando MR, Cavaglieri L, Dalcero AM, Salvano MA (2011 ). Binding of aflatoxin B1 to lactic acid bacteria and Saccharomyces cerevisiae in vitro: a useful mode! to determine the most efficient nùcroorganism, aflatoxins - biochenùstry and molecular biology. Ramon G. Guevara-Gonzalez (Ed.), ISBN: 978-953-307-395-8, InTech,
Pizzolitto RM, Armando MR, Combina M, Cavaglieri LR, Dalcero AM, Salvano MA (2012) Evaluation of Saccharomyces cerevisiae strains as probiotic agent with aflatoxin B1 adsorption ability for use in
poultry feedstuffs. J Environ Sei Health Part B 47:933-941 Regulation (EC) No 386/2009 of 12 May 2009 amending Regulation
(EC) No 1831/2003 of the European Parliament and of the Council as regards the establishment of a new functional group of feed additives. Official Journal of the European Union. Lll8/66. Ringot D, Lerzy B, Bonhoure JP, Auclair E, Oriol E, Larondelle Y (2005)
Effect of ternperature on in vitro ochratoxin biosorption onto yeast cell wall derivatives. Process Biochem 40:3008-3016
Ringot D, Lerzy B, Chaplain K, Bonhoure JP, Auclair E, Larondelle Y (2007) In vitro biosorption of ochratoxin A on the yeast industry by products: comparison of isotherm models. Bioresour Technol 98: 1812-1821
Sabater-Vilar M, Malekinejad H, Sehnan MH, van der Doelen MA, Fink Gremmels J (2007) In vitro assessment of adsorbents airning to prevent deoxynivalenol and zearalenone mycotoxicoses. Mycopathologia 163 :81-90
Santos RR, Vermeulen S, Haritova A, Fink-Gremmels J (2011) lsotherm modeling of organic activated bentonite and humic acid polymer used as mycotoxin adsorbents. Food Addit Contam 28(11):1578-1589 Shetty PH, Jespersen L (2006) Saccharomyces cerevisiae and lactic
bacteria as potential mycotoxin decontamination agents. Trends Food Sei Technol 17:48-55
Shetty PH, Hald B, Jespersen L (2007) Surface binding ofaflatoxin B1 by
Saccharomyces cerevisiae strains with potential decontaminating abilities in indigenous fermented food. Int J Food Microbiol 113: 41-46
Varga J, Rigo K, Teren J, Mesterhazy A (2001) Recent advances in ochratoxin research: Il. Biosynthesis, mode of action and control of ochratoxins. Cereal Res Commun 29:93-100
Varga J, Rigo K, Toth B, Teren J, Kozakiewicz Z (2003) Evolutionary relationships among Aspergillus species producing economically important mycotoxins. Food Technol Biotechnol 41:29--36 Ye S-Q, Lv X-Z, Zhou A-G (2009) ln vitro evaluation of the efficacy of
sodium humate as an aflatoxin B1 adsorbent. Australian journal of
basic and applied sciences 3(2):1296--1300
Yiannikouris A, Jouany JP (2002) Mycotoxins in feeds and their fate in animais: a review. Anim Res 51:81-99
Yiannikouris A, Poughon L, Cameleyre X, Dussap CG, François J, Bertin G, Jouany JP (2003) A nove! technique to evaluate interactions between Saccharomyces cerevisiae cell wall and mycotoxins: appli cation to zearalenone. Biotechnol Lett 25:783-789
Yiannikouris A, André G, Buléon A, Jeminet G, Canet I, François J, Bertin G, Jouany JP (2004) Comprehensive conformational study of key interactions involved in zearalenone complexation with beta-o glucans. Biomacromolecules 5:2176--2185
Yiannikouris A, André G, Poughon L, Francois J, Dussap CG, Jeminet G, Bertin G, Jouany JP (2006) Chemical and conformational study of the interactions involved in mycotoxin complexation with beta-D glucans. Biomacromolecules 7:1147-1155
Yiannikouris A, Kettunen J, Apajalahti E, Pennala A, Moran CA (2013) Comparison of the sequestering properties of yeast cell wall ex tract and hydrated sodium calcium aluminosilicate in three in vitro models accounting for the animal physiological bioavailability of zearalenone. Food Addit Contam 30(9):1641-1650
Zekovic DB, Kwiatkowski S, Vrvic MM, Jakovljevic D, Moran CA (2005) Natural and modified (1-3)-beta-o-glucans in health promo tion and disease alleviation. Crit Rev Biotechnol 25:205-230 Zinedine A, Soriano JM, Molto JC, Mafies J (2007) Review on the
toxicity, occurrence, metabolism, detoxification, regulations and intake of zearalenone: an oestrogenic mycotoxin. Food Chem Toxicol 45: 1-18