Analysis of a Diagnostics Firm's Pre-Analytical Processes By
Kevin M. Thomas, P.E.
B.S. Mechanical Engineering, United States Coast Guard Academy, 2009
Submitted to the MIT Sloan School of Management and the Department of Mechanical Engineering in partial fulfillment of the requirements for the degrees of
Master of Business Administration and
Master of Science in Mechanical Engineering
in conjunction with the Leaders for Global Operations Program at the
MASSACHUSETTS INSTITUTE OF TECHNOLOGY
JUN 02 2016
LIBRARIES
ARCHiVES
MASSACHUSETTS INSTITUTE OF TECHNOLOGY June 2016
CKevin M. Thomas, 2016. All rights reserved.
Signature redacted
tDepartm eprof Mechanicaf 'pgineering, MIT Sloan School of Management 14 Mar 2016
Certified by
Signature redacted
I_ Steven Spear, Thesis Supervisor
Senior Lectur ,MIT Sloan School of Management, Engineering Services Division
Signature
redacted
Steven B. Leeb, Thesis Supervisor Professor of EECS and Mechanical Engineering
gnature redacted_______
Maura Herson, Director of MIT Sloan MBA Program MIT Sloan School of Management
_____
Signature redacted
__Rohan Abeyaratne, Chairman, CoJijittee of Graduate Students Department of Mechanical Engineering
The author heeby grants to MIT permission to reproduce and to
dfftribute Publicly paper 'nd electronic copies of this thesis documert Signature of Author
Certified by
Accepted by
Accepted by
Analysis of a Diagnostics Firm's Pre-Analytical Processes By
Kevin M. Thomas, P.E.
Submitted to the MIT Sloan School of Management and the Department of Mechanical Engineering on March 14, 2016,
in partial fulfillment of the requirements for the degrees of Master of Business Administration
and
Master of Science in Mechanical Engineering ABSTRACT
Quest Diagnostics provides diagnostic information to clinicians, allowing them to make informed decisions on the appropriate course of treatment for their patients. Quest advertises an 8am next-day turnaround time for a subset of clinical tests, a service that provides competitive advantage for Quest. When this 8am turnaround time goal is missed, it causes ripple effects throughout the customer support organization resulting from increased client complaints. This research approaches Quest's late-release challenges through an analysis of phlebotomy services, courier route planning, and specimen accessioning to find precisely the source and cause of challenges preventing Quest from achieving their turnaround time goals.
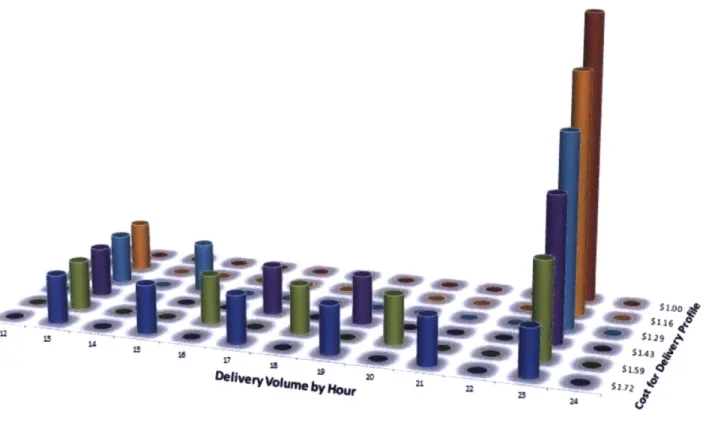
Prior to this research, Quest hypothesized that their logistics network could provide a consistent in-flow of patient specimens into their Marlborough, MA facility, improving the lab's likelihood of reaching their turnaround time goals. A simulation of a new demand-focused vehicle routing solution suggested that creating routes to provide a steady inflow of specimens would increase operating costs by 72%; what appeared to be an attainable, low-cost solution was found to be quite the opposite. We then provide an analysis of pre-analytical processes outside of logistics. Patient service centers (PSC) will soon provide 47% of the total specimen-volume to the Marlborough laboratory compared to 36% currently, thus evaluation of PSC processes and methodologies were conducted to identify ways to release a larger percentage of specimen volumes during midday courier pickups. Recommendations for process improvements to provide couriers with more patient samples during midday pickups are provided. Specimen accessioning processes and staffing were also analyzed, revealing that between 17%-24% of the subject tests results were unable to be resulted prior to 8am due to insufficient staffing for a second-stage accessioning task.
Alterations to Quest's logistics network proved to be costly and low-impact, whereas slight alterations to phlebotomy-service processes and in-lab staffing could provide far higher value to Quest's customers with less impact to operations. By redirecting their focus to these other pre-analytical processes, Quest could focus their efforts on higher impact, lower cost options to improve operations and meet their turnaround time goals.
Thesis Supervisor: Steven Spear
Title: Senior Lecturer, Massachusetts Institute of Technology. Senior Fellow, Institute for Healthcare Improvement
Thesis Supervisor: Steven Leeb
Title: Professor of Electrical Engineering and Computer Science and Mechanical Engineering, Massachusetts Institute of Technology.
ACKNOWLEDGEMENTS
Quest Diagnostics, Inc. provided financial and technical support for this research. I thank Quest for their assistance, as well as for their dedication to bettering the quality of healthcare in the United States. The Marlborough staff was extremely supportive, providing me with sufficient autonomy to put in effort where I saw fit. The Marlborough lab is a fantastic location for continued research with future LGO students and I hope others have the same opportunities that I was fortunate enough to have there.
Thank you to the LGO program staff for guiding me towards completing this research and for continuing successful relationships with our industry partners. Thank you to my peers at MIT who shaped my research and helped me through the challenges I faced. To Steve Leeb, thank you for advising this research and for all you have done for me since 2009. To Steve Spear, your research frameworks were crucial in allowing me to get the most out of my time at Quest.
To my wife and sons, thank you for making my life whole. Without you, I would be a much different man.
Contents
Contents ... 7 List of Figures...11 List of Tables ... 13 1. Introduction ... 15 1.1 Thesis Objectives ... 15 1.2 Thesis Overview ... 16 1.3 Literature Review ... 161.3.1 Vehicle Route Planning ... 16
1.3.2 M edical Laboratories ... 18
1.3.3 Patient Service Centers ... 18
2. Com pany Background...21
2.1 H ealthcare and the Diagnostics Industry ... 21
2.2 Quest's Organizational Specifics ... 22
2.2.1 General Organization ... 22
2.2.2 Functional Area Objectives... 23
2.2.3 Recent D evelopm ents ... 23
2.3 The N orthern Business Unit... 24
2.3.1 Consolidation of the N ew England Business... 24
2.3.2 Autom ation and the Lab of the Future ... 24
3. D iagnostic D elivery Process ... 27
3.1 Service Levels and Specim en Types... 27
3.1.1 Service levels and Client Expectations ... 27
3.1.2 Specim en Types ... 28
3.2 Patient Service Centers and In Office Phlebotom ists ... 28
3.3 Logistics Operations at Quest Diagnostics ... 29
3.3.1 Route M aintenance ... 29
3.4 Specim en M anagem ent ... 31
3.4.1 Accessioning, Overview ... 31
3.4.2 Requisition Types ... 32
3.4.3 A ccessioning Stations ... 32
3.5 Specim en Testing w ithin Clinical Pathology... 32
3.5.1 Hem atology...32
3.5.2 s ... 33
3.6 Test Release ... 33
4. Formulation of New Demand-focused VRPTW... 35
4.1 Objective Function...36
4.2 M odel Constraints ... 37
4.3 Application of the DVRPTW ... 39
4.4 Com paring Cost and Arrival Profile ... 40
4.5 Results and Findings ... 43
5. Assessing Opportunities in Specimen Management and Patient Service Centers...45
5.1 Data Collection for Patient Services and Specimen Management...45
5.2 Patient Service Center Opportunities ... 45
5.2.1 D aily Arrival Patterns and Requisition Volum es... 46
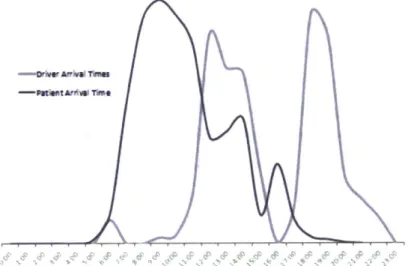
5.2.2 M anifesting Process ... 46
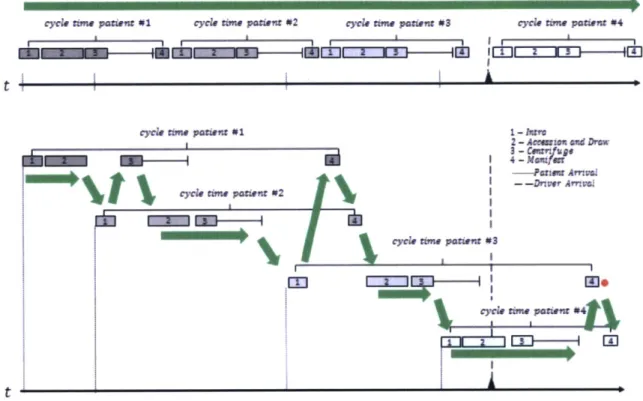
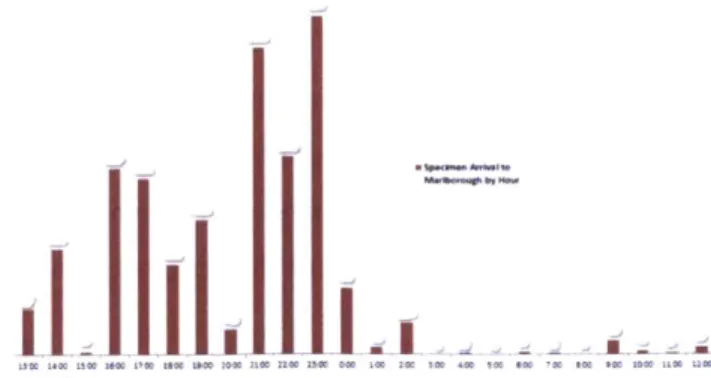
5.2.3 Results and Findings ... 48
5.3 Specim en M anagem ent ... 49
5.3.1 Manual Requisitions and their Impact on Specimen Management...50
5.3.2 Throughput and Staffing ... 52
5.3.3 Transitioning M anual accounts to Electronic ... 56
5.3.4 Results and Findings ... 57
6. Conclusion and Recom m endations... 59
6.1 Sum m ary of Findings and Recom m endations ... 59
6.1.2 Patient Service Centers ... 60
6.1.3 Specim en M anagem ent ... 60
6.2 Turnaround Tim e in a Com petitive Healthcare M arketplace ... 61
6.3 Closing Rem arks ... 62
Appendix A ... 63
Appendix B ... 65
Appendix C ... 71
List of Figures
Figure 3-1: Relationship between the various software tools within Quest Logistics. Size denotes relative reliability with regards to its primary function, dashed line denotes poor communication, and bold lines denote efficient com m unication... 31 Figure 4-1: Six arrival patterns with associated cost. The Total Cost constraint in equiation (4-10) was m anipulated to form the different arrival scenarios ... 39 Figure 5-1: Average patient arrival profile (hourly on left axis and cumulative on right) to a New England P S C ... 4 6 Figure 5-2: Comparison between patient arrival times and courier arrival times... 47 Figure 5-3: One-piece flow (upper) versus current process (lower)... 48 Figure 5-4: Specimen Arrival profile on 6/17/15 for Marlborough lab... 49 Figure 5-5: Graph of manual requisition average arrival profile, A-Station hourly throughput, and B station hourly throughput as of 6/11/15 ... 50 Figure 5-6: Graph showing average daily A-station backlog based on hourly differences between
expected specimen volumes arriving and average productivity. ... 51 Figure 5-7: Graph comparing A-station backlog to B-station backlog. B-station backlog was calculated by comparing A-station throughput to B-station throughput by hour. ... 52 Figure 5-8: Basic in-lab manual requisition processing pathway... 53 Figure 5-9: Average queue time for Analyzer A (Blue) and Analyzer B (Red) for 8am TAT testing... 55 Figure 5-10: Comparison of current versus future stat manual specimen flow with relative impact on A-station backlog based on an un-changed staffing model after a set of clients transitioned from manual to electronic requisitions. ... 56
List of Tables
Table 3-1: Comparison of supply chains [30]... 29 Table 3-2: Overview of Quest's logistics-related software. ... 31 Table 3-3: Overview of accessioning stations within specimen management's clinical operations. ... 32 Table 4-1: Relative improvement gains observed over a seven-month period between November 2014 and Jun e 2 0 15 . ... 3 5 Table 4-2: Program Output for stop sequence for minimizing the maximum hourly volume coming into the dep o t n od e. ... 4
1
Table 4-3: Program Output for stop sequence for maximizing the maximum hourly volume coming into the dep ot n od e. ... 4 1 Table 4-4: Program solution scenario to minimize cost. This solution scenario is identical to the solution show n in T ab le 4 -3... 42 Table 4-5: Program solution scenario to maximize total cost. Compare this solution to Table 4-2... 42 Table 5-1: Simplified single-patient process for phlebotomist at a Quest PSC... 46 Table 5-2: Comparison between A-station completion time, B-station completion time, and analyzer completion time for a sample of 8AM TAT tests. Red font indicates those times where the analyzers result tests before B-station completion time... 54 Table 5-3: Average queue time for 8am TAT platforms relative to A-station accessioning time for a sample of 8AM TAT tests. Red font identifies maximum queue times, green identifies minimum queue tim e s... 5 5
Chapter
1
Introduction
In an ideal world, doctors would receive the diagnostic results they need right away', allowing them to change the course of treatment as necessary to treat their patients as soon as possible. Because instant turnaround of lab tests at the point-of-care is extremely difficult to manage [1], clinicians often turn to companies like Quest Diagnostics to offset costs and provide diagnostic insights. Patients provide samples to clinicians or at off-site outpatient phlebotomy locations at the doctor's request. Those specimens are then retrieved by a courier and brought to a laboratory. Upon entering the laboratory, each sample is individually checked for accuracy of demographic information, centrifuged if necessary, aliquoted (i.e. divided) into a sufficient number of test tubes, and released to the technical laboratory. The technical laboratory will then analyze the sample and generate diagnostic information for release to the doctor.
The research described in this thesis describes how the processes separating the doctor from their patients' results can be improved so that doctors receive clinical test results before they come into work the following day. Quest Diagnostics, a corporation that provides phlebotomy, courier, diagnostic testing, and diagnostic information delivery services, proved to be an ideal match for this research.
1.1 Thesis Objectives
Quest Diagnostics operates a fast-paced, low error-tolerance business that affects millions of patients each year. In order to continue to provide the highest service levels to their clients, Quest requires in-depth analysis of pre-analytical phlebotomy processes, logistics route planning, and specimen accessioning practices. Quest's Marlborough laboratory advertises an 8am release-time for a subset of their clinical tests, but sometimes falls short of this objective. The business theorized that small, low cost alterations to their logistics network would improve their performance in this regard. This research tests this hypothesis
1 Ideally, test results would be available while the patient is still at the initial appointment. Any delay is an inconvenience and anxiety for the patient as well as an interruption in problem solving continuity for clinicians.
Analysis of a Diagnostics Firm's Pre-Analytical Processes
and suggests that, perhaps, other pre-analytical processes should receive more attention to enable the business to meet this goal.
1.2 Thesis Overview
Chapter 2 will provide background on Quest Diagnostics and their departments relative to this research. Chapter 3 will describe the diagnostic delivery process currently used by Quest Diagnostics and similar businesses in this market. Chapter 4 provides a demand-focused vehicle route planning formulation that provides a means of deploying a network-wide, demand-focused, routing strategy. Chapter 5 provides non-logistics related opportunities relating to the objective. Chapter 6 provides a summary of findings and recommendations.
Further supporting documentation is provided in the appendices. Appendix A provides a conventional vehicle routing problem, with time windows, for comparison. Appendix B provides sample code written in IBM ILOG CPLEX optimization programming language (OPL) for the demand-focused vehicle routing problem with time windows (DVRPTW). Appendix C provides variable notations used in Chapter 4.
1.3 Literature Review
This section will draw on examples of research from similar industries and provide context as to how they relate to business operations at Quest Diagnostics. Literature from operations research, process excellence and pathology all pertain to this research.
1.3.1 Vehicle Route Planning
Many academics within the operations research community have studied the applications of vehicle route planning algorithms for industries such as mail delivery, maintenance services, and school bus routing [2]. Similar to these industries, medical diagnostic firms like Quest Diagnostics also operate extensive logistics networks with thousands of vehicles and tens of thousands of customers that need to be served daily [3]. With such a complicated network of vehicles, costs are certainly of concern. Many researchers have evaluated exact and heuristic solutions to the vehicle routing problem similar to Quest's with cost as the focal point. Ellabib et al. describe the mathematical approach to commonly accepted formulations of the vehicle routing problem, with time windows (VRPTW) [4]; Appendix A provides this conventional VRPTW formulation. Baker reviews the traveling salesman problem (TSP) in terms of time window constraints, solving relaxed variations of linear optimization problems to generate solutions to the TSP [5]. This provided insight into time-window mathematical formulation later formed in Chapter 4. Simchi-Levi explains analytical approaches to the VRPTW and applies the VRPTW to a manufacturing
Introduction
environment [6]. Previous research has been done on Quest's logistics networks, focusing on turnaround time and service levels. Price analyzed the vehicle network at Quest, approaching Quest's turnaround time in a new "service based logistics optimization" model for a small segment of Quest's clients in Brighton, MA [7].
Quest uses a cost-focused vehicle routing program to design their courier routes. Logistics operating costs are the primary focus for businesses that specialize in logistics only, and where transportation services provide a majority of their revenue stream, like FedEx's FedEx Ground segment. For scale comparison, FedEx Ground operates over 80,000 vehicles across its 538 facilities in the US and Canada, whereas Quest operates roughly 3,000 vehicles [8]. Scale aside, similarities in motivation between the two organizations are certain: lower costs. Quest, however, generates the majority of its revenues through testing rather than logistics. The first objective of this research is to test the hypothesis that Quest can use their logistics network to provide level in-flow of specimens into their lab. We will find that Quest's objectives are not aligned with those of businesses such as FedEx, which leads us to further exploration of alternate methodologies.
Other differences exist between Quest's logistics operations and large commercial transportation companies. UPS, for example, publishes firm "latest drop off times," which clients accept without much question. If a commercial transportation company dictates a no-later-than time for drop offs, their clients are likely to adhere to these. For Quest, clients typically dictate pickup time-windows. This difference is largely due to the nature of Quest's business, the criticality of their product, and competition within the market. This complicates the logistics network, driving costs upwards as customer demands increase. The e-grocery home delivery business also serves a market-type with consumer-defined time-windows, which studies show has made the home-delivery market for groceries extremely difficult to operate [9]. Large commercial transportation companies also publish clear delivery commitments across their service levels, often with money-back guarantees [10]. Quest's service levels are highly variable depending on location, client, and test type.
The vehicle routing problem solution we form in Chapter 4 combines many elements of these works. While traditional VRP solutions focus on reducing costs, the formulation in Chapter 4 attempts to quantify a solution to the VRPTW that allows for more efficient operations at the hub/depot laboratory. This is a unique concept: using a courier/logistics network in a reverse supply chain to balance the flow of materials through a production environment. This provides us with a more tailored routing solution for Quest's needs in order to compare intended outcomes to those they currently experience.
Analysis of a Diagnostics Firm's Pre-Analytical Processes
1.3.2 Medical Laboratories
Quest operates modem medical laboratories, many of which operate similarly to manufacturing facilities given technological progression in the industry. For traditional manufacturing processes, a product flows through a production line as value is added to it. The product is then delivered to consumers. In the medical laboratory industry, consumers provide a product that flows through a process as value is extracted
from
it. Comparisons between manufacturing and large-scale laboratory operations are widely documented [11] [12] [13]. Balanced flow in medical laboratory pre-analytical processes has been proven important [12], yet cost and quality must still be considered.Clinicians order tests through varying mediums. Some clients order tests electronically where others request them on paper or through non-electronic medium. Chapter 5 describes how this inconsistency in requisition medium complicates laboratory operations. These complications suggest a need for reverse supply chain integration could be applicable for Quest's client network [14]. Operational efficiencies aside, we can assume the likelihood of errors associated with electronic orders are less than those ordered otherwise. Davis et al. show the effectiveness of electronic ordering of prescriptions for patients, showing that order errors were approximately eight times more likely when not using computerized order entry systems. Additionally, turnaround times for prescriptions decreased dramatically as well [15].
1.3.3 Patient Service Centers
Patient Service Centers (PSC) are outpatient clinics where patient samples are taken. PSC operations are explained in more depth in Chapter 3, but can simply be described as a clinic with (typically) a waiting room, draw room, and a staff of one or more phlebotomists serving the patients. Outpatient clinics are notoriously individual patient-centered, often at the expense of the greater patient population's service quality as a whole. Incentives driving this behavior are described in Chapter 2, but relative literature discussing patient satisfaction and service importance are provided for context. We investigate means of returning greater value to the patient by improving test release time and quality at the expense of initial service quality. This section will frame our hypothesis that patients will be willing to wait longer if (1) they have guided expectations of wait time duration for the clinic and (2) the quality of their diagnosis improves as a result. Improving test release time for patients drawn in PSCs is a byproduct of a multi-function effort to reduce late-night in-flow of specimens into their Marlborough lab.
One-to-one comparisons can be made between Quest's phlebotomy services and competitor phlebotomy services. Mijailovic, et al., for instance, provide a means of optimizing outpatient phlebotomy staffing across 14 sites to decrease patient wait times [16]. Minimizing patient wait-times appears to be the focus for other healthcare outpatient operations as well, such as outpatient oncology infusion centers where
Introduction
phlebotomy and lab services account for the majority of patient wait-times prior to beginning infusion [17]. We will discuss how patient waiting times are indeed important for Quest's phlebotomists to consider, but may have downstream impacts on test release timeliness. In fact, Matthews et al. suggest that patients knowledgeable about the healthcare system as a whole, as well as their treatment specifically, will have more realistic expectations than those without such knowledge [18]. This suggests that proper patient-education on the part of the provider may improve patient experience, regardless of
small increases in wait time.
Outside of healthcare, further correlations can be made. Automotive repairs, for instance, show strong correlation to phlebotomy services. In phlebotomy, a patient wishes to be served quickly and receive quality results quickly. From a systems perspective, these two objectives (initial care and diagnosis) often oppose each other. Similarly, customers of an automotive repair business wish to have their vehicles serviced quickly and have the service completed properly. Hsai and Pu propose an important distinction between importance of service and satisfaction with service [19]: performing well in an area the customer cares less about has less impact than performing well in an area the customer cares more about. In the case of auto repairs, customers will typically prefer product quality over service quality, meaning that having their vehicle fixed properly is more important than other aspects relating to customer service. We propose tools and methodologies common to other businesses, including small batch and one-piece flow for post-draw process steps. For some blood samples, the blood must clot for 30 minutes prior to centrifuging. A centrifuge must spin for 15 minutes for serum and plasma samples [20], which is a lengthy time considering that the time it takes to draw these samples is often under a minute. The bottleneck in a Patient Service Center is certainly these post-draw processes, and phlebotomists prefer to wait for multiple samples before centrifuging because of this. Similarly, in gear manufacturing plants, along with other low-carbon steel product manufacturing plans, heat treatment furnaces are often the bottleneck steps in the process with cycle times in excess of 15 hours. Workers often wait until the furnace is full to run a batch, increasing the machines' efficiencies while delaying the manufacturing process as a whole. In similar studies, batch size reductions and single-piece flow for heat treatment processes have shown to reduce wait times by up to 20 days [21]. Persoon et al. discuss the benefits of one-piece flow of specimens through a diagnostic process consistent with the Toyota Production System (TPS) [11], a practice later discussed in Chapter 5 regarding phlebotomy practices relating to manifesting. A single-piece flow process within the phlebotomy clinic shows system-wide impacts that return greater value to patients than simply improving patient wait times.
Chapter 2
Company Background
Quest Diagnostics is the world's leading provider of medical diagnostic testing information services, having delivered an estimated 20 billion test results over the past decade [3]. Each year, they serve approximately one third of the U.S. population, half of all U.S. physicians, and half of the hospitals in the United States.
Quest operates over 2,200 patient service centers and has 4,000 organic phlebotomy technicians in physician offices (IOP), providing unmatched scale for reaching clients across their operating territories. Quest also provides services to clients who employ their own phlebotomists, and such accounts provide a large percentage of their sample volume. Servicing this network of tens-of-thousands of client locations are 3,000 courier vehicles and 25 aircraft, as well as a fleet of logisticians who ensure specimens are brought from the field to the performing laboratories in a timely and efficient manner [3].
Quest Diagnostics reported full-year revenues of $7.435BB, $7.146BB, and $7.383BB in 2014, 2013, and 2012 respectively. Quest generates roughly 55% of its revenues from routine clinical testing services, which physicians use in the detection, diagnosis, evaluation, monitoring, and treatment of diseases and various medical conditions. These tests consist of analyzing an array of specimens including whole blood, serum, plasma, urine, and other patient specimens. Roughly 34% of the company's revenue comes from gene-based, esoteric, and anatomic pathology testing services [3].
2.1 Healthcare and the Diagnostics Industry
The importance of the diagnostic information services industry is not easily ignored. While the industry (as a whole) accounts for only 1.6% of Medicare costs and 5% of hospital costs, their products influence 60-70% of healthcare decisions [22]. The diagnostic information services industry is also highly competitive. Quest Diagnostics recognizes three general types of clinical competitors: commercial clinical, hospital-affiliated, and in-physician-office laboratories. The largest commercial clinical
Analysis of a Diagnostics Firm's Pre-Analytical s
competitor is Laboratory Corporation of America Holdings, Inc. There are many hospital-affiliated competitor laboratories across Quest's various areas of operations, as well [3].
Companies in this industry compete on a number of factors including test-menu completeness, quality, pricing, and reputation. Quest Diagnostics has the most comprehensive test menu in the market. This research focuses on how a business within this industry can maintain competitive advantage through timeliness of result reporting, which is of paramount importance to clinicians and patients alike. We define turnaround time as the time between Quest receiving a requisition and when a clinician receives the result. Turnaround time is of paramount importance to any clinical laboratory as a distinguishing performance characteristic [23]. As such, earlier release times improve a firm's standing relative to their competitors. Market analysis concludes that 88% of clinicians need lab results within 24 hours, and 43% need results before 8am the next day [24]. To bring value to its clients and to improve its position in the market, Quest Diagnostics strives for an 8am release time for a large subset of routine clinical pathology testing. This enables clinicians to review test results before they begin seeing patients each day.
2.2 Quest's Organizational Specifics
This section provides an overview of both the national and local organizations within Quest Diagnostics. It includes company reporting-structure, information regarding technical departments, as well as performance expectations and incentive structures for each of the relevant organizations. Of great relevance are the functional silos within the organization, across both the national and local businesses.
2.2.1 General Organization
Quest has eight business units located throughout the United States. Each of these business units has an operations executive with functional directors supporting patient services, logistics, and lab operations. There is a national organization that supports and provides direction to the functional groups within Operations. This group assists regional business units with staffing, doctrine, process, and enterprise-wide initiatives.
This organization is functionally segmented locally and nationally. This functional segmentation leads to functional optimization, such as cost minimization for logistics functions and staffing minimization for lab operations. Sales is also functionally segmented from operations, leading to competing objectives that are discussed in the following section.
Company Background
2.2.2 Functional Area Objectives
Functional staffing arrangements motivate incentives and business objectives within each functional area's operation. Each functional area will be described in detail in Chapter 3.
The logistics organization within each business unit has a clear objective: pickup and deliver specimens at the lowest cost while meeting the constraints of their client base. They are viewed as a cost center. The logistics organization reduces costs by decreasing the amount of vendor-supported routes they run and by working with the national organization to re-route their couriers to minimize operating costs.
Patient Services, which operates Quest's patient sample collection centers, is a true patient-facing functional group and is evaluated on patient satisfaction and average patient wait times, amongst other criteria. At times, these competing objectives adversely affect their ability to release specimens to couriers in a timely manner, causing a higher volume of tests to enter the lab in the evenings.
The sales organization is incentivized to increase revenues and bring new business into the organization [25]. The sales organization may, at times, offer enhanced service levels to larger clients, which increase revenues but also increase operational complexity. As an example, a large client of the Northern Business unit requires all same-day test requisitions to be delivered to a Quest Rapid Response Laboratory (RRL) rather than their core lab in Marlborough. This strains the logistics network immensely, forcing 22 different courier routes to transit through RRLs before returning to Marlborough with the rest of their client volumes.
Specimen management, a group that provides front end services in the lab, is evaluated on adherence to processor efficiencies, thus they staff their stations to ensure each employee is nearly 100% utilized for the entirety of their shift. This is later discussed in 5.3.2 as a contributing factor to the late-release of tests. They are also evaluated on data-entry quality, which necessitates quality control steps in their processes. Collectively, these functional objectives do not always align to allow the business to achieve its operational goals. Late release of specimens from PSC's affects specimen arrivals into the lab. Cost cutting in logistics amplifies late arrivals of specimens into the lab as well. Varying service levels across clients also has direct downstream impact on the lab's ability to function smoothly. Chapter 6 provides general commentary from a systems perspective relating to these objectives.
2.2.3 Recent Developments
In 2012, Quest launched a new vision: Empowering Better Health with Diagnostics Insights. This vision was accompanied by three aspirational goals: a healthier world; build a valuable company; and create an
Analysis of a Diagnostics Firm's Pre-Analytical Processes
inspiring workplace. Later that year, Quest Diagnostics introduced a five-point business strategy intended to support their vision and goals, which consisted of restoring growth, driving operational excellence, simplifying the organization, refocusing on diagnostics information services, and delivering disciplined capital deployment.
2.3 The Northern Business Unit
Quest's Northern Business unit, which serves patients from every state in New England, up-state New York, western Pennsylvania, northern West Virginia and Northeast Ohio, is headquartered in Marlborough, MA. The Marlborough location services clients from New England while others serve the more western territories. Prior to 2014, the New England client volumes were analyzed at two laboratories in Cambridge, MA and Wallingford, CT. The Cambridge lab has since closed (at least for the non-stat menu type testing) and a portion of the Wallingford, CT volumes will be absorbed into the Marlborough location in late 2015. This research focuses primarily on operations run out of the Marlborough location.
2.3.1 Consolidation of the New England Business
Pursuant to driving operational excellence, Quest's Northern Business unit is currently undergoing significant transformation both in terms of physical layout and scale of service area. The New England business will soon be analyzing specimens from tens of thousands of patients per day in a single laboratory. Consequentially, relocation of Quest's Cambridge personnel to Marlborough produced a large turnover in its Cambridge-based operations workforce. Future consolidation of the Wallingford laboratory into Marlborough is expected to produce similar effects. Evaluation of pre-analytical processes for this business unit is crucial to their success during the transition.
A primary driver for the level loading initiative is the expected increase in requisition volume expected for the Marlborough Lab in the second half of 2015. Quest hopes to offset their early-day inflow deficiencies with specimens previously delivered to their Wallingford site. The Marlborough laboratory features a new automated specimen delivery system, expected to increase capacity and decrease operating expenses for this increased volume.
2.3.2 Automation and the Lab of the Future
In 2014, Quest Diagnostics opened a new and state-of-the art laboratory in Marlborough, MA. This laboratory houses some of the most advanced automated clinical laboratory testing equipment in the industry. It features a fully customized, automated delivery system capable of performing many tasks previously performed by technicians. This system is capable of aliquoting, centrifuging, de-capping, and
Company Background
receiving thousands specimens per hour [26]. For their patients and customers, this laboratory is expected to bring faster and more consistent results.
This laboratory will provide significant economies of scale for Quest, allowing them to properly distribute specimens within the laboratory. The automated laboratory will serve as a flagship laboratory for Quest, hoping to continue improving on its functionality while building best practices for future installations across the enterprise. Providing this automated laboratory with sufficient volume through its operating hours is essential. The following chapters describe how pre-analytical processes may be improved to achieve this goal and maximize the utility of the lab.
Chapter 3
Diagnostic Delivery Process
A patient will see a doctor for a number of reasons, often with symptoms pointing towards various diagnoses. In order determine which diagnoses best explain the symptoms, doctors will often call on Quest to provide further insights. The patient will provide the required specimen, after which the specimen is prepared for transport and sent to a laboratory for testing. Roughly 50% of all physicians rely on the information Quest provides [3], thus the geographies Quest services are spread out to remote and urban areas alike. Both geography types play a role in complicating this process, prolonging the time between the patient's appointment and when the doctor can provide them with an accurate diagnosis. Many of the obstacles and complications throughout the diagnostic delivery process have improvement potential, but this research will focus primarily on phlebotomy, logistics, and accessioning operations. Additional industry-specific terms, along with an explanation of the diagnostics delivery process, are given below to provide the necessary context and background.
3.1 Service Levels and Specimen Types
Differentiating service levels allows us to focus on the requisition types discussed in this thesis.
3.1.1 Service levels and Client Expectations
As explained in Chapter 2, customer service and adherence to client expectations are extremely important in this industry as the market is full of competition. There are three generally accepted service levels that clinicians may request, though the specific turnaround times for each service level may vary depending on client agreements.
STAT - These tests are generally resulted within 4 hours of patient draw. This type of test must be (1) ordered as a STAT by the client and (2) offered as a STAT test by the receiving laboratory [27]. STAT tests involve a separate, reactive logistics network outside of the focus of this research. Quest employs full-time drivers and uses contract courier services to satisfy STAT testing demand due to their time-sensitive nature. Additionally, within the laboratory, STAT tests have priority for check-in and testing.
Analysis of a Diagnostics Firm's Pre-Analvtical Processes
Same-Day - Results will typically be released prior to 5pm on the same day the test was received. These tests necessitate midday pickups at nearly every client in Quest's territory. To ensure same day result, couriers must collect these samples prior to 11am.
Routine - These tests represent the largest portion of Quest's volume and are the primary focus of this research. These tests can be picked up at any time and are resulted the following day prior to 8am.
3.1.2 Specimen Types
General classifications for specimens are based upon sample type and sample temperature. Biopsies, urine, blood, semen, stool, and bodily fluids (such as spinal fluid) are examples of specimen types. We use the term specimen to broadly describe all of the aforementioned. Different specimens require different levels of care within Quest's operations. Biopsies, for example, require a chain-of-custody and signature from every person receiving the specimen throughout the process. Standard blood samples, on the other hand, require no chain-of-custody.
For blood samples, specialized specimen containers are used to provide coagulation or anti-coagulation depending on the test required. The most common anti-coagulant used is K2EDTA, while sodium citrate is often used for coagulation. Serum separation tubes (SST) contain a lithium heparin gel additive (in addition to clot activation additives) for serum-only testing. Blood collection is typically accomplished easily and safely with vacutainer technology, which combines strong polyethylene terephthalate plastic containers, an internal vacuum in the tube for more efficient draws, and a closure that protects phlebotomists from coming in contact with patient blood [28]. Additionally, specimens are segregated by temperature required for delivery. Frozen specimens are transported with dry ice, refrigerated specimens are transported with insulated bags, and room temperature or ambient specimens are transported in courier bags.
3.2 Patient Service Centers and In Office Phlebotomists
Patient service centers and in-office phlebotomists are staffed with Quest employees who perform phlebotomy services. There are over 300 of these locations in the New England area, though the exact number is in constant flux. Patient service centers are isolated outpatient locations, while in-office phlebotomists are located within partner practices. Quest uses expected patient volumes to determine PSC and IOP staffing. Their hours vary by location, though 8am - 5pm with midday lunch hour is common. The employees at these locations serve two primary functions: collect patient samples and prepare samples for transport to the performing laboratory. They serve many other miscellaneous functions
Diagnostic Delivery Process
including billing and some consultation, but this research will focus primarily on the collection and preparation of samples.
3.3
Logistics Operations at Quest Diagnostics
The logistics operation in Marlborough is highly complex with over 100 routes, based off of 2014 data [7]. Each day, a courier will visit multiple client locations, patient service centers, and various laboratories in the Quest network. It is an unconventional reverse supply chain where materials are retrieved from clients and brought to a depot location where value is extracted and delivered back to clients in the form of information. Also, whereas most reverse supply chains focus on remanufacturing or recycling [29], Quest's primary clinical product is derived through this network. Below is a table comparing forward supply chains, reverse supply chains, and Quest's reverse supply chain, in general terms.
Forward Supply Chain
Based on profit and cost optimization
Relatively easier and straightforward forecasting for product demand Less variation in product quality Processing times and steps are well defined
Goods are transported from one location to many other locations
Consistent inventory management
Reverse Supply Chain
Based on environmental principals as well as profit/cost optimization More difficult forecast for product returns
Stochastic product quality
Processing times and steps depend on condition of returned product Returned products collected from many locations arrive in one facility
Inconsistent inventory management
Quest's Reverse Supply Chain Based on profit and cost optimization
Relatively easier and
straightforward forecasting for demand
Stochastic specimen quality' Processing times and steps depend on condition of specimen provided. Specimens are gathered from many locations and brought to several performing lab sites2.
Complex inventory management due to IT systems3
1. Specimens of varying quality are received by the lab, to include: spilled, not centrifuged, thawed, and insufficient quantity. 2. Quest operates many labs other than their hub locations that perform tests within their STAT and Same-day test menus.
3. Lab tests are ordered through a variety of systems, and Quest operates logistics software separate from their laboratory information systems (LIS).
Table 3-1: Comparison of supply chains [301.
The remainder of this section will provide further information as to how routes are generated and how couriers, whom are interchangeably referred to as Route Service Representatives (RSRs), perform logistics operations at Quest. The following sections are intended to provide information on routine routes carried out by RSRs and do not represent the full scale of Quest's logistics operations.
3.3.1 Route Maintenance
A basic route infrastructure has been built over many years and through multiple acquisitions and agreements. These routes are altered for three primary purposes:
Analysis of a Diagnotics Firm's Pre-Analytical Processes
1 - An RSR is unable to carry out their route.
2 - A client requirement is added or removed from the logistics network. This may be for a new client taken on from sales, from a PSC or IOP opening or closing, or from new business requirements for current clients.
3 - An effort is made to reduce costs by cutting routes or reorganizing stops.
When an RSR calls out of work, supervisors and team leads within the logistics department must quickly reassign clients on those routes to neighboring routes or call upon the services of partner courier companies. This work is done primarily through Program A (discussed in 3.3.2) and manual entry. Breaking up routes adds variability to the demand arrival forecasts, as specimens will tend to come in later and further complicate the 8am test release objective of the business.
When a client is brought on, there is a joint meeting including operations to discuss customer requirements. Requirements that complicate the addition of a client to a route include:
" Pickup location: the client may leave specimens in a Quest drop box outside of their facility or require a face-to-face pickup. Clients may lock their doors without granting the RSR access, making their
no-later-than pickup time uncompromising.
* Pickup Time: Some clients require late pickups, as they want to be sure they have sufficient time to prepare specimens for pickup.
" Pickup Windows: Narrow time windows further complicate the addition of a client to a route and, additionally, introduce precedence relationships between client arrival times [31].
3.3.2 Logistics Software Systems
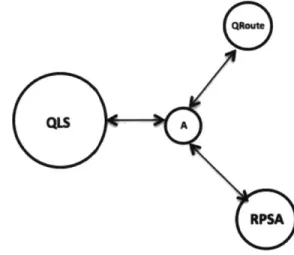
Logistics uses four primary IT systems and software tools to carry out their operations. Table 3-2 and Figure 3-1 describe the software's role in the operation, which function uses it, what data can be derived from it, the reliability of the data, and the communication relationship between them.
Diagnostic Delivery Process
Software Function
QRoute Software loaded into RSR scanners that provide route information to the RSR as well as a means for the RSR to transcribe notes and client volumes. Contains minimal patient information.
Program A Master repository for Quest's logistics operations that maintains client demographics and route information. Contains minimal patient information.
RPSA Route Planning Software A, which utilizes a conventional vehicle route planning algorithm to provide low cost routes with minimal client time-window violations.
QLS Quest Diagnostics' Laboratory Information System. This system contains all client information, patient information, test result information, as well as other lab specific information. This is an IT product used across the enterprise by multiple functional groups.
Table 3-2: Overview of Quest's logistics-related software.
QLSA
RPSA
Figure 3-1: Relationship between the various software tools within Quest Logistics. Size denotes relative reliability with regards to its primary function based off the author's observation.
3.4 Specimen Management
Processors within specimen management ensure data integrity and specimen quality from the time a specimen enters the laboratory until the specimen is discarded. This is one of the largest single departments within the lab with significant staffing across three shifts, allowing the department to operate 24/7. Personnel in this department accession, transport, centrifuge, aliquot, store, and dispose of all patient samples within the laboratory.
3.4.1 Accessioning, Overview
We define accessioning as ordering an assay in the laboratory information system [12]. The accessioning process is highly variable depending on the client being accessioned. Some accounts require special
Analysis of a Diagnostics Firm's Pre-Analytical Processes
processes, while others request test codes from their own test menu that the processors must de-code before the test can be completed.
3.4.2 Requisition Types
Clients order tests through two basic mediums: electronic or manual requisitions. An electronic requisition may be ordered through a Care360 account or through their electronic medical record (EMR) via a bi-directional interface. Manual requisition mediums vary, ranging from hand-written paper requests to Care360 "result-only" orders. Additionally, any order placed under an electronic requisition that faults during transmission must be handled as a manual requisition.
3.4.3 Accessioning Stations
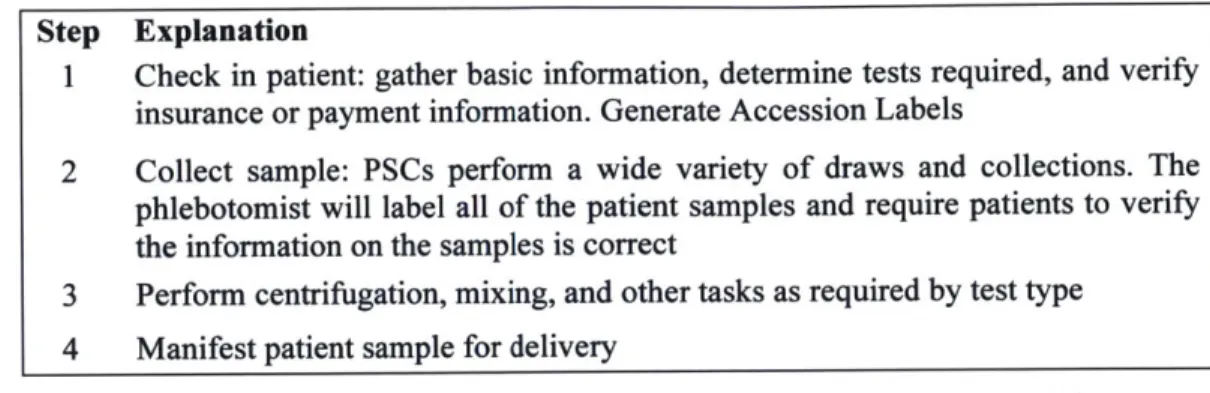
The below table provides details for the basic function of each of the accessioning stations. Station Requisition Explanation
A Manual Station where the minimum information necessary to release a test to the technical laboratory is entered into IDAA.
B Manual Stations where the remaining fields not filled by A-station are entered. All patient information is checked for accuracy.
C Manual and Single-accession Care360 station used by PSC's and IOP's. Specimens Electronic accessioned in C-station are able to immediately enter the technical laboratory
upon arrival.
D Electronic Location where electronic orders are processed and information is verified for Care360 and bidirectional interface orders.
E Electronic Station for processing specimens in an older version of IDAA. J Manual Station that combines A and B station, rarely used.
Table 3-3: Overview of accessioning stations within specimen management's clinical operations.
3.5 Specimen Testing within Clinical Pathology
Clinical pathology involves many subdivisions of pathology, but this thesis is focused primarily on those subdivisions that are affected by the automated specimen delivery system described in Chapter 2. This section primarily serves to provide the reader with context on analyzer throughput for analysis in later chapters. Specific analyzer types and quantities are not provided.
3.5.1 Hematology
Hematology is the study of blood. Testing within the department is done with various machines, but the machines that interface with automation are listed below with the total number of machines, throughput of each individual machine, and daily volumes provided.
Diagnostic Delivery Process
Analyzer C - Manufactured by Supplier A, provides urine cell and urine chemistry analysis capabilities and an array of test methods. Quest uses these analyzers for urinalysis and other high-volume tests. Analyzer B - This machine is a whole blood analyzer. This analyzer is mostly used for complete blood count (CBC) testing.
Analyzer D - Manufactured by Supplier C, the Analyzer D is used to perform erythrocyte sedimentation rate (ESR) testing.
3.5.2 General Chemistry
General Chemistry is the other primary department of clinical pathology. There are a variety of analyzers that support operations within this department, but the highest volume machines in this department are listed below with basic, relevant information.
Analyzer A - Quest uses the Analyzer A for a huge volume of tests daily, with thousands coming from cholesterol testing alone. The Analyzer A performs over % of the total 8am TAT test menu.
Analyzer E - They use these platforms to perform human chorionic gonadotropin (hCG) and thyroid (TSH and TS4) testing within their 8am TAT test menu.
Analyzer F - The Marlborough lab uses these analyzers for AlC testing on their 8am TAT test menu. These tests are used to diagnose diabetes and other serious conditions.
3.6 Test Release
Depending on the client, the requisition type, and machine performing the test, Quest offers various test release options. For electronic orders, results are normally distributed directly to the EMR through a bi-directional interface or released through Care360. Manual accounts are primarily released through Care360, but may also be released by fax, automatic dial service, or by paper transported via the courier network.
Clinicians monitor test release times closely. Without timely reporting, clinicians are unable to serve their patients efficiently. Based on call-center data gathered over an eighteen month period for inbound calls to the Marlborough lab, clinicians made over twenty thousand individual calls to Quest regarding pending test results. These calls required approximately 2,000 hours of avoidable support staff resources. In subsequent chapters, various methods of reducing this impact on support staff are evaluated.
Chapter 4
Formulation of New Demand-Focused VRPTW
Balancing output from suppliers and leveling the manufacturing system are both fundamental process improvement methodologies [14]. We've discussed Quest's inherent need to alter traditional vehicle routing solutions to fit their unique need to level inbound specimen flow. In this chapter, we first discuss the limited success from attempts to manually alter route solutions from a traditional cost-minimizing route solver. We then suggest a new route solution model and reflect on its strengths and weaknesses relative to Quest's courier network.
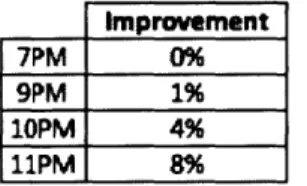
Quest's Marlborough Logistics team has attempted to manually level the inflow of specimens into Marlborough through courier relays and vendor routes. Additionally, members from the national logistics organization teamed up with local supervisors to further level specimen arrivals, committing significant resource hours to achieve the balanced flow objective. An overview of progress over a seven-month period is shown below in Table 4-1, showing increases in cumulative arrivals by specific times throughout the day.
Improvement
7PM 0%
9PM 1%
10M 4%
11PM 8%
Table 4-1: Relative improvement gains observed over a seven-month period between November 2014 and June 2015.
This relatively small improvement suggests that manual alteration of routes is minimally effective relative to the goals the business has set. This required transitioning from a classical VRPTW solution objective to one that truly drives operational capacity for the business. For Quest, this requires understanding specimen availability across their clientele and observing the relationship between cost and hour-to-hour volume inflow variability.
This new model uses quadratic constraints and objectives as well as geographic and demand data for clients. The following sections provide an algebraic framework, while Appendix B provides the
Analysis nf n Dinonntics Firm's Pre-Analti-al Prcesses
formulation in optimization programming language, written in IBM ILOG CPLEX. The model involves a group of drivers K, a set of stop locations C, and a set of stop numbers L.
4.1 Objective Function
Many formulations were considered, however the functions expressed in (4.1) and (4.2) proved computationally efficient. The model seeks to minimize the maximum single-hour demand delivered to the hub laboratory. This is a single-criterion optimization that does not consider simultaneously reducing the total number of drivers and reducing cost commonly found in the bi-criterion VRPTW [2]. Such alterations can be implemented by adding cost to (4.2) with an appropriate scalar multiple relative to the demand volume.
We first define a variable D k as the amount of demand a driver k has stop 1. We also define the variable x1J , which is one if and only if driver k visits location i on stop 1. This variable is defined as binary in (4.8).
Variable D will be equal to the volume the driver received from previous stops as well as demand received at the current stop, short any demand previously released at the depot. This is shown algebraically in (4.1). The D 1 *xk term is zero unless the driver arrives at the depot node, in which case the accruing demand will be reset for the next leg of the trip. The stop number (1) element for x and
D serves as a timestamp used for each driver.
D DI = D1_1 + digxxfg - D1_1 * 1, kkD 1+ k. k *Xk0 Vk kEK lEL
e
K,VIE
L,1 # 0 (4.1)41Equation (4.1) is a quadratic equality that provides additional computational complexity. This equation was replaced with three quadratic inequalities [32], shown below as (4.1.1 - 4.1.3), where A is some integer larger than the total demand across the client network.
Dk -d. xt k 5 A* (1 - x4 ),Vk E K, Vl E L, (4.1.1) D -di*xk; > D _k - A * [1 - (1 - xko) (4.1.2)
D k - di xkg < Dk_1, Vk E K, V1 E L,1l # 0 (4.1.3)
D 2k 0 !k E K,V1 E L (4.1.4)
These three inequalities perform the same function as the single equality in (4.1). For example, if the driver arrives at the depot on stop 1, (4.1.1) becomes D k < 0, forcing the demand to reset to 0 given
non-Formulation of New Demand-Focused VRPTW
negativity constraint. If the driver is at any stop other than the depot, then equations (4.1.2 and 4.1.3) force the following inequality:
Dk_1 + dix k < Dk < Dk_1 + dix k
Now, we minimize the maximum single-hour volume returning to the depot with objective function (4.2). This objective will target the single highest-volume hour and redistribute driver stops to minimize inbound volume.
mintmax EZk1(D_,K * xk ))Vl e L (4.2)
4.2 Model Constraints
The first constraint, listed as (4.3), restricts all drivers (k) to begin at the depot node. This variable takes the form xOO for a single depot case but is specific to each driver and, thus, can be used for a larger scale vehicle routing network such as Quest's New England logistics network, which has many remote hub locations.
x00 = 1,Vk E K (4.3)
Much like (4.3), (4.4) requires all drivers (k) must return to the depot node (0) for their last stop. The size of L must be large enough as to not constrain the model from exercising all route options. Thus, L should be equal to or greater than twice the total number of clients to allow the model to consider visiting each client as an independent, single stop trip. This is an instance of the most expensive case but would be within the feasible solution region if not for a cost constraint.
k =1,VkEK,L=2*C+1 (4.4)
Constraint (4.5) is a conservation of flow constraint that only allows driver (k) to go to destination (i) on stop (1) if they were at some other node before (i). This constraint proved unnecessary in application given the requirements of (4.3), (4.4), and (4.11) but is listed as flow constraints are common for most network flow models.
xIJ Xjec x1+1,J, Vk E K, i
j
(4.5)The time window constraint adds significant computational complexity to the VRP formulation. Given the syntax used in DVRPTW, (4.6) is used to constrain any driver (k) to arrive at client location (i) only
Analysis of a Diagnostics Firm's Pre-Analytical Processes
between that clients specified early (e1) and late (1i) times. The arrival variable takes the form a, and is
independent of the client. The arrival variable is explained further by (4.7).
i * e a k x< * li,Vi E C,Vk E K (4.6)
Time accrues in this model based on travel (tij) and service (si) times. A driver (k) will arrive at client (I) on stop (1+1) after arriving at client (i) on stop (1), servicing client (i), and travelling from client (i) to client (j). The x4k *x+ term creates a quadratic constraint.
a1+ 1 > al +
[ti*
* +, + xf
* si (4.7)A large number of clients in Quest's network have multiple daily stops. To avoid confusion, every client stop is treated as a separate instance of the client class. For example: Client Y requires five stops throughout the day. Each of Client Y's five stops will be treated as independent clients (i-i5).
Variable x k I is binary, (4.8) provides this constraint.
xi E 0,1,Vk E K (4.8)
We then formulate a universal cost constraint in (4.10). From this constraint, shadow pricing can be used to evaluate business decisions regarding flow volumes. This is a quadratic constraint.
$(Some dollar amount) XIEK crJ * xk * xk+,j; V iJ E C, i
j
(4.10)As mentioned previously, equation (4.11) combined with (4.3) and (4.4) satisfies flow conservation constraint. This constraint requires that all clients (i) be visited exactly once.
kEKx = 1,Vi E C,i # 0 (4.11)
Constraint (4.12) constrains all drivers to a standard workday with some latitude. An organization may want to constrain part-time and full-time employees' work durations separately, and in such a case (K) can be broken up into part-time and full-time groups. (4.12) restricts the difference between a driver's start and end time to be within a specific hour range.
7 : aL - aok 9; k EK (4.12)
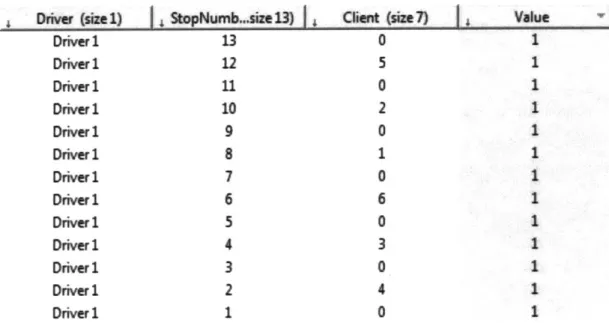
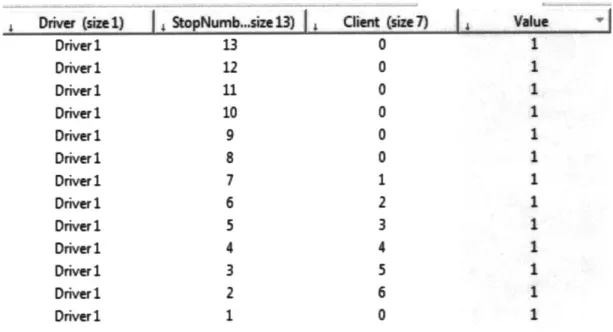
Collectively, these constraints and objective function form the DVRPTW. Section 4.3 will provide explanation of the model as it was applied to a fictional scenario involving six clients and a single driver.