To link to this article
: DOI:10.1016/j.electacta.2013.02.063
http://dx.doi.org/10.1016/j.electacta.2013.02.063
This is an author-deposited version published in:
http://oatao.univ-toulouse.fr/
Eprints ID: 8503
To cite this version:
Larignon, Céline and Alexis, Joël and Andrieu, Eric and Lacroix, Loïc and
Odemer, Grégory and Blanc, Christine Combined Kelvin probe force
microscopy and secondary ion mass spectrometry for hydrogen detection
in corroded 2024 aluminium alloy Electrochimica Acta. (2013) Vol. 110.
pp. 484–490. ISSN 0013-4686
O
pen
A
rchive
T
oulouse
A
rchive
O
uverte (
OATAO
)
OATAO is an open access repository that collects the work of Toulouse researchers and
makes it freely available over the web where possible.
Any correspondence concerning this service should be sent to the repository
administrator:
[email protected]
ESS
Combined Kelvin probe force microscopy and secondary ion mass spectrometry
for hydrogen detection in corroded 2024 aluminium alloy
Céline Larignon
a, Joël Alexis
b, Eric Andrieu
a, Loïc Lacroix
b, Grégory Odemer
a, Christine Blanc
a,∗aUniversité de Toulouse, CIRIMAT, UPS/INPT/CNRS, ENSIACET, 31030 Toulouse cedex 04, France bUniversité de Toulouse, LGP, INP-ENIT, 65016 Tarbes cedex, France
Keywords: Corrosion
Kelvin probe force microscopy (KFM) SIMS
Aluminium alloys Hydrogen embrittlement
a b s t r a c t
The capability of Kelvin probe force microscopy (KFM) to detect and locate hydrogen in corroded 2024 aluminium alloy was demonstrated. Hydrogen was introduced inside the 2024 alloy following a cyclic corrosion test consisting of cycles of immersion in 1 M NaCl solution followed by exposure to air at −20◦C. The combination of scanning electron microscopy, secondary ion mass spectrometry and KFM
demonstrated that the grain and subgrain boundaries were preferential pathways for the short-circuit diffusion of hydrogen but also acted as a source of hydrogen diffusion in the lattice over distances of up to ten microns with non-negligible desorption when exposed to air at room temperature for 24 h.
1. Introduction
In the aeronautical industry, many structural parts are made of aluminium alloys, such as the 2024 aluminium alloy, a precipitate-hardened aluminium alloy with high mechanical properties. However, this alloy is susceptible to many forms of corrosion in chloride media, such as pitting corrosion[1], intergranular cor-rosion [2] or stress corrosion cracking [3]. Classical laboratory corrosion tests generally consist of continuous immersions in chlo-ride solutions at room temperature. However, the actual exposure conditions for aircraft include periods of parking on the tarmac (at room temperature or above) and flight periods (at approximately −50◦C for most of the structure[4,5]). In a previous study[6], cyclic corrosion tests were performed to reproduce the actual exposure conditions of the 2024-T351 aluminium alloy in the aircraft skin, and the results obtained were compared to those of continuous immersion tests. A cyclic corrosion test known as a cyclic freezing (CF) test included three 24 h cycles comprised of an 8 h immersion period in 1 M NaCl solution at room temperature followed by a 16 h emersion period in air at −20◦C. Therefore, the entire CF test took
72 h. The results showed that the CF test produced a different corro-sion defect morphology and an increased density of corroded grain boundaries in comparison to a 72 h continuous immersion test. The CF defects were more numerous, more branched and shorter than the corrosion defects grown during continuous immersion tests.
∗ Corresponding author. Tel.: +33 5 34 32 34 07; fax: +33 5 34 32 34 98. E-mail address:[email protected](C. Blanc).
However, despite the shorter defects, the CF test led to a stronger decrease of the mechanical properties of 2024 aluminium alloy than a continuous immersion test. This paradoxical concomitance suggested a combination of corrosion and hydrogen embrittlement (HE) phenomena during the CF test. This hypothesis was confirmed using instrumental gas analysis (IGA) to determine the hydrogen content; the results revealed a higher hydrogen content for CF samples (mean value of 70 ppm weight) compared to samples sub-jected to continuous immersion in NaCl solution (mean value of 23 ppm weight for a 72 h immersion test) or non-corroded sam-ples (mean value of 8 ppm weight)[6]. Moreover, HE is suspected to play a major role in the stress corrosion cracking of aluminium alloys. In a recent work[7], the fracture surfaces around the CF corrosion defects were very similar to those obtained after tensile tests on cathodically hydrogen-charged samples. Hence, the exist-ence of HE was corroborated and a mechanism was proposed to explain the occurrence of HE during CF testing. In this context, an analytical technique able to detect and locate hydrogen traps and diffusion short circuits in aluminium alloys would be very useful for further investigation of the mechanisms.
Approximately fifteen years ago, Schmutz and Frankel introduced the combined atomic force microscope and Kelvin probe force microscope (AFM/KFM) technique for corrosion sci-ence applications[8], reporting a linear correlation between the KFM potential and corrosion potential. Since then, the technique has been widely used to study the localised corrosion of 2024 aluminium alloy[9–11]or filiform corrosion[12,13]. The stress corrosion cracking behaviour of SUS304 stainless steel was studied by KFM, and the surface potential variations were attributed
to hydrogen produced by cathodic reactions during corrosion processes [14]. In fact, the potential measured by KFM shows a clear chemical contrast allowing various metallurgical phases down to 100 nm in size to be differentiated with noise below 1 mV. However, the use of KFM measurements and analyses require many precautions because the relationship between the KFM potentials and local electrochemistry is non-trivial [15]. As mentioned by Rohwerder and Turcu, the originally reported correlation between the KFM potential and the corrosion potential was not necessary valid and required further systematic study
[16]. Recently, a rigorous calibration of the KFM technique con-firmed the correlation between the inverted KFM potential and corrosion potential measured by a scanning Kelvin probe (SKP) in 80% relative humidity[17]. To the best of the authors’ knowledge, KFM has never been successfully used to locate hydrogen diffusion phenomena in corroded 2024 aluminium alloy. A recent work[18]
demonstrated that KFM can locate hydrogen with high resolution in cathodically hydrogen-charged 2024 alloy. In this paper, the contribution of hydrogen to the corrosion of 2024 alloy exposed to thermal and environmental cycling in chloride media was investigated by a combined KFM and SIMS study.
2. Experimental
2.1. Material/specimen preparation
The aluminium alloy supplied by EADS IW, Suresnes, France, consisted in a 2024-T351 rolled plate with a thickness of 50 mm. The T351 temper corresponds to solution heat treatment at 495◦C
(±5◦C), water quenching, straining and then tempering at room
temperature for 4 days. The composition and microstructure of this plate were presented in a previous study[6]. For KFM and SIMS analyses, the samples were 2 mm × 3 mm × 3 mm (long transverse, LT × short transverse, ST × rolling direction, RD) parallelepipeds. The aim of the analyses was to characterise the corrosion defects in the rolling direction; therefore, the samples were corroded on the ST/LT side and analysed in the perpendicular direction, i.e., the ST/RD side. To perform the KFM and SIMS analyses after the corro-sion tests without any further surface preparation, the ST/LT side of the sample (corroded side) was mechanically polished up to 3 mm, whereas the analysed ST/RD side was mechanically polished up to ¼ mm before the corrosion tests. Next, the samples were exposed to the electrolyte on the ST/LT side, with the other sides isolated from the electrolyte by a protective coating. After the corrosion tests, the samples were ultrasonically cleaned in ethanol and dried in air. The protective coating was removed from the ST/RD side before KFM and SIMS analyses.
2.2. Corrosion tests
The cyclic freezing (CF) corrosion test[6]consisted of three cycles of an 8 h immersion period in 1 M NaCl at room temperature followed by 16 h of exposure to air at −20◦C.
2.3. Secondary ion mass spectrometry (SIMS)
Local chemical analyses were performed by SIMS around the corrosion defects using an IMS 4F/6F Cameca analyser. A highly focused primary Cs+ ion beam of 8 mm in diameter was
scanned across the corrosion defects. Secondary ions resulting from abrasions were analysed point by point to reconstruct a micrograph. Different signals were collected during the analysis. High-resolution mode was used to avoid interferences between the different signals.
2.4. Kelvin probe force microscopy (KFM)
KFM is an electric mode of atomic force microscopy (AFM) that provides the local potential difference of a sample with respect to the tip with a resolution better than 100 nm. KFM measure-ments were performed on a Nanoscope IIIa Multimode atomic force microscope from Digital Instruments equipped with a Quadrex electronic module. The probes were conductive Pt/Ir-coated silicon tips with a 75 kHz resonance frequency cantilever. These long, slen-der tips, with an apex radius of approximately 25 nm on a cantilever of small width and surface area, have optimal geometric character-istics for obtaining a good resolution in the potential maps[19]. The KFM potential scans were collected using the “lift” technique described in previous works[20,21], which allows the topography and surface potential to be obtained simultaneously, line by line, and with minimised cross-talk. KFM involves a two-pass rastering of the surface: on the first pass, the surface topography of a single line scan is acquired by standard tapping mode. On the second pass, at a set lift height from the sample surface, the “drive piezo” that normally vibrates the cantilever in tapping mode is turned off and an oscillating voltage VACsin ωt (with ω/2p near the resonance
fre-quency of the cantilever) is directly applied to the cantilever tip to measure the surface potential. Any DC voltage difference between the tip and the sample will generate an oscillating electric force on the cantilever, which will cause the cantilever to vibrate. The local KFM potential is thus determined by adjusting the DC voltage on the tip until the oscillation amplitude of the cantilever becomes zero. At this point, the tip voltage is the same as the local surface potential. The voltage applied to the cantilever tip is recorded point by point. All KFM measurements were carried out in air at con-trolled room temperature and relative humidity of approximately 40%. KFM potential measurements were carried out at a lift height of 100 nm. Considering this temperature and the fact that the KFM analyses were conducted immediately after the corrosion tests, the hydrogen desorption can be reasonably neglected during analyses. 3. Results and discussion
3.1. Corrosion damage morphologies
Fig. 1shows the SEM micrographs of intergranular corrosion defects developed in 2024 alloy after 72 h of continuous immer-sion in 1 M NaCl solution and after a CF corroimmer-sion test. Defects with significantly more branching are observed for the CF test (Fig. 1b) relative to those observed after continuous immersion for the same duration, i.e., 72 h (Fig. 1a).
The subgrain boundaries of the CF samples were corroded (Fig. 1b), whereas those of the continuously immersed samples were undamaged (Fig. 1a). A mechanism involving a hydrogen contribution to the degradation of the mechanical properties of the corroded sample was proposed in a previous work[7]. Due to the volume expansion of the electrolyte trapped inside the inter-granular defects during the emersion phases at −20◦C, several
consecutive stress states appear during cycling and lead to hydro-gen diffusion, transport and trapping.
3.2. Local chemical analysis
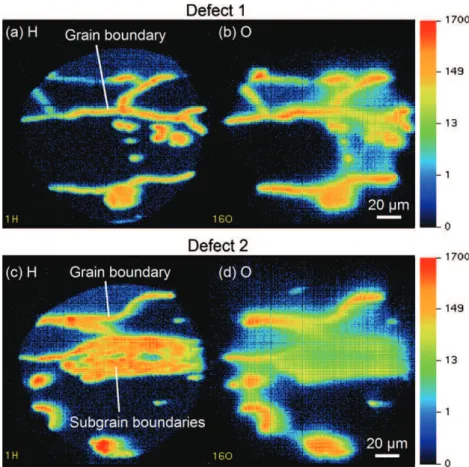
The corrosion defects developed during CF tests were charac-terised by SIMS to evaluate the local chemical composition along and near the intergranular corrosion defects and to locate possi-ble absorbed hydrogen.Fig. 2presents SIMS maps of the hydrogen (Fig. 2a and c) and oxygen signals (Fig. 2b and d), respectively, for two different corrosion defects grown in a 2024 sample submitted to the CF test. For defect 1, both the hydrogen and oxygen signals
Fig. 1. SEM micrographs of intergranular corrosion defects for 2024 samples after 72 h of continuous immersion in a 1 M NaCl solution (a) and a 72 h CF test (b).
are high and superimposed. In this case, it can be assumed that most of the hydrogen signal corresponds to corrosion products, i.e., hydroxides, located at the grain boundaries; subgrain bound-aries seem not to be affected by corrosion or hydrogen. The atomic hydrogen response cannot be decorrelated from the global hydro-gen signal in this case. For defect 2, the hydrohydro-gen and oxyhydro-gen signals are quite different. The hydrogen signal is high in both the grain and subgrain boundaries, i.e., the branched damage observed in
Fig. 2c, whereas the oxygen signal is only elevated in the grain boundaries (Fig. 2d). In this second case, it can be assumed that the grain and subgrain boundaries are affected in different ways. The corrosion products, i.e., hydroxides, are clearly visible at grain boundaries (very high hydrogen and oxygen signals), whereas, for the subgrain boundaries, the hydrogen signal can only be attributed to atomic hydrogen, not hydroxides (no correspondence with the oxygen signal).
Therefore, the SIMS results were in good agreement with pre-vious results that demonstrated that CF testing induced more hydrogen enrichment[6]than continuous immersion in chloride solutions for equivalent immersion times. Hence, the damages observed at the subgrain boundaries by SEM (Fig. 1b) after CF tests could be explained by the atomic hydrogen produced during the corrosion reactions, which diffuses into the material prefer-entially along the subgrain boundaries. Therefore, the subgrain boundaries could be considered as hydrogen diffusion short-circuits[22,23]. Indeed, hydrogen adsorption tends to lower the corrosion potential, as shown in previous work[18]; therefore, it was reasonable to assume that hydrogen increased the corro-sion susceptibility of the subgrain boundaries due, for example, to micro-galvanic coupling with the surrounding material, which had a more anodic potential because of its very low hydrogen content.
Fig. 2. SIMS maps of two different corrosion defects in a 2024 sample after the CF test. Hydrogen (a) and oxygen (b) signals for defect 1. Hydrogen (c) and oxygen (d) signals for defect 2.
Fig. 3. SEM (back-scattered electron) micrography (a), AFM topography (b) and KFM surface potential (c) of the same CF defect of a 2024 sample.
3.3. KFM localisation of absorbed hydrogen
In previous work, KFM has been shown to be useful for detec-ting and precisely locadetec-ting the hydrogen in 2024 alloy samples precharged by a cathodic method [18]. Indeed, the hydrogen-enriched zones were found to have a lower KFM potential than the H-free zone. To corroborate the previous assumption, i.e., that the presence of hydrogen affected the vicinity of the subgrain boundaries (Fig. 2) and was responsible for the corrosion of these subgrain boundaries (Fig. 1), KFM observations of the typical cor-rosion defects were carried out.Fig. 3a presents a corrosion defect observed by SEM in a 2024 sample after the CF test. The topogra-phy (Fig. 3b) and surface potential (Fig. 3c) of the same defect were obtained simultaneously by AFM/KFM.
The first analyses were performed on relatively large corro-sion defects. Corroded grain boundaries can be observed in the back-scattered electron SEM image (Fig. 3a). The contrast of a back-scattered electron image is mostly governed by the atomic number of the material; here, the corrosion products are the darker zones. These corrosion products can also be observed in the AFM topog-raphy as brighter areas, i.e., slightly higher by tens of nanometres. Subgrain boundaries are not observed in the SEM or topography image. It can be assumed that the subgrain boundaries are not sufficiently corroded to exhibit corrosion products. In the KFM surface potential map (Fig. 3c), the grain boundaries are clearly visible, with lower potentials. Such a KFM signal could be related to the presence of atomic hydrogen, as shown in a previous study
[18]. However, it could also be attributed to the presence of alu-mina or aluminium hydroxide as corrosion products. Furthermore, the local evolution of the grain boundary composition, i.e., copper enrichment linked to a selective dissolution phenomenon affecting the intergranular copper-rich particles or grain boundaries[21], could also explain this KFM signal[20,21]. Indeed, the corrosion extent of these grain boundaries would be in good agreement with the dissolution of copper-rich intergranular precipitates. On the other hand, the area marked inFig. 3c reveals a different sur-face potential feature attributed to subgrain boundaries affected by hydrogen. The chemical contrast is visible in neither the electron back-scattered SEM image nor the topography AFM micrograph. On the contrary, the subgrain boundaries were characterised here by a lower KFM potential than the surrounding material. Hence, the subgrain boundaries could be, as demonstrated in the SIMS maps (Fig. 2), hydrogen-affected zones[18].
To corroborate these assumptions, further analyses were per-formed for very slightly corroded grain or subgrain boundaries to avoid interferences in the KFM signal by corrosion products.Fig. 4
shows the AFM/KFM maps of the same area with the associated topography and potential profiles. The topography image reveals slightly corroded grain boundaries with characteristic dimensions
of approximately 50 nm in depth and 2 mm in width. The sur-face potential image reveals much larger “potential-affected zone” around the grain boundaries, with a width of approximately 10 mm. Therefore, the surface potential map revealed chemical composi-tion variacomposi-tions centred on the grain boundary but also extended around it. Given its relatively significant broadening (approxi-mately 8 mm) compared to the AFM signal, this KFM signal cannot be attributed to corrosion products or copper redistribution similar to that observed around corroded copper-rich intermetallic parti-cles[21]. Therefore, the signal was attributed to atomic hydrogen, both in the grain boundary and having diffused from the cor-roded grain boundary to the surrounding material. The results thus showed that both grain boundaries and subgrain boundaries acted as diffusion short-circuits and traps for atomic hydrogen when a 2024 aluminium alloy was submitted to a CF test. The hydrogen was then able to diffuse from the grain or subgrain boundaries into the material, which extended the hydrogen-affected zone[24].
Additional analyses were performed to gain further insight into these phenomena.Fig. 5presents the topography (Fig. 5a) and sur-face potential (Fig. 5b) of the same area of a 2024 sample after the CF test; the profiles inFig. 5c correspond to sections 1 (solid line) and 2 (dashed line) inFig. 5a and b. Comparing the topographical and potential profiles for section 1, which corresponds to a corroded grain boundary, the potential-affected zone is larger than the effec-tive damage (see the topographical profile). This difference could be attributed to hydrogen enrichment around the defect, as proposed earlier. However, it might also be a corroded intermetallic parti-cle with an associated copper redeposit, as observed by KFM in a previous work[21]. However, the SEM observations performed on this zone did not reveal any particles and the enlargement of the potential-affected zone relative to the topography-affected zone was too extended to be attributed to copper redeposition. In sec-tion 2, the grain boundary appeared corroded on the topographical profile but did not correspond to any potential difference regarding the KFM potential of the grain. Thus, even if the grain bound-ary presented chemical variation, e.g., in copper (or eventually a precipitate-free zone), the degree or extension of this chemical variation was insufficient for detection by KFM.
Based on these three results (Figs. 3–5), the enlargement of the potential-affected zone observed inFig. 4was attributed to hydro-gen diffusing from the corroded grain boundary. Indeed, inFig. 4, the potential-affected zone is too extended to be attributed to cop-per redeposit or corrosion products. Therefore, for corroded grain boundaries with a low extension of the corrosion damage, it was assumed that a KFM signal very different from that of the surround-ing matrix could not be attributed to both the corrosion products and copper enrichment. These parameters may have contributed to the KFM signal but could not fully explain the intensity of the KFM signal. In this case, the KFM signal was mainly related to the
Fig. 4. AFM/KFM topography (a), surface potential (b) and associated profiles (c) and (d) along the white dashed lines plotted in (a) and (b), respectively, for a CF corrosion defect developed on 2024 aluminium alloy. In figures (c) and (d), for x axis, d corresponds to the position on the white dashed lines plotted in figures (a) and (b).
presence of atomic hydrogen, confirming that both the grain and subgrain boundaries act as diffusion short-circuits and hydrogen traps in the corroded 2024 alloy. Further analysis confirmed these assumptions. Indeed, if hydrogen was introduced into the corroded 2024 alloy, hydrogen desorption and extended diffusion might be observed if a delay was maintained between the corrosion tests and the KFM measurements, possibly leading to a variation of the
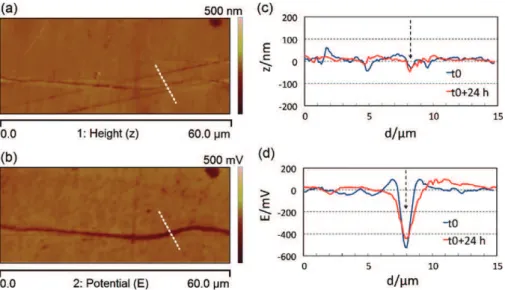
KFM signal.Fig. 6presents the AFM/KFM observations of a 2024 sample after the CF test. The corroded 2024 sample was observed immediately after the CF test and 24 h after the CF test. In the lat-ter case, the sample was kept at room temperature in a desiccator between the two KFM experiments. The associated topographical and potential profiles are presented inFig. 6c and d. Comparing the topographical profiles of the corrosion defect, i.e., a corroded
Fig. 5. AFM/KFM topography (a), surface potential (b) and associated profiles along the solid lines (1) and the dashed lines (2) (c) plotted in (a) and (b) for a CF corrosion defect developed on 2024 aluminium alloy. The arrows in (c) show the location of the corrosion defect on the profiles.
Fig. 6. AFM/KFM topography (a) and surface potential (b) of a 2024 sample just after the CF test. Associated topographical (c) and surface potential (d) profiles (along the white dashed lines) around the corrosion defect observed just after the CF test. Profiles obtained on the same analysis line after 24 h of exposure to air are given for comparison. The arrows in (c) and (d) show the location of the corrosion defect on the profiles.
grain boundary, before and after 24 h of desiccation, no variation is observed for this signal after 24 h of exposure to air. On the other hand, an approximately 30% enlargement of the potential-affected zone is observed inFig. 6d. This KFM signal increase with time invalidates the previously proposed hypothesis, according to which a copper deposit due to grain boundary corrosion and copper redistribution[21]could cause the KFM signal to be more extended than the AFM signal. Indeed, if there was a redistribution of cop-per or another element, no variation of potential during exposure to air would have been observed. Moreover, careful study of the potential profiles (Fig. 6d) revealed a decrease in the potential dif-ference between the defect and the surrounding matrix during the 24 h air exposure. This decrease could correspond to further hydrogen diffusion and desorption during air exposure. Therefore, this observation validates the assumption of hydrogen production during the CF test near the intergranular corrosion defects and its diffusion along the grain or subgrain boundaries, and then inside the grain, as well as its possible desorption when exposed to air for several hours after the corrosion test by the same diffusion pathways. The diffusion of hydrogen produced during the 8 h of immersion in NaCl during the CF test can occur both during and after the CF test. Indeed, as shown in a previous paper, because of the solidification of the electrolyte trapped inside the corrosion defects during the 16 h of exposure to air at −20◦C, a plastic zone
was formed at the tip of the corrosion defects[7]. The stresses generated by the solidification of the electrolyte during the emer-sion period allowed hydrogen to diffuse, albeit slowly due to the low temperature. During the immersion period, the plastic zone allowed hydrogen to diffuse into the material even though no stress was applied by the electrolyte during this period because it was in a liquid phase. Obviously, after the CF test, hydrogen diffusion can continue. Hence, the KFM technique allows not only hydrogen detection and location but also the study of hydrogen diffusion and desorption.
4. Conclusions
SEM, SIMS and AFM/KFM observations were combined to study intergranular corrosion damage resulting from environmen-tal and thermal cyclic corrosion (CF) testing [6]. The hydrogen detection and location capabilities of the KFM technique, demon-strated previously on cathodically charged 2024 samples[18], were
confirmed here on corroded 2024 samples. Hence, AFM corrosion damage analysis combined with KFM gave new insight into both damage morphology and reactivity. These observations were fully consistent with previous results[6,7]and demonstrated that the hydrogen generated by corrosion reactions was localised in the grain and subgrain boundaries. During the CF test and air exposure, its diffusion from the corroded grain boundaries along the sub-grain boundaries was induced by the stress field generated during the emersion period at −20◦C by the volumetric expansion of the
electrolyte trapped inside the intergranular corrosion defects. This diffusion seemed to extend far from the grain boundaries (approxi-mately 10 mm), which contributed to the susceptibility of the grain and subgrain boundaries to corrosion damage and to the decrease of the mechanical properties of the corroded 2024 alloy. KFM is thus a cutting-edge technique for studying the hydrogen embrit-tlement of aluminium alloys, hydrogen diffusion and hydrogen desorption.
Acknowledgments
This work was financially supported by the Conseil Régional de la Région Midi-pyrénées and the Ministère de l’industrie in the framework of the diagnostat project. The authors thank S. Rolet (EADS IW) and S. Van Ver Veen (Airbus) for their help.
References
[1] C. Blanc, B. Lavelle, G. Mankowski, The role of precipitates enriched with copper on the susceptibility to pitting corrosion of the 2024 aluminium alloy, Corrosion Science 39 (1997) 495.
[2] C. Augustin, E. Andrieu, C. Blanc, G. Mankowski, J. Delfosse, Intergranular corro-sion of 2024 alloy in chloride solutions, Journal of the Electrochemical Society 154 (2007) C637.
[3] X. Liu, G.S. Frankel, B. Zoofan, S. Rokhlin, In-situ observation of intergranu-lar stress corrosion cracking in AA2024-T3 under constant load conditions, Corrosion Science 49 (2007) 139.
[4] C.H.R. Boller, T. Seeger, Materials Data for Cyclic Loading: Part D. Aluminum and Titanium Alloys, Elsevier, Amsterdam, 1987.
[5] Aircraft Icing Handbook, Civil Aviation Authority, Lower Hutt, New Zealand, 2000.
[6] C. Larignon, J. Alexis, E. Andrieu, C. Blanc, G. Odemer, J.-C. Salabura, Corrosion damages induced by cyclic exposure of 2024 aluminum alloy in chloride-containing environments, Journal of the Electrochemical Society 158 (2011) C284.
[7] C. Larignon, J. Alexis, E. Andrieu, G. Odemer, C. Blanc, The contribution of hydrogen to the corrosion of 2024 aluminium alloy exposed to thermal and environmental cycling in chloride media, Corrosion Science 69 (2013) 211.
[8] P. Schmutz, G.S. Frankel, Corrosion study of AA2024-T3 by scanning kelvin probe force microscopy and in situ atomic force microscopy scratching, Journal of the Electrochemical Society 145 (1998) 2285.
[9] V. Guillaumin, P. Schmutz, G.S. Frankel, Characterization of corrosion inter-faces by the scanning kelvin probe force microscopy technique, Journal of the Electrochemical Society 148 (2001) B163.
[10] P. Leblanc, G.S. Frankel, A study of corrosion and pitting initiation of AA2024-T3 using atomic force microscopy, Journal of the Electrochemical Society 149 (2002) B239.
[11] T.H. Muster, A.E. Hughes, Applications and limitations of scanning kelvin probe force microscopy for the surface analysis of aluminum alloys, Journal of the Electrochemical Society 153 (2006) B474.
[12] C. Senoz, M. Rohwerder, Scanning Kelvin probe force microscopy for the in situ observation of the direct interaction between active head and intermetallic par-ticles in filiform corrosion on aluminium alloy, Electrochimica Acta 56 (2011) 9588.
[13] C. Senoz, S. Borodin, M. Stratmann, M. Rohwerder, In situ detection of differ-ences in the electrochemical activity of Al2Cu IMPs and investigation of their
effect on FFC by scanning Kelvin probe force microscopy, Corrosion Science 58 (2012) 307.
[14] H. Masuda, SKFM observation of SCC on SUS304 stainless steel, Corrosion Sci-ence 49 (2007) 120.
[15] J.H.W. de Wit, Local potential measurements with the SKPFM on aluminium alloys, Electrochimica Acta 49 (2004) 2841.
[16] M. Rohwerder, F. Turcu, High-resolution Kelvin probe microscopy in corro-sion science: Scanning Kelvin probe force microscopy (SKPFM) versus classical scanning Kelvin probe (SKP), Electrochimica Acta 53 (2007) 290.
[17] A.B. Cook, Z. Barrett, S.B. Lyon, H.N. McMurray, J. Walton, G. Williams, Cal-ibration of the scanning Kelvin probe force microscope under controlled environmental conditions, Electrochimica Acta 66 (2012) 100.
[18] C. Larignon, J. Alexis, E. Andrieu, L. Lacroix, G. Odemer, C. Blanc, Investigation of Kelvin probe force microscopy efficiency for the detection of hydrogen ingress by cathodic charging in a 2024 aluminium alloy, Scripta Materialia 68 (2013) 479.
[19] H.O. Jacobs, P. Leuchtmann, O.J. Homan, A. Stemmer, Resolution and contrast in Kelvin probe force microscopy, Journal of Applied Physics 84 (1998) 1168. [20] L. Lacroix, L. Ressier, C. Blanc, G. Mankowski, Statistical study of the corrosion
behavior of Al2CuMg intermetallics in AA2024-T351 by SKPFM, Journal of the
Electrochemical Society 155 (2008) C8.
[21] L. Lacroix, L. Ressier, C. Blanc, G. Mankowski, Combination of AFM, SKPFM, and SIMS to study the corrosion behavior of S-phase particles in AA2024-T351, Journal of the Electrochemical Society 155 (2008) C131.
[22] T.M. Harris, M. Latanision, Grain boundary diffusion of hydrogen in nickel, Metallurgical and Materials Transactions A 22 (1991) 351.
[23] M. Ichimura, Y. Sasajima, M. Imabayashi, Grain boundary effect on diffusion of hydrogen in pure aluminum, Materials Transactions, JIM 32 (1991) 1109. [24] S.G. Pantelakis, P.G. Daglaras, C.A. Apostolopoulos, Tensile and energy density
properties of 2024, 6013, 8090 and 2091 aircraft aluminum alloy after corrosion exposure, Theoretical and Applied Fracture Mechanics 33 (2000) 117.