Université de Montréal
Comparative Costs and Outcomes of Traumatic Brain Injury from Biking Accidents With or Without Helmet Use
par Camille Costa
Département des Sciences Biomédicales Faculté de Médecine
Mémoire présenté à la Faculté des études supérieures en vue de l’obtention du grade de Maîtrise (M. Sc.)
en Sciences Biomédicales option générale
Août 2014
ii
Université de Montréal Faculté des études supérieures
Ce mémoire intitulé
Comparative Costs and Outcomes of Traumatic Brain Injury from Biking Accidents With or Without Helmet Use
présenté par Camille Costa
a été évaluté par un jury composé des personnes suivantes
Céline Lamarre, président-rapporteur
Jehane Dagher, directrice de recherche
Elaine de Guise, co-directrice
Résumé
Contexte: Évaluer les déterminants de maladies évitables et leurs coûts est nécessaire dans le contexte d’assurance maladie universelle. Le moment d’évaluer les impacts des traumatismes crâniocérébraux (TCC) survenus lors d’accidents de vélo est idéal vu la popularité récente du cyclisme au Québec.
Objectifs: Comparer les caractéristiques démographiques et médicales, ainsi que les coûts sociétaux qu’engendrent les TCC de cyclistes portant ou non un casque.
Méthodologie: Étude rétrospective de 128 cyclistes avec TCC admis à l’Hôpital Général de Montréal entre 2007 et 2011. Les variables indépendantes sont sociodémographiques, cliniques et le port du casque. Les variables dépendantes sont la durée de séjour, l’échelle GOS-E, l’échelle ISS, l’orientation au congé, les décès et les coûts à la société.
Résultats: Le groupe portant un casque était plus vieux, plus éduqué, retraité et marié; au niveau médical, ils avaient des TCCs moins sévères à l’imagerie, des hospitalisations aux soins intensifs plus courtes et moins de neurochirurgies. Les coûts médians à la société pour les TCC isolés de cyclistes avec casque étaient significativement moindres.
Conclusion: Dans cette étude, le port du casque semblait prévenir certaines complications des TCC et permettait de faire économiser de l’argent à l’état. Le port de casque est recommandé. Mots-clés : Trauma Craniocérébral, Pronostic, Coûts, Casque, Vélo, Bicyclette
iv
Abstract
Rationale: Establishing determinants of preventable disease and their societal costs are necessary in the context of publicly funded healthcare. With recent increases in Québec bicyclists, it is an opportune time to evaluate the impact of cycling traumatic brain injuries (TBI).
Objective: Compare demographic and medical characteristics and social costs of cycling TBIs according to helmet status.
Methods: Retrospective study of 128 cyclists with TBI, from a trauma database, admitted to the Montreal University Health Center - Montreal General Hospital (MUHC-MGH) between 2007 and 2011. The independent variables were sociodemographic and clinical characteristics, as well as helmet status. The dependant variables were LOS, GOS-E, ISS, discharge destination, deaths and societal costs, using a bottom up costing approach.
Results: The helmet group tended to be older, more educated, retired and married; from a medical perspective, they had reduced probabilities of severe TBIs on imaging, had shorter intensive care hospitalizations and less neurosurgeries. Median societal costs of TBI were significantly lower when a helmet was used.
Conclusion: In this study, helmets seemed to confer protective effects against certain TBI complications and decreased median overall costs to society. Helmet promotion is recommended.
Table of Contents
Identification of the jury………ii
Résumé………..iii Abstract……….iv Table of Contents………..v List of Tables………vii List of Figures………..viii Acknowledgements………..x List of Abbreviations………xi Introduction………..1 Literature Review……….3
1. Traumatic Brain Injury……….4
1.1 Definitions………..4
1.2 Epidemiology………..9
1.3 TBI due to cycling………..17
2. Cycling……….20
2.1 Global Trends……….20
2.2 Quebec’s Reality………21
vi
2.4 Safety Concerns………..23
2.5 Risk Reduction………...25
3. Helmets……….28
3.1 Quebec Helmet Wearing Practices……….28
3.2 Evidence of Injury Prevention………29
3.3 Non-Legislative Helmet Implementation Strategies………..32
3.4 The Legislation Debate………..33
4. Costs……….39
4.1 Publicly Funded Heath Care………...39
4.2 Economic Burden of Disease……….40
4.3 Cycling TBI Cost-of-Illness Studies………..44
Summary Statement, Rationale and Thesis Goals………46
Methods and Results Study 1……….48
Study 2……….72
5. Discussion………...90
5.1 Summary of Study Findings……….90
5.2 Strengths and Limitations……….98
5.3 Overall Recommendations………...102
Conclusion……….104
List of Tables
Table 1. Glasgow Coma Scale……….6
Table 2. Severity of traumatic brain injuries………....9
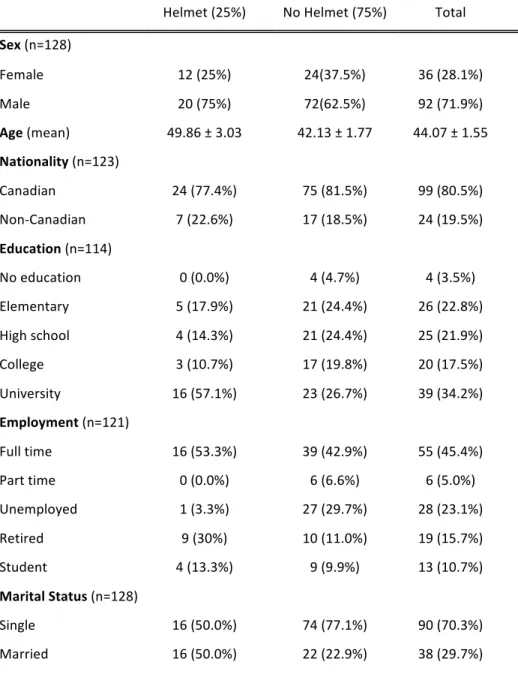
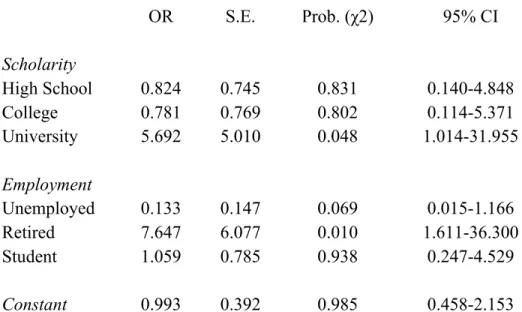
Article 1 Table 1. Demographic Characteristics of Cyclists with TBI, stratified according to helmet wearing status………..57
Table 2. Results of logistic regression analysis for helmet wearing according to demographic factors……….58
Table 3. Accident variables stratified according to helmet status………60
Table 4. Outcome variables stratified according to helmet status………62
Table 5. ICU LOS ordinal regression………...63
Article 2 Table 1. 2013 Costs of neurosurgical interventions according to the RAMQ……….78
Table 2. Cost breakdown stratified according to helmet status in CAN$...82
Table 3. Total societal cost statistics subdivided into isolated TBI and polytrauma cases in CAD$...84
viii
List of Figures
Article 1
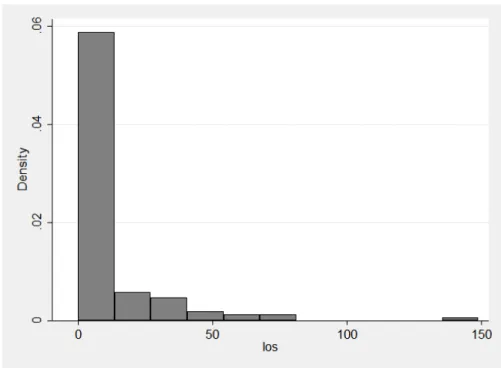
Figure 1. Distribution of ISS scores (n = 126)……….61 Figure 2. Distribution of LOS (n = 128)………..62
To my supportive husband and my sweet daughter, you are my everything.
x
Acknowledgements
First and foremost, I would like to express my gratitude and utmost thanks to my supervisor Dr. Jehane Dagher, for her caring guidance and exceptional contributions. Her expertise, meticulousness, unwavering availability, and positive criticisms throughout the entire process were invaluable. I would also like to thank my co-supervisor, Dr. Elaine de Guise, for her valuable insights, thoroughness, constructive comments and also her expertise.
I would also like to take this opportunity to thank Mitra Feyz for valued help in setting up the design of the studies and enabling the access to the trauma database and chart review. I also wish to thank Julie Lamoureux for her great help in deciphering the statistics. I would like to thank Dr. Abdulrahman El Turki for his diligent work on the Marshall Classification.
To my friends and family, I would like to thank you for your support, love and patience, especially my husband, David Pike.
Finally, I would like to thank the McGill University Health Center-Montreal General Hospital for allowing me to access their patient charts and for the trauma group at the MUHC-MGH for financial support. Also, I would like to thank l’Université de Montréal for allowing me the opportunity to present this masters thesis under their insigne.
List of Abbreviations
AIS Abbreviated Injury Scale CI Confidence Interval
CLSC Centre Local de Services Communautaires CT Computerized tomography
CTE Chronic Traumatic Encephalopathy
ED Emergency Department
EVD External Ventricular Device GCS Glasgow Coma Scale
GOAT Galvaston Orientation and Amnesia Test ICU Intensive Care Unit
IRGLM Institut de Réadaptation Gingras Lindsay de Montréal ISS Injury Severity Score
LOC Loss of Consciousness LOS Length of Stay
MSSS Ministère de la santé et des services sociaux
MUHC-MGH McGill University Health Center - Montreal General Hospital MVA Motor Vehicle Accident
OR Operating Room, Odds Ratio PTA Post-traumatic Amnesia
RAMQ Régie de l’assurance maladie du Québec SAAQ Société de l’assurance automobile du Québec S.E. Standard Error
xii TBI Traumatic Brain Injury TCC Traumatisme craniocérébral WHO World Health Organization
Introduction
TBI is a major public health concern; nine percent of all traumas and one fifth of all injury related deaths are believed to be caused by TBIs in Canada [1]. The injuries most likely to cause severe injuries and death in cyclists are TBIs [2, 3]. Studies have shown that in the United-States an estimated 2% of all TBI deaths are caused by “pedal cycle” accidents [4]. The dynamics of recovery from TBIs are complex; largely dependant on severity, certain patients with TBIs require neurosurgical interventions, prolonged hospitalizations in acute care where they may develop a myriad of medical complications, followed by rehabilitation and possible long-term loss of productivity or even death [5, 6].
In the province of Quebec there has been a recent surge in cyclists, likely due to the multiple promotional programs related to active transportation, such as the expansion of cycling infrastructure, as well as the introduction of a bike-share program in Montreal [7, 8]. From 2005 to 2010, Quebec has seen its cycling population grow by approximately 500 000 people [9]. This increase may lead to more TBIs unless preventative measures are put in place [10].
Fortunately, bicycle helmets have been demonstrated to confer protection against TBIs [11, 12]. Despite the convincing evidence of their efficacy, many Quebecers persist in opting against wearing helmets, with certain reports estimating 43 to 54% cycle without protective headgear [8, 13]. With TBIs being such an important cause of morbidity and mortality, it is incumbent upon the public health sector to identify effective preventative actions.
The prolonged hospitalizations and long-term complications can be particularly costly to society, with certain estimates suggesting one patient may cost up to 8 million dollars over
2
their lifetime [14]. Evaluating the economic burden of an illness is all the more relevant in Canada because of universally covered health care access.
The lack of Quebec legislation on bicycle helmets makes the city of Montreal a favourable setting to evaluate the effects of helmet wearing on TBIs. Identifying demographic differences between helmet groups allows for more focused public health interventions. Knowledge of the economic impact of TBIs in cyclists allows for more efficient cost-benefit analysis of these potential public health programs.
Literature Review
In the first section, terms commonly used in defining TBIs are explained and important distinctions between TBIs and head injuries are discussed. TBI general epidemiology is described to better define the repercussions and medical issues associated with TBIs, and the specific problem of TBIs as a result of cycling is outlined. The second section focuses on recent trends in cycling and explains the factors associated with recent increases in ridership. Cycling health benefits and injury risks are also described in order to achieve a more clear and balanced perspective of the issue of TBIs in cycling. The third section discusses current helmet use in Quebec, the literature on helmet effectiveness against TBIs as well as studies evaluating various helmet promotion measures. The effectiveness of helmet legislation at preventing TBIs is a hotly debated subject in the empirical literature, and will be discussed in this section, along with the relevant pros and cons of this approach. The fourth section describes costs associated with TBIs in general as a baseline with which to compare cycling TBIs. Afterwards, there is a brief overview of the Canadian health care system. Lastly, cost studies of TBIs in cyclists are reviewed to use as a comparison to our cost study.
Chapter 1. Traumatic Brain Injury
1.1 DefinitionsIn this section, TBI will be broadly defined and tools used to assess TBI severity and outcomes will be explained. Specific terms used within the TBI definition will also be explained in order to provide the reader with a more complete understanding of TBI nomenclature.
A recent position statement by The Demographics and Clinical Assessment Working Group of the International and Interagency Initiative toward Common Data Elements for Research on Traumatic Brain Injury and Psychological Health defines TBI broadly as “an alteration in brain function, or other evidence of brain pathology, caused by an external force” [15]. The authors go on to explain that an “alteration in brain function” is evidenced by at least one of the following clinical signs: a change in level of consciousness, anterograde or retrograde amnesia, neurological deficits and/or a modification in the person’s mental state [15]. “Other evidence of brain pathology” may be an observable pathology, supported by neuroradiologic exams or laboratory tests [15]. Amongst other mechanisms, the “external force” can be caused by blunt objects, penetrating foreign bodies, explosions, accelerations or decelerations [15].
It is important to distinguish the term TBI from head injury. A head injury is broadly defined as an externally evident trauma to the head [16]. This trauma may or may not be associated with an actual brain injury. Failing to differentiate between both terms in a research
setting can lead to skewed recovery outcomes of TBIs, and perhaps more importantly lead to misdiagnosis, excessive investigations, as well as inappropriate treatment and management.
Once a true diagnosis of TBI is emitted, its severity can further be defined into one of three subcategories: mild, moderate or severe. Grading TBI severity is important from an epidemiological standpoint and has been shown to be helpful in establishing an early prognosis [17]. TBIs are classically graded using the Glasgow Coma Scale (GCS), length of loss of consciousness (LOC) and post-traumatic amnesia (PTA) [18-21]. On imaging, TBIs can be graded using the Marshall Classification. Certain studies comparing TBIs with other bodily injuries favour the injury severity scale (ISS) that can be used to assess and compare severity of injuries of any body part. In the following paragraphs, terms used commonly for assessing TBI severity are explained.
Glasgow Coma Scale (GCS)
The GCS, created in 1974, was originally intended for research purposes, but quickly caught on as a clinically useful tool [18, 19]. It is meant to be a simple scale used to evaluate the initial severity and assist with prognostic determination of acute traumatic and non-traumatic brain injuries [19]. The scale comprises the assessment of three behavioral responses: eye opening, motor response and verbal response (see table 1 for detailed assessment grading) [18]. Many studies have evaluated the interrater reliability of the GCS, with results ranging from moderate to very good reliability, with inexperienced users and an emergency department (ED) setting tending to result in less reliable scores [18, 22-24]. According to a review by Gabbe et al., initial GCS scores have been found to be a good predictor of survival [24]. There is some evidence that, in trauma populations, the GCS is
6
predictive of both short and long term functional status, though some authors question its prognostication value citing the effect of aggressive prehospitalization treatment, inconsistent time post trauma of GCS assessment and improved acute care treatments as causes for confounding the GCS’s ability to predict outcomes [24, 25].
Eye Opening Verbal Response Motor Response 4. Spontaneous 3. To speech 2. To pain 1. None 5. Orientated 4. Confused 3. Inappropriate 2. Incomprehensible 1. None 6. Obeying 5. Localizing 4. Withdraws 3. Abnormal flexion 2. Extensor response 1. None
Table 1: Glasgow Coma Scale [18, 19] Adapted from Teasdale et al. and Jennett et al.
Loss of Consciousness (LOC) and Post-traumatic Amnesia (PTA)
From a neurological standpoint, LOC is defined as an alteration in brain function that results in primitive or absent responses to external stimulation [26]. While no clear consensus definition is agreed upon in the literature for PTA, a recent review has defined it as anterograde amnesia that affects new memory storage and retrieval, as well as retrograde amnesia that incapacitates memory recollection immediately prior to the TBI [27]. PTA can also be defined as the persistence of imperfect Galveston Orientation and Amnesia Tests (GOAT) [28]. The GOAT evaluates orientation to person, place and time as well as memory of events prior to and following a trauma [28]. PTA length is important to assess because it is predictive of long-term prognosis following a TBI, as supported by a prospective study [29].
LOC and PTA are two variables that can easily be confused [15]. Since their respective time lengths in each TBI severity differs (see table 2), a misunderstanding of their definitions can lead to the misclassification of individuals’ TBI severities. Considering that both LOC and PTA influence event recollection of the TBI, gathering collateral information is sometimes necessary. While often impractical, a bystander or an emergency medical service provider are best placed to most accurately assess LOC.
Marshall Classification
Another method to evaluate brain injury severity is the Marshall classification. It was developed by Marshall et al. to provide early prognostication of injuries according to imaging findings on computerized tomography (CT) scans [30]. It correlates with mortality and risk of increased intracranial pressure [30]. Four subgroups of diffuse head injury are defined as follows: Diffuse Injury I have no visible pathology; Diffuse Injury II have preservation of cisterns, a midline shift of 0-5mm and no high or mixed lesion densities >25cc; Diffuse Injury III differs from II by including compressed or absent cisterns; and Diffuse Injury IV differs from III by including midline shifts of more than 5mm [30]. The other two categories are the evacuated mass lesion that includes lesions that require surgical evacuation and the non-evacuated mass lesion are non surgical high or mixed density lesions of >25cc [30].
Injury Severity Scale (ISS)
The ISS allows for the comparison of severity between diverse trauma injuries in patients (e.g. comparing isolated injuries with polytraumas) [31-33]. The scale correlates with mortality, morbidity, and hospital stay amongst other outcomes [32, 33]. The ISS is calculated based on rating each injury according to the abbreviated injury scale (AIS). The AIS uses a
8
gradation from 1 (minor) to 6 (maximal injury, nearly not survivable) for each of the following body regions: head & neck, face, thorax, abdomen, extremities (including pelvis) and external (i.e. skin and subcutaneous tissue) [32-36]. The ISS score is derived by squaring the three highest AIS ratings, and calculating their sum, resulting in ISS values between 0 and 75 [32-34]. A notable exception to the squaring rule is when an injury is attributed an AIS of 6, in which case the ISS is automatically assigned the maximal score of 75 [32, 33].
Now that the common terms used in TBI severity assessment have been delineated, the following section will focus on the various definitions for mild, moderate and severe TBIs.
TBI Severity
The definition of mild TBI in studies is the most contentious of the three TBI severities, as highlighted by a World Health Organization (WHO) neurotrauma taskforce in 2004 and was reiterated in a WHO update in 2014 [20, 37]. Beyond the broad definition of TBI mentioned above, a mild TBI must have a GCS (see tables 1 and 2) of 13-15, that should ideally be evaluated 30 minutes following the injury, or upon first presentation to a health care professional [20]. The individual’s post-traumatic amnesia (PTA) must not exceed 24 hours, loss of consciousness (LOC) must be 30 minutes or less, and if an intracranial lesion is present, it must not require surgical intervention; if any of these parameters are not respected, the severity of the TBI may no longer be considered mild [20]. Given that the term concussion has multiple varying definitions in the literature, it is preferable to use the term mild TBI [38].
The notation of moderate TBI is generally agreed to be defined as a patient having had a TBI with a GCS score between 9-12 upon arrival at the hospital or 30 minutes after the accident [21]. Other definitions include a GCS score of 13 to 15 with an intracranial lesion
necessitating a surgical intervention, LOC longer than 30 minutes but less than 24 hours and/or PTA between 24 hours and 1 week [21]. The designation of severe TBI is reserved for patients with a TBI and GCS score from 3 to 8, LOC longer than 24 hours and PTA longer than 1 week [21]. Of note, in the province of Quebec, moderate TBIs are considered to have PTA between 24 hours and 2 weeks and severe TBIs have PTA of longer than 2 weeks according to an expert consensus established by the minister of health [39].
GCS PTA LOC
Mild 13-15 < 1 day < 30 minutes
Moderate 9-12 1 day < to > 7 days > 30 minutes to < 24 hours
Severe 3-8 > 7 days > 24 hours
Table 2: Severity of traumatic brain injuries [21, 40] Adapted from the Department of Defense/Veteran Affairs 1.2 Epidemiology
TBI represents a significant public health problem and is a leading cause of death and disability in North America. An estimated 1,7 million TBIs occur annually in the United-States according to a recent CDC report [41]. The incidence of patients with TBIs admitted to hospital in the United-States ranges from 180 to 250 per 100 000 population per year [16].
A 2006 report by the Canadian Institute for Health Information identified 16 811 TBI-related hospitalizations in Canada in 2003-2004, representing 9% of all traumas [1]. A review of emergency department visits and hospitalizations in Ontario, Canada found that the average
10
rate of TBIs between 2006 and 2007 was 99,5 and 190,2 per 100 000 citizens for women and men respectively. These numbers are likely an underestimation since they do not include people who consult clinics with mild TBIs that do not require hospitalization or those that were deceased at the scene of the accident.
Sex
Men are 1,4 times more likely to have a TBI than women [41, 42]. This increased risk for men is likely a manifestation of their increased involvement in motor vehicle accidents (MVA); of those who succumb to unintentional injuries worldwide, an estimated 10,7% of men die due to road injuries compared to 0.5% of women [43]. Road injuries include pedal cycle vehicles (e.g. bicycles), motorized vehicles and pedestrian injuries caused by road vehicles [43]. Men are also more likely than women to have TBIs related to assaults [43]. However, elderly women are more likely to sustain a TBI following a fall than men [44]
Age
Incidence of TBI varies greatly by age group, following a bimodal distribution, with young children and the elderly having higher rates of TBIs [1, 41, 45]. In the United-States, very young children (0-4 years) have the highest rates of ED visits for TBI at 1256 per 100 000 population [41]. The elderly (>75 years) have the highest rate of hospitalization and deaths, 339 and 57 per 100 000 people respectively [41]. Canadian data find children (0-19 years) and the elderly (>60 years) nearly tied for the proportions of admissions due to TBI representing respectively 30% and 29% of all TBI admissions [1]. Of note, the number one cause of death for 15 to 34 year olds according to Statistics Canada is unintentional injury, many of which are from TBI caused by MVAs [46].
Other important factors increasing the risk of TBI include belonging to an ethnic minority, having a low socioeconomic status, consuming alcohol, and not wearing protective equipment with transportation related TBI [45]. Additional factors include having lower educational levels, having had previous TBIs and being single [45, 47, 48].
Etiology
The etiologies most commonly associated with TBI are falls, MVAs, and assaults [1, 41]. The proportion of TBIs caused by each etiology depends greatly on the age group. Overall, falls lead to the highest number of ED consultations and hospitalizations in both the United-States (60,7%) and Canada (45%), due mostly to very young (0-4 years) and the increasing contribution from the elderly population [1, 41]. The growing proportion of elderly patients with TBIs may be due to the increasing use of anticoagulation medication in that age group [49]. MVAs and traffic related TBIs account for 17,3% of all TBIs in the United-States, but are the most common cause of death [41]. Assaults represent 10% of all TBI causes [41]. Canadian data show similar percentages, with MVAs representing 23% of TBIs [1]. For those aged between 20 and 39 years, the leading cause of TBI are MVAs (51%), followed by assaults (20%) [1].
Mortality
TBIs account for a significant proportion of deaths from injuries. The percentage of deaths attributable to injuries was 9,6% globally according to the Global Burden of Disease review published in the Lancet in 2013 [43]. A 2010 official report by the Center for Disease Control in the United-States found that TBI made up 30,5% of all injury related deaths [41]. In Canada, an estimated 20% of all traumatic deaths are caused by TBIs [1].
12
In the United-States between 2002 and 2006, 52 000 patients died yearly of the 1,7 million patients with TBI-related injuries [41]. Canadian statistics for 2003-2004 found that 1368 individuals died following their TBI, representing 8% of TBI hospital admissions [1]. Of those 1368 deaths, 59% were in the elderly age bracket [1]. While specific numbers vary according to region and timeframe, it is clear that TBIs are the cause of many deaths.
Mortality is best predicted by initial severity of the TBI [50]. A review on mild TBI found a 0-0,9% mortality whereas an estimated 21% of severe TBIs are fatal within the first 30 days [45, 51]. Another factor influencing mortality rates is age. Patients over 65 years of age are more likely than younger patients to sustain fatal TBIs [50]. The combination of higher risk of incurring severe TBIs and pre-existing comorbidities that impede recovery is thought to explain the higher mortality in the elderly age bracket [50].
Morbidity
Though the majority of TBI patients survive their initial injuries, they may be left with short or long-term cognitive deficits and physical disabilities resulting in a loss of functionality. One source estimates that approximately 2% of the American population are living with disabilities related to a TBI [45].
Life expectancy following a TBI is debated. Certain groups have found that those who survive the initial six months have unaltered ten-year lifespans [45]. One review on the subject found that certain studies found that overall survival may be more than 20 years, but that other studies concluded life expectancy may be shortened by as many as 10-20 years [42]. Long-term survival information on this topic remains sparse.
Those who survive may have activity limiting impairments that impede return to work or lead them to require assistance with daily living tasks [45]. One method commonly used to
measure outcomes is the GOS-E. The GOS-E is an extended version of the original Glasgow Outcome Scale. Both have been widely accepted as valid assessment tools for functional outcomes following TBI [52, 53]. The GOS-E is best determined following a structured interview [53]. According to the guidelines established by Wilson et al., the scoring is as follows: (1) death, (2) vegetative state, (3) lower severe disability. (4) upper severe disability, (5) lower moderate disability, (6) upper moderate disability, (7) lower good recovery and (8) upper good recovery [53].
As was the case with mortality, long-term functional outcomes often depend upon initial TBI severity [42]. As such, the following section has been separated into two distinct parts: the first part will cover mild TBI outcomes and the second part will discuss moderate and severe TBI outcomes.
Mild TBI
Comprehensive reviews by the WHO on the prognosis of mild TBI conducted in 2004 and updated in 2014 found that most patients had little to no disability [51, 54]. Despite early cognitive deficits and self-reported symptoms being described, such as headache, difficulty sleeping, decreased attention, impaired recall and processing speeds, they generally were completely resolved within three months [51], though some studies have found measurable cognitive deficits at six months [54]. Longer length of LOC and lower GCS scores are associated with increased frequency of cognitive deficits and slower recovery of symptoms [54]. The resolution rate of symptoms is estimated at 70% at 3 months and 90-95% at 12 months [51].
It is currently debated whether cognitive symptoms that persist beyond three months after a mild TBI are caused by the TBI itself or by associated injuries and/or medical comorbidities
14
[51]. Factors influencing persistence of symptomatology beyond three months are thought to possibly be litigation, compensation and, in certain instances, positive alcohol levels, positive imaging, advanced age, and polytrauma [51]. One study suggests that no association exists between persistence of cognitive deficits and pain or psychological distress, although it appears that negative expectations can lead to worse results on cognitive testing [54].
Mild TBIs are associated with several medical complications. The risk of seizure increases slightly after mild TBIs, however the cumulative prevalence over 5 years remains low (approximately 0,7%) [55]. After five years, it is generally considered to return to pre-TBI rates [55]. There does not appear to be an increase in brain tumors following a mild TBI [42, 51]. Dementia caused by mild TBI is debated, although a rigorous review by Godbolt found no evidence to support a causal relationship between mild TBI and dementia [56]. Current evidence suggests that repeated mild TBIs might lead to a condition called chronic traumatic encephalopathy (CTE) [57, 58]. CTE used to be called dementia pugilistica. It has best been described in athletes, such as football players or boxers [57, 58]. CTE is thought to be distinguished by its unique pattern of tau neurofibrillary tangles and paucity of beta-amyloid deposits [57]. Information regarding the number of TBIs and their severity, time lag following the TBI, clear diagnostic criteria, incidence and prevalence remain to be clarified [57].
Literature regarding return to work following a mild TBI is controversial [59]. Return to work percentages vary greatly, from only 30% return to modified work at 3-6 months (of which 12% returning to their regular employment) [60] to as high as 87,5% full employment at 6 weeks [61]. A recent prospective study evaluated the effectiveness of a vocational rehabilitation program after a mild TBI (requiring at least 48 hours of hospitalization) for patients who were previously employed or in school full time [62]. Return to work or school
rates were around 7% at 4 weeks, 56% at 3 months, 68% at 6 months and 75% at 12 months without vocational rehabilitation [62]. With vocational rehabilitation, these return to work rates increased to 85-90% at 3-12 months [62]. The 2004 WHO taskforce on mild TBI that included a large group of mild TBI patients not necessitating hospitalization found that return to normal activities occurred for 70% of patients at 3 months [51]. The updated 2014 WHO report on mild TBI found that most studies were in agreement that return to full time work occurred 3 to 6 months post injury, although 5-20% of patients had longer term difficulties returning to work [63]. The differences in return to work following mild TBI emphasize the considerable variability within this group of patients.
The overall prognosis for patients with an isolated mild TBI is generally described as excellent, with the majority experiencing little to no symptoms three months following the event [51]. Most patients are able to return to their previous level of activities [51].
Moderate and Severe TBI
A review of the literature on productivity outcomes in patients with moderate and severe TBIs found that return to paid or unpaid work varied widely from 40% at 6 months to 83,5% at 11 years [42]. Certain studies evaluating strictly severe TBIs found the level of unemployment to be even higher [42]. A Finnish study reporting on outcomes ten years post event stated that the vocational status of 15 patients with severe TBIs remained stable as of 5 years post TBI, with 14 patients having retired and only one working at a less demanding job than pre-TBI [64]. A prospective study by Radford et al. found that, without vocational rehabilitation, less than 5% of patients with moderate and severe TBI were back at work 1 month following their injury, and by 3 months, employment remained stable at 40% until the end of follow-up at 12 months [62]. With vocational rehabilitation, return to work improved to
16
70% at 6 and 12 months [62]. Another prospective study by Grauwmeijer et al. on patients with moderate and severe TBIs without vocational rehabilitation found that return to work rates plateaued at 12 months around 50% [65]. While the studies on return to work are small and have at times conflicting results, returning to paid work for patients following a moderate or severe TBI appears to be possible; around 6 months with vocational rehabilitation following TBI, or at 12 months without intervention [42, 62, 65].
The Grauwmeijer et al. study found that risk factors for unemployment following moderate and severe TBIs were older age, increased length of hospital stay, discharge to a nursing home, psychiatric symptoms (specifically anxiety and depression), low Barthel Index (a measure for level of ADL independence), a GOS under 4 at hospital discharge (death, vegetative state or severe injury), as well as low functional independence and functional assessment measures [65]. Interestingly, employment prior to TBI was not an independent factor in predicting return to work [65].
One review concluded that most studies found a 100% rate of return to independent living for patients with moderate and severe TBI [42]. The studies in the previously mentioned review that identified long-term functional dependence had exclusively evaluated severe TBI [42]. A ten year follow-up of 15 patients with very severe TBIs (defined in the study as PTA >14 days and prolonged LOC), only 6 (40%) regained complete independence as measured by the Barthel Index [64]. Another study of 25 patients with memory impairments following severe TBIs, found that 64% were able to live independently [66]. Therefore, while independence is possible for many, a considerable number of patients with severe TBI require long-term assistance for daily living [42].
From a medical complication perspective, Annegers et al. found that the occurrence of seizures post TBI was strongly associated with the severity of the initial injury [55]. The five-year cumulative probability of seizure was 1,2% for moderate TBIs and 10% with severe TBIs, which are both much higher than for mild TBIs [55]. Posttraumatic epilepsy has been found to be an independent negative prognostic factor in cognitive functioning [67].
1.3 TBI due to Cycling
Ascertaining the scope of the problem relating to TBI caused by cycling is necessary before undertaking steps towards preventing it. The following section will attempt to define the issue of TBI and cycling.
Establishing precise estimates on the proportion of TBIs due to bicycle accidents is challenging given differences in study methodologies. In American emergency departments, the combined yearly incidence of pedestrian and cyclist TBIs was 25 per 100 000 population and accounted for 6,2% of all TBIs [68]. Another, older study, found that 6,4% of TBIs in the state of Minnesota were caused by bicycle accidents and the incidence of fatal TBIs associated with cycling was 1,7 per 100 000 of population [69]. A Center for Disease Control 2004 review found that 3,6% of hospitalizations for TBIs were caused by “pedal cycle” accidents and caused 2% of TBI-related deaths [4]. According to a statement by the American Association of Neurological Surgeons, cycling was the number one cause of sports related head injury in the United-States in 2009, with 85 389 cyclists being treated in emergency departments that year alone [70]. A Canadian review found that over a 10 year period, 2% of all hospitalized injuries were related to biking accidents, of those 24% were related to TBIs [1]. Though figures inevitably vary based on location, time period and study sample, it is evident that TBIs in cycling is a pervasive issue.
18
In the province of Quebec, accidents involving bicycles and road vehicles resulted in 16 deaths and 114 individuals being seriously injured in 2009 [71]. Many studies have found that collision with a motor vehicle is the most common cause of TBI in cyclists [72-74]. While most bicycle-related TBIs are mild, head injuries are among the most severe injuries a cyclist can have; they comprise one third of bicycle related ED visits and two thirds of bicycling deaths [2, 7, 75]. It is estimated that 60 to 80% of bicycle accident related deaths in Quebec are caused by head injuries [76]. Cars are thought to be involved in more than 80% of cyclist deaths in the province [77].
There exists a bimodal distribution of the age of cyclists incurring TBIs, with children under 15 and cyclists above 65 having respective rates of TBI 3,3 and 3,8 times higher than the middle aged group [78]. The younger age group fares better from a prognostic point of view, but it also means that surviving patients live longer with occasionally severe disabilities, causing longer-term morbidity [45]. Mortality from TBI is higher in the elderly, both for TBIs in general [1, 50, 79], and for TBIs resulting from cycling accidents [78].
The male predominance of TBIs is accentuated in cyclists, reaching a three to one ratio when compared with women [1]. This higher proportion may be explained by the fact that men make up two thirds to three quarters cyclists [8]. They are also less likely to follow traffic laws; in Quebec cyclists, it was found that 55% of men stop at a red light compared to 66% of women [8].
While severe cycling injuries (excluding head injuries) have remained stable, a decrease in TBI related to cycling by 46% occurred between 1994 and 2004 in Canada [1]. Comparatively, in Quebec cyclist injuries and deaths have remained relatively stable from 2000 to 2005, the total varying between 200 and 250 cyclists per year [80]. It is worthwhile
noting that other provinces during that time adopted helmet legislation, whereas Quebec did not, perhaps accounting for some of the discrepancy in deaths.
In summary, TBIs are an important and pressing public health issue, being a leading cause of injury-related death and disability around the world. Cyclists are an interesting group to target for preventative measures since the majority of their severe injuries and deaths are caused by TBIs and, as will be described later, there exist effective ways of decreasing the risk of severe injury in cyclists, many of which are not currently being implemented to their realistic potential in Quebec. Furthermore, as will be detailed in the next section, cycling has increased significantly as a mode of transportation, particularly in the province of Quebec, making this population ideal for the implementation of such preventative measures.
Chapter 2. Cycling
2.1 Global TrendsAccording to an independent research group interested in global environmental concerns, bicycle production has been trending upwards for over a decade [81]. This trend is multifactorial, with most important increases likely due to a combination of globally increasing costs of oil and the comparatively inexpensiveness of cycling, public policy changes making cities more bicycle-friendly and the fact that most cities have not attained their maximal cycling potential [81]. More than 50% of all commutes occur with bikes in many Chinese cities, compared to 10-27% of all trips in the reputedly high cycling cities of the Netherlands and Denmark and only 1% of all transit trips in the United States and Australia [81]. Data from the 2000 census shows that Canadians use a bicycle for transit in 1,3% of trips, while Quebecers use it 1,2% of the time [82].
A decidedly global trend is the advent of bike-share programs. The first city to implement such a program was Amsterdam in 1965, where people were provided free bicycles to be returned at multiple locations, however many were stolen or abused making the program difficult to maintain [83]. In the 1990s, the programs evolved to include membership fees and coin operated docking systems [83]. However, it was not until the inclusion in the late 1990s of smartcard technology that the programs began spreading exponentially [83]. Over the past decade, public bicycle sharing has gone from the experimental phase to being fully integrated into many cities worldwide including Paris, Rio de Janeiro, New York City, Shanghai and Montreal [83]. As of 2011, an estimated 375 programs were implemented using approximately 236,000 bicycles [83]. Even children are becoming included in bicycle sharing: as of June 18th
2014, Paris’ bike-share, Vélib’, has launched a version for children called P’tit Vélib’ [84]. The bicycles are available to rented in four sizes with helmets available for rent [84].
2.2 Quebec’s Reality
Recent years have seen a surge in cycling-related initiatives from the provincial government as well as Vélo-Québec. Vélo-Québec is a not-for-profit group whose mandate is to promote cycling in the province in order to improve the well-being and health of Quebec citizens [85]. The “Route Verte”, a project aiming to create a pan-Québec network of bicycle friendly routes to promote cycling tourism in the region, has been continuously expanding since 1995 and currently extends over 5,000 kilometers [7]. To address health issues such as the obesity epidemic and to help curb greenhouse gas emission, a bicycle policy was adopted in 1995 that encourages municipal development of bicycle paths and promotes cycling as a mode of active transportation for school-aged children [7].
Due to Quebec’s harsh winters, the average cycling season lasts 5,6 months [8]. While most people cycle 3 seasons per year, tens of thousands of people cycle all year long in the cities. Certain bicycle paths benefit from snow removal services year-round, though most paths are accessible 7 ½ months per year [8]. A 2010 report by Vélo Québec found that 2 million adults biked at least once weekly, up from 1,8 million in 2005 and 1,6 million in the year 2000 [8]. The promotion of active transportation seems to have been effective in Quebec; while active leisurely activities in adults are generally losing popularity, cycling continues to increase in ridership [8].
An important factor contributing to the increase in cycling, particularly as a method of daily commuting, was the introduction of a bicycle-sharing program in Montreal. The BIXI bicycle, manufactured in Quebec, was first implemented in Montreal in May 2009 [86]. After
22
5 years of operation, the system includes around 5000 bicycles and 400 docking systems across the city [86]. Of note, a majority of the users are between the ages of 15 and 34 years and 85% of subscribers have a university education [8]. BIXI’s important role in active transportation in Montreal is evident; only an estimated 3% of users would have cycled to work had they not had access to BIXI according to a Vélo Québec report [8]. Although possibly underpowered, an initial study evaluating the effects on collisions and near misses following BIXI implementation in Montreal found that with the increase in cycling, the rate of collisions and near misses remained the same [87].
Cities with helmet legislation that have attempted to introduce bicycle sharing programs have had limited success [88]. A study evaluating the barriers to the success of a bike-share program in Brisbane, Australia, where universal mandatory helmet laws are in place, found that access to a bicycle helmet was a great deterrent in convincing non-users to become bike-sharing adepts [88]. Vancouver plans to offer a helmet rental service alongside the BIXI bicycles to circumvent the problem [89], although some people question the hygiene of reusing bicycle helmets [88] . The presence of BIXI in Montreal may make implementation of helmet legislation difficult.
2.3 Benefits of Cycling
Maintaining an active lifestyle is beneficial in the context of the increasing obesity epidemic. An estimated 85% of adults in Canada do not achieve their recommended weekly physical activity targets [90]. The Quebec cycling network is estimated to provide the equivalent of $50 million yearly in health care cost benefits thanks to primary prevention of illness [8]. A 2012 review in the Lancet by Jarrett et al. evaluated the economic impact an increase in active transportation (walking and cycling) would have by decreasing chronic
illnesses [91]. According to their calculations, while an increase of 21% in road traffic injuries could be expected, overall decreases in cardiovascular diseases, diabetes, dementia, breast and colorectal cancer, cerebrovascular disease and depression would by far outweigh the comparatively small increase in injuries [91]. A 2010 study reviewed the literature on the health benefits of cycling and found consistently an inverse linear relationship between rate of physical activity from cycling and all-cause mortality [92]. When compared with driving, the gain in life-expectancy from using cycling as a primary mode of transportation varied between 3 and 14 months, with the benefits of cycling outweighing the risks nine-to-one [92].
Active transportation also helps decrease traffic congestion and contributes to lowering greenhouse gas emissions [7, 8]. Despite global efforts to decrease greenhouse gas emissions from all causes, those due to ground transportation have continued to increase largely due to increasing motor vehicle use [93]. A European study has established that cycling is the most effective mode of transportation to decrease gas emissions [93].
Finally, cycling appears to improve the general quality of life of its users. While people generally dislike driving in traffic on their daily commute, 59% of commuter cyclists enjoy their travels to and from work [8].
2.4 Safety Concerns
Deaths from road injuries alone rank as the eighth cause of death worldwide and the number one cause of injury related deaths [43, 94]. In North America, traffic related accidents are the fifth cause of mortality [43]. While most of these accidents are MVAs, there is a non-negligible proportion of cyclists being injured as well; as previously discussed, an estimated 2% of TBI hospital admissions are due to cycling accidents [1]. Cycling is the primary cause of TBI in sports [70]. Yet, according to Vélo Québec, only 11 out of 1000 cyclists consult
24
doctors for cycling related injuries, which is comparatively half of the consultations for skiing and one third of running consultations [8]. While cyclists may generally require less medical consultations than other sports per capita [8], they tend to have more severe injuries likely due to their higher speeds, risk of collision with motor vehicles and their exposed body parts [95]. Utilizing an algorithm that included both rural and urban environments, a team from the Netherlands estimated that overall 5,5 times more deaths occur while travelling by bicycle than by car for the same number of kilometers [92]. The risk of bodily injury increases when the mechanism of injury is a collision with a motor vehicle [96]. A study that surveyed Kansas cyclists in a metropolitan area found that 43% had had injuries while cycling, most commonly these were mild (self-treated) and involved the extremities [97]. The more severe injuries were more likely to involve MVAs [97]. Cycling accidents leading to injuries requiring hospital admissions appear to be somewhat more frequent in rural areas than urban ones [98]. While the majority of severe injuries involve brain traumatisms, other potentially severe injuries can occur due to intra-abdominal injury (often from handlebar trauma), hemothorax and pneumothorax [99, 100].
Bicycles sold in Quebec (or Canada) are not governed by federal standards, and safety equipment features such as lights and reflectors is the retailers’ responsibility [7]. The Quebec Highway Safety code, however, clearly states that bicycle dealers must only sell bicycles that have: “one white reflector at the front, one red reflector at the rear, one amber reflector on each pedal, one reflector attached to the spokes of the front wheel and one reflector attached to the spokes of the back wheel” [101]. Due to variations in manufacturing requirements abroad, many bicycles sold in Quebec do not comply with these regulations; it ultimately becomes the individual’s responsibility to know the rules and regulations of the road and to make sure their
bicycles comply with them [7]. When reflectors are lacking, cyclists are less visible and therefore at higher risk of MVA [71], and fatalities [7].
2.5 Risk Reduction
There are many variables that impact the risk of injuries in bicyclists. A recent road and safety document for the province of Quebec denotes certain statistics surrounding bicycle accidents [71]. An estimated 85% of accidents occur in residential or commercial neighbourhoods, mainly in zones where the speed limit is 50 km/h or less. Negligence and inattention (on the part of both motorists and cyclists) are the principal causes of fatal accidents. Other notable factors that can result in accidents are: failure to stop at a stop sign, red light or failure to yield the right of way where required, failure to be clearly visible to other road users, and failure to ride in the direction of traffic [71]. Adverse environmental conditions also increase the risk of injuries in general, including TBI. For example, the Quebec ministry of Transportation estimates that accidents occurring at night lead to death in 7% of cases, whereas daytime accidents have a 0,7% death rate [7]. Other causal factors in bicycle accidents are road damage or obstacles and bicycle part failure [99]. A review of safe cycling structures recommended that pathways utilized at night be well lit, that bicycle paths be well maintained and that whenever possible the gradation remain minimal [96].
Safety equipment can be added to bicycles and cyclists in order to increase general safety. As described above, the Highway Safety Code of Quebec clearly states which reflectors are necessary at all times [101]. It also requires the use of a white head light and a red tail light at night [101]. Transport Quebec recommends the use of a horn or bell, a rearview mirror, a safety flag, a touring rack and using tires with reflective strips [7]. The reason for these recommendations is that an estimated 30% of fatalities involving cyclists and motor vehicles
26
occur due to lack of visibility [7]. There is an absence of personal protective equipment (notably helmets) in 40 to 50% of transportation related TBIs [45].
As the number of cyclists increase, the rate of injuries related to cycling accidents decreases, this is known as the “safety in numbers” effect [87]. A study by Jacobsen suggests that as motorists become more accustomed to sharing the road, less cycling accidents occur [102]. This reality may be reflected in Quebec statistics: between 1987 and 2010, the amount of regular cyclists increased by 50%, yet the rate of accidental deaths, serious injuries and minor injuries fell by 58%, 72% and 52% respectively [8]. The increase in cycling following BIXI implementation in Montreal without increase in collisions also supports the safety in numbers theory [87]. Efforts should therefore be made to encourage good safety habits that do not hinder cycling uptake.
A key factor that increases the risk of severe injury and death in cyclists is their proximity to motor vehicles. One study evaluating the causes of death in children cyclists found that all deaths involved a motor vehicle [100]. In Quebec, more than 80% of cyclist deaths involved cars [77].
Considering that cycling-related TBIs are primarily caused by MVA, the issue of cycling specific infrastructure becomes salient in this discussion [72-74]. In a review of the literature on safety of cyclist specific infrastructure, it was found that the safest design was bicycle-specific laneways that physically separate cyclists from motor vehicles [96]. Indeed, a recent study found a steady decline in head injuries following the building of extensive cycling infrastructure in New South Wales, Australia [103]. Such an infrastructure may also explain why the Netherlands have low cyclist injury rates [92]. It is worthwhile to note that the built environment can also encourage more cyclists to use their bicycles to commute, while
contributing to their safety [104, 105]. As suggested by De Jong, it may be more cost effective to invest the money required for helmet legislation into creating safer cycling environments [106].
In summary, while the health benefits of cycling certainly appear to outweigh the risks [92], the fact remains that a significant proportion of cyclists continue to suffer from the long-term consequences of TBIs that could potentially be either avoidable or minimized by employing preventative measures, such as helmet wearing [4, 70]. The next section focuses on the benefits of helmets and various implementation strategies for helmet promotion.
Chapter 3. Helmets
Up to half of TBI related to road accidents occur to people who were not wearing personal protective equipment [45]. It has been demonstrated repeatedly that helmet wearing while cycling is protective against TBI [11, 12, 48, 107, 108]. Yet, despite compelling evidence, helmet wearing among cyclists remains suboptimal, suggesting that many of the TBIs related to cycling might yet be preventable [13, 109].
3.1 Quebec Helmet Wearing Practices
There is currently no provincially mandated legislation with regards to helmet wearing at any age. Helmet wearing enforcement has been a subject of much debate over the years, with multiple bills introduced on the subject, that due to lack of consensus never passed into law [110]. The most recent bill suggested an amendment that would oblige children aged 12 and younger to wear helmets, however it also did not pass into law [110].
Although province-wide legislation does not exist, certain municipalities have implemented their own helmet policies, however few are enforced. Côte-St-Luc, a borough of the city of Montreal, has had a by-law regarding helmet wearing since 1992 [111]. There is also a by-law in the city of Westmount in effect since 1994 [112]. While some fines have been distributed, recently Westmount’s director general has stated that they have no plans on enforcing the by-law [113]. In March 2011, the city of Sherbrooke became the first city in Quebec to legislate and enforce helmet wearing: children 18 years and younger must wear a bicycle helmet while cycling, those who do not are subject to a $30 fine [114]. In conjunction with legislation, the municipality of Sherbrooke implemented school based peer education and
parent targeted education sessions, a social media campaign, and free helmet distribution [115].
Despite lack of legislation, the 2010 data on helmet wearing amongst Quebecers showed an increase from 36% in 1995 to 57% in 2010, with 65% of children under the age of 18 wearing their helmets [8]. A 2008 document on Bicycle Policy published by Transport Québec states: “if the next surveys were to reveal results nearing 40% [helmet usage], the Société [de l’assurance automobile du Québec] could consider proposing that the Minister of Transport establish legislation making the use of helmets mandatory” [7]. Vélo Québec also highlights that the percentage of cyclists who own helmets increased significantly in recent years, from 45% in 1995 to 67% in 2010 [8]. The discrepancy between helmet ownership and helmet wearing suggests that there is room for improvement in helmet wearing compliance.
A 2012 descriptive study on Montreal cyclists’ habits with regards to helmet wearing showed that 46% wear helmets, less than the rest of Quebecers [116]. This discrepancy may be explained by the different habits of BIXI bicycle users compared to other cyclists. Only 12% of people using BIXI bikes wore helmets, compared to 51% of other cyclists [116]. Similar observations of lower helmet use among bicycle sharing program users have been found in other cities [117, 118].
3.2 Evidence of Injury Prevention
A task force on mild TBI estimated that 80-90% of bicycle related TBIs were mild and found there was convincing evidence that helmets substantially reduce bicycle-related TBIs, decreasing the risk by up to 50% [48]. A Swedish group estimated that if all the injured cyclists in their study were considered, a helmet could have prevented deaths in two fifths of cases and decreased the severity of one in five brain injuries [107]. A German study of 4000
30
bicycle crashes found that 2/3 of the head injuries were in head regions that would have been protected by a helmet [119]. Rivara et al. found that helmet use decreases the risk of fatality by 93% [95]. Similarly, a Cochrane systematic review concluded that helmets reduce the risk of TBIs by 88% and more specifically severe TBIs by at least 75% for all age groups and were effective irrespective of the accident mechanism [11]. A meta-analysis by Attewell also concluded that helmets have a clearly protective effect [12]. A recent very large French case-control study found that helmets protected against head injury regardless of mechanism (MVA or not), having the most robust protective effect for severe injuries [120]. As evidenced by the previously described studies, helmet wearing is generally considered to confer a protection against TBIs.
Despite the ample evidence described above, certain authors put into question the protective effect of helmets and question the validity of the methodology of the studies that support it [121-123]. Curnow has written multiple articles putting into question the methodologies of the Attewell meta-analysis, primarily its lack of consideration for angular acceleration injuries as the primary mechanism of brain injury [121]. Curnow also later suggested that while some evidence supports the protective effects of older hard helmets, this cannot be generalized to the more modern helmets [124]. Elvik conducted a re-analysis of Attewell et al.’s meta-analysis [12] on the basis that it had publication and time-trend biases that were unaccounted for [123]. Following the reanalysis, the results still supported a protective effect of helmets against head injuries [123].
To address biomechanical efficacy of contemporary helmets at preventing head injury risk, Cripton et al. conducted paired impacts of a validated anthropomorphic head form with and without a helmet from drops at various heights [125]. The results unequivocally supported the
idea that helmets provide protection against head injuries; at all heights the helmeted head form received less linear acceleration forces than the unhelmeted one [125]. According to a reconstructed bicycle accident model, the forces at play in a representative 20 km/h bicycle accident are similar to a free fall drop from 1.5 meters [126]. An analysis of over 4,000 bicycle crashes in Germany found that the average speed at the time of the crash was 21,3 km/h [119], supporting that a 20 km/h estimate is representative of typical bicycle crashes. The biomechanical study by Cripton et al. found that at the 1.5 meters level, unhelmeted forms had 99,9% probability of having a severe TBI (very likely), compared to 9,3% with a helmet (highly unlikely) [125]. Therefore, there exists biomechanical support to the epidemiological conclusions that helmets protect against brain injuries.
Helmet effectiveness is dependent on many factors. First and foremost, the helmet used should be held to a certain standard of safety. The American Association of Neurological Surgeons recommend helmets approved by the Snell Memorial Foundation, the American National Standards Institute or the American Society for Testing and Materials [70]. In Quebec, the SAAQ recommends wearing a helmet that is approved by the Canadian Standards Association, the Consumer Product Safety Commission or the American Society for Testing and Materials [127]. All of these groups submit the helmets to testing, each with their own drops heights (varying between 1,6 and 2,2 meters) and linear acceleration approval thresholds (250 to 300 g’s or 2452 to 2943 m/s2) [125]. Next, a helmet must be properly fitted and attached so as not to fall off in the event of a cycling accident. Finally, the helmet must be in good condition; helmets are meant to be effective for a one-time crash and should be replaced if there is any suspicion of compromised integrity [128]. Drops from as little as 0,5 meters can cause helmet deformation [125].
32
With biological plausibility [125] and rigorous case-control studies [11, 12] demonstrating their efficacy, helmets are generally believed to prevent head injuries. If an individual uses an approved helmet properly, it is nearly universally accepted that in the event of a crash, the helmet will confer a protection against TBI [106]. What is debated, as highlighted by De Jong, is whether societal measures (more specifically helmet legislation) aimed at imposing helmet wearing are beneficial to society’s health as a whole [106].
3.3 Non-Legislative Helmet Implementation Strategies
The major non-legislative strategies to encourage helmet use amongst cyclists are educational programs, helmet subsidies, helmet legislation, or a combination of those three [129].
Educational campaigns can take various forms: community-based, school-based, physician-based or a combination [129]. Educational campaigns have varying effectiveness, with cyclist helmet use reaching between 15% to 51,8% post implementation [129]. According to the WHO task force on mild TBI, every study reviewed that evaluated educational interventions encouraging helmet use was effective to some extent, although somewhat less in lower socioeconomic groups [48]. The lesser effectiveness of helmet educational campaigns in populations with lower socio-economic status has been corroborated by others [129].
In a theoretical model, Thompson et al. found that subsidies between 5-10$ given to 5 to 9 year olds might realistically increase helmet use from below 10% to 40-50% and be cost-effective [130]. A Cochrane review found that providing free helmets was more cost-effective than subsidizing helmets to increase helmet wearing in children [131]. No studies regarding helmet subsidies for adult populations were found in our literature search.
A community wide multi-promotional approach in Seattle including parental education, school based education and events, promotional television and radio advertisements, and helmet subsidies was found to increase helmet use in children from 5% pre-intervention to 40% over 5 years [132, 133]. In the province of Quebec, after an intensive four-year helmet promotion program amongst children that included subsidised helmets, the rates of helmet wearers went from 1,3% to 33% [76]. While the Quebec results were impressive, the absolute percentage of helmet wearers was significantly less than those found in Ontario and Nova Scotia children following their helmet legislation implementation for minors (65% and over 80% respectively) [75]. Although educational campaigns significantly increase the use of bicycle helmets, it has been observed that they plateau when helmet use reaches between 50-60%, suggesting that other approaches may be required to maximize results [134, 135].
Only one public health campaign targeting adults was identified: the French public health helmet campaign [136]. Its multiple campaigns advertised to a broad age range (youth to 50 year olds) with the message “Helmet use is not compulsory, it is essential” [136]. Helmet use increased from 7,2% to 22% over the 10 years it was in place [136].
A Cochrane review of the subject found that community based approaches that combined education with free helmets were the most effective at increasing helmet uptake among children [131]. Considering there is some evidence that helmet legislation targeted to children increases adult helmet wearing [137], it is possible that a similar adult helmet use increase might exist with non-legislative approaches as well.
3.4 The Legislation Debate
The effectiveness of helmet legislation is greatly debated. There appears to be sufficient evidence that legislation effectively increases the prevalence of helmet use among cyclists [70,
34
137, 138], however, what remains unclear is if the overall number of injuries are decreased following legislations [139].
Increasing Helmet Use
According to Dennis et al., Canadian youth and adults are significantly more likely to wear helmets as the comprehensiveness of helmet legislation increases [138]. Furthermore, even when legislation is specifically aimed at children, a notable increase in helmet uptake in adults is observed [137]. Similarly, the American Association of Neurological Surgeons state that the rate of helmet use in children 14 years and under more than doubled when comprehensive helmet legislation was implemented [70]. Three studies involving legislation of helmet wearing in child cyclists reviewed by the WHO task force on mild TBI found legislation to result in a modest increase in helmet use [48]. A systematic review of the effectiveness of helmet legislation found that all legislation created an increase in helmet uptake among cyclists, with the greatest differences observed in populations where the baseline helmet use was low, and with helmet uptake increasing the more age inclusive the legislation was [2]. A Cochrane review on the subject of helmet legislation also found evidence that legislation increases helmet use [140]. Helmet legislation appears much more effective than educational campaigns at increasing helmet use; over 8 years of educational campaigns, one program accounted for a 30% increase in helmet use, whereas after one year of legislation, helmet use rose from 36% to 73% [2]. Overall, it seems clear that helmet legislation increases helmet use.
Decreases in TBIs
In practice, many studies evaluating the aftereffects of helmet legislation on the prevalence of head injuries have not shown the decreases in injuries that may have been expected considering the increases in helmet use [139, 141]. Of those that have shown decreases, many
![Table 1: Glasgow Coma Scale [18, 19] Adapted from Teasdale et al. and Jennett et al.](https://thumb-eu.123doks.com/thumbv2/123doknet/2068057.6422/18.918.184.731.291.520/table-glasgow-coma-scale-adapted-teasdale-et-jennett.webp)
![Table 2: Severity of traumatic brain injuries [21, 40] Adapted from the Department of Defense/Veteran Affairs 1.2 Epidemiology](https://thumb-eu.123doks.com/thumbv2/123doknet/2068057.6422/21.918.109.779.370.617/severity-traumatic-injuries-adapted-department-defense-veteran-epidemiology.webp)


![Table 1: 2013 Costs of neurosurgical interventions according to the RAMQ [174]](https://thumb-eu.123doks.com/thumbv2/123doknet/2068057.6422/90.918.107.781.491.655/table-costs-neurosurgical-interventions-according-ramq.webp)

