ORIGINAL RESEARCH
Cytotoxic effects of pentachlorophenol (PCP)
and its metabolite tetrachlorohydroquinone (TCHQ)
on liver cells are modulated by antioxidants
Constanze Pietsch&Juliane Hollender&Falk Dorusch& Patricia Burkhardt-Holm
Received: 18 March 2014 / Accepted: 25 June 2014 / Published online: 5 July 2014 # Springer Science+Business Media Dordrecht 2014
Abstract The worldwide distribution and high bioac-cumulation potential of pentachlorophenol (PCP) in aquatic organisms imply a high toxicological impact in aquatic systems. Firstly, our investigations show that, similar to mammalian cell lines, PCP can be metabo-lized to tetrachlorohydroquinone (TCHQ) in the perma-nent cell line derived from rainbow trout liver cells (RTL-W1). Moreover, we demonstrate that PCP as well as its metabolite TCHQ is capable of influencing the viability of these cells. Three cell viability assays were performed to assess possible cellular targets of these substances. Thus, the cytotoxicity of the PCP-derivative TCHQ was shown for the first time in a fish cell line. Further investigations revealed the involve-ment of ROS in the cytotoxicity of PCP and its
metabolite TCHQ. The observation of oxidative stress provides a plausible explanation for the increased cyto-toxicity at higher concentrations especially for PCP and implies possible mechanisms underlying these observa-tions. In addition, antioxidants such as ascorbic acid and quercetin modulate the detrimental effects of PCP and TCHQ whereby both compounds exacerbate the cyto-toxic effects of high PCP and TCHQ concentrations. Keywords Antioxidants . Ascorbate . Cytotoxicity . Oxidative stress . Pentachlorophenol– PCP. Quercetin . Tetrachlorohydroquinone– TCHQ
Abbreviations
EtOH Ethanol
FBS Fetal bovine serum
MeOH Methanol
NR Neutral red
PCP Pentachlorophenol
PI Propidium iodide
RTL-W1 Rainbow trout liver cells ROS Reactive oxygen species SOD Superoxide dismutase TCHQ Tetrachlorohydroquinone
MTT Thiazolyl blue tetrazolium bromide
Introduction
Chlorophenol chemicals are widely distributed in the environment and have even been detected in ambient air
DOI 10.1007/s10565-014-9283-4
C. Pietsch (*)
Institute of Natural Resource Sciences (IUNR), Zurich University of Applied Sciences (ZHAW), Gruental, P.O. Box, 8820 Waedenswil, Switzerland
e-mail: constanze.pietsch@zhaw.ch C. Pietsch
:
P. Burkhardt-HolmMan–Society–Environment, Department of Environmental Sciences, University Basel, Vesalgasse 1, 4051 Basel, Switzerland
J. Hollender
:
F. DoruschEawag, Swiss Federal Institute of Aquatic Science and Technology, Überlandstrasse 133, 8600 Dübendorf, Switzerland
P. Burkhardt-Holm
Department of Biological Sciences, University of Alberta, CW 405 Biological Sciences Building, Edmonton, AB T6G 2E9, Canada
of rural areas and in mountain regions (WHO 1987; Schummer et al. 2006). The frequently occurring per-sistent environmental pollutant pentachlorophenol (PCP) has been proposed to be carcinogenic (WHO 2003). However, literature on toxic mechanisms of ac-tion of PCP at the cellular level is scarce.
PCP is extensively used as a biocide and wood preservative. Additionally, it has been shown that sev-eral environmental chemicals, such as lindane, pentachloronitrobenzene, and pentachlorobenzene, can be metabolized to PCP in animals and plants (Koss and Koransky1978; van Ommen et al.1985; Renner and Mücke1986; WHO2003). Due to its worldwide distri-bution, PCP levels in the range of 0.01–0.09 μM in groundwater have been reported (WHO1987) although, for example, extreme levels of >700μM PCP have been found du e to an industrial point source for chlorophenols (Lampi et al. 1990). Similarly, surface waters are usually contaminated with less than 0.04 μM PCP but industrial effluents introduced as much as 564μM PCP into the environment in the past (WHO1987). Contamination of drinking water usually ranges from 0.00004 to 0.0004μM PCP which is lower than the maximum allowable contamination level of 0.004μM PCP that has been established (WHO1987; US EPA2013).
Although its use is severely restricted in many coun-tries, the worldwide distribution of PCP makes it an important pesticide from a toxicological perspective. Therefore, studies have concentrated on behavior of PCP in the environment and the resulting consequences that are published in approximately 150 peer-reviewed publications per year (Yi et al.2008). Its metabolism in humans has been reported to be extensive in contrast to its elimination which is slow (Proudfoot 2003). Additionally, several studies also determined the toxic potential of this substance. For example, the investiga-tion of cytotoxic effects and cell death mechanisms s h o w e d a n E C5 0 v a l u e a t 2 4 h f o r P C P o f 0.11 mmol L−1, whereas the EC50value at 48 h was calculated to be at 0.06 mmol L−1 in a mammalian fibroblast cell line as determined by the thiazolyl blue tetrazolium bromide (MTT) reduction assay (Chen et al. 2004). However, literature on toxic mechanisms of ac-tion of PCP at the cellular level is scarce. Since PCP shows high stability when dissolved in water (Kulikov and Holder2008) several studies also investigated the effects of PCP on aquatic organisms which can be considered to be quite sensitive to PCP (Johnson and
Finley1980). Accordingly, invertebrates showed LC50 values between 1.09 and 3.68 μM after exposure for 24 h (Song 2007). Moreover, high bioaccumulation factors for PCP in adipose tissue and bile have been shown for fish (Glickman et al. 1977). Furthermore, concentrations of up to 61 μg kg−1 PCP have been measured in cyprinids in a Chinese river system (Ge et al.2007). After an accidental spill of technical PCP, the surviving fish showed accumulation of this sub-stance ranging from 19 to 221 mg kg−1in muscle, gills, and liver for several months (Pierce and Victor1978). In addition, the development of embryos and early life stages of zebrafish and rainbow trout were found to be impaired by PCP exposure (Hodson and Blunt 1981; Zheng and Zhu2005). Impaired growth and detrimental effects on gonadal development have also been ob-served in adult fish belonging to different fish species (Hanson et al. 2007). These findings together with the observation that acute toxicity of PCP to fish occurred after 96 h within a concentration range of 0.19 to 1.28μM depending on the species (Dwyer et al.2005) lead to the conclusion that fish are very sensitive to PCP although the mechanisms for this remain to be investigated.
Finally, fish cell lines have been found to be sensitive to PCP as well. Accordingly, primary hepatocytes and a permanent cell culture from rainbow trout liver, a good cell model for screening chemical toxicity in vitro, have already been used to show cytotoxic effects of PCP (Schreer et al. 2005). Additionally, it was found that PCP is also toxic to the fibroblast-like R1 cell line derived from rainbow trout showing an EC50 of 0.24 mM after incubation for 24 h (Segner and Lenz 1993). Other investigations led to the assumption that fish cell lines are more sensitive to PCP than mamma-lian cell cultures (Castaño and Gómez-Lechón2005).
In the present study, the rainbow trout liver cells (RTL-W1) cells were used to evaluate the mechanisms of cytotoxic effects of PCP and its metabolite tetrachlorohydroquinone (TCHQ) in vitro. The toxic effects of these substances in RTL-W1 cells were con-firmed as a function of chemical concentration by using two cell viability assays, the assay determining uptake of neutral red and the MTT assay to establish their dose-response relationships. In addition, the membrane integ-rity was also analyzed in cells exposed to these sub-stances by using the fluorescent dye propidium iodide to confirm the severeness of the cellular alterations. Furthermore, we are unaware of any published study
that has reported oxidative cell damage to permanent fish cell cultures due to exposure to PCP or its derivative TCHQ. Thus, production of reactive oxygen species (ROS) and activity of the superoxide dismutase (SOD) in cells treated with PCP or TCHQ were analyzed to reveal whether oxidative stress may be responsible for the toxicity of these substances. This may help to eluci-date the basis for the mechanisms and the cellular targets in fish cells when exposed to the chosen chemicals. The antioxidants ascorbic acid and quercetin have been used in order to evaluate whether these agents are capable of increasing the tolerance of the RTL-W1 cells to the detrimental effects of PCP and TCHQ. These studies are important in order to generate baseline data on cytotoxicity in fish cells and to make a significant com-parison of the toxic potency of PCP and its metabolite TCHQ.
Materials and methods Chemicals
All chemicals were obtained from Sigma-Aldrich (Buchs, Switzerland) unless indicated otherwise. PCP was purchased at 98 % purity, whereas TCHQ had a purity of more than 99.5 %. Stock solutions of PCP and TCHQ were prepared in methanol (MeOH) and main-tained in darkness at 4 °C. Ascorbic acid stock solutions were prepared in Earle’s medium, whereas quercetin was solubilized in ethanol (EtOH). Solvent concentra-tions in the exposition media did not exceed 0.1 % (v/v). Cell culture and exposure
The RTL-W1 cells derived from rainbow trout liver cells w e r e m a i n t a i n e d i n c o m p l e t e L - 1 5 m e d i u m (LuBioScience, Lucerne, Switzerland) supplemented with 5 % fetal bovine serum (FBS), 100 U/mL penicil-lin, and 100 μg/mL streptomycin in 75-cm2 culture flasks (TPP Techno Plastic Products AG, Trasadingen, Switzerland) at 19 °C where they were subcultured for 85 times until use. Prior to the experiments, the culture supernatant was discarded and cells were harvested by flushing with 2.5 mL versene (LuBioScience) twice followed by incubation with trypsin (BioSera, Socochim SA, Lausanne, Switzerland) for 3 min. Afterwards, the trypsinization was terminated by addi-tion of 5 mL of L-15 medium containing 5 % FBS. The
cells were centrifuged at 1,000 rpm for 5 min (Megafuge 1.0R, Heraeus), resuspended in complete L-15 medium, and cell numbers were estimated using a Neubauer hemocytometer cell counting chamber. Cells were cul-tured at initial concentrations of 30,000 cells per well on 96-well microtiter plates (TPP Techno Plastic Products AG) overnight. Thereafter, cells were washed with serum-free Earle’s medium (pH=7.0) since it has been shown that effects on apoptosis depend on the presence of serum (Uhl et al.1986). Different concentrations of PCP or TCHQ were applied in the same Earle’s medium to eight wells, respectively, for 24 h. All experiments were run in three independent replicates. In case of combined exposure to antioxidants and PCP or TCHQ, cells were treated with ascorbic acid or quercetin for 4 h followed by addition of PCP or TCHQ. In addition, exposures of cells to ascorbic acid and quercetin alone at serial dilutions in Earle’s medium were performed for 24 h to investigate their effects on cell viability and ROS production.
Determination of PCP and TCHQ in media and cells For verification of PCP concentrations and the produc-tion of TCHQ by RTL-W1 cells, medium samples were taken from freshly prepared solutions before exposure and directly from the cell culture flasks after exposure of cells. Non-adherent cells were removed from medium samples by centrifugation. Volumes of 0.75 mL of these samples were filled in HPLC vials followed by acidifi-cation by addition of 2 μL H3PO4 to each vial. In parallel, adherent cells from cell culture flasks were extracted by washing with 0.5 mL ethanol directly in the cell culture flasks. All samples and extracts were stored at 4 °C until further analyses.
For determination of PCP and TCHQ, separation was carried out by HPLC (Agilent 1100) using a Nucleodur C18 end-capped column (125 × 2 mm) with a ChromCart precolumn (5×3 mm) at 30 °C with a flow rate of 0.5 mL min−1. Methanol (eluent A) and 5 mM potassium hydrogen phosphate (KH2PO4, pH 2.5, elu-ent B) served as mobile phases using the following gradient: 3 min 50 % A, 3 to 5 min increasing to 90 % A, holding up to 10 min and then decreasing rapidly to 50 %. The total run time was 15 min; the injection volume was set to 100 μL. Detection was carried out with a fixed wavelength detector at 265 nm. With these settings, PCP elutes at 8.7 min and TCHQ at 2.2 min.
Calibration was made using PCP and TCHQ stock solutions of 100 mM each. The stock solutions of these standard compounds were prepared in ethanol and di-luted with Earle’s medium to a concentration rage of 0.8 to 100μM PCP and 0.8 to 100 μM TCHQ, respectively. The limit of detection (LOD) estimated from the signal-to-noise ratio was found to be at 0.78 μM whereas a limit of quantitation (LOQ) calculated from the calibra-tion curve was obtained at a concentracalibra-tion of 0.38μM PCP and 0.40μM TCHQ, respectively.
Measurement of cell viability
To analyze the cytotoxicity of the testing compounds, two commonly used cytotoxicity assays were used. These assays have different mechanistic bases and may thus give some hints to the biochemical mechanism of action of the toxicants. Firstly, cell viability after exposure to the different chemicals was measured by assessing the uptake of neutral red (NR, 3-amino-7-dimethylamino-2-methyl-phenanzine hydrochloride) to evaluate membrane integrity and lysosomal function based on the method described by Borenfreund and Puerner (1985) with modifications as described in Pietsch et al. (2011). In parallel, cells were used for MTT assays and propidium iodide (PI) assays to further evaluate mitochondrial activity or membrane integrity as described previously (Pietsch et al.2011). Each value of different test chemicals and control was based on the mean of eight wells. Data for microtiter plate assays for cell viability are presented as arithmetic mean percent-age±standard error of means (SEM) of all experiments and replicates in relation to solvent controls.
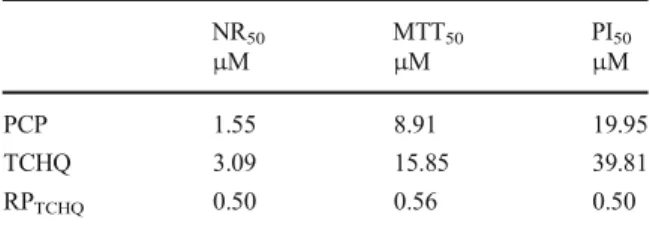
The concentration values resulting in 50 % reduction of cell survival (EC50) were calculated for each com-pound by regression of the percent response to the substance against the natural logarithm of the compound concentration. The resulting regression equations were used to calculate the concentration of compound that would result in 50 % reduction of cell viability. Since metabolites can be even more toxic than the parent compound, the relative potency (RP) of TCHQ was calculated according the equation:
RPTCHQ¼ ECð 50PCPÞ= ECð 50TCHQÞ
Thus, the RPTHCQ values were determined for the NR, the MTT, and the PI assay and compared to each other (Table1). If a metabolite is more toxic than the
corresponding parent compound, the RP value would be expected to be higher than 1.0.
Measurement of ROS production
The production of ROS was analyzed using the fluorescent dye 2′,7′-dichlorodihydrofluorescein diacetate (H2DCF-DA, LuBioScience) in three inde-pendent experiments. After treatment of the cells with PCP or TCHQ at different concentrations for 24 h, the exposure media were removed and the cells were washed with phosphate-buffered saline (PBS). Then, 100 μL of H2DCF-DA (at a final concentration of 5μM) in PBS were added to each well and the plates were incubated for 30 min at room temperature in the dark. For analyses, the excitation and emission wavelengths of 485 nm and 530 nm, respectively, were applied using a microplate reader (Infinite M200, Tecan Group Ltd, Männedorf, Switzerland). Since we did not quench the extracellular fluorescence that might be occur-ring due to leakage of probes, we confirmed the observed effects by assessing the conversion of nitroblue tetrazolium (NBT) salt in parallel. For the NBT test, cells were treated on microtiter plates as described above. After 24 h of incubation, 100 μL of the cell supernatant was replaced by Earle’s me-dium containing 1 mg NBT and cells were further incubated for 3 h. Afterwards, the cell supernatant was discarded and the cells were treated with a methanol-water mixture (7:3, v:v) for 3 min which was followed by short drying of the plates. Formazan products were solubilized by addition of 50 μL of 2 M potassium hydroxide and 50 μL dimethyl sulfoxide (DMSO), and optical densities were measured at 620 nm using a plate reader (Infinite M200, Tecan Group Ltd).
Table 1 EC50values calculated as the concentrations of PCP or
TCHQ that would result in 50 % reduction of cell viability and the values for the relative potency of TCHQ (RPTCHQ) compared to its
parent compound PCP NR50 MTT50 PI50 μM μM μM PCP 1.55 8.91 19.95 TCHQ 3.09 15.85 39.81 RPTCHQ 0.50 0.56 0.50
Measurement of SOD activity
For SOD activity determinations, 0.75×10⁶cells were allowed to adhere in 25-cm2tissue culture flasks (TPP Techno Plastic Products AG) overnight. Before expo-sure to chemicals, cells were washed with Earle’s medi-um and the reagent was added in sermedi-um-free Earle’s medium for 24 h. For the experiments, a duration of exposure of 24 h was chosen since we intended to investigate acute toxicity of PCP and its metabolite TCHQ on RTL-W1 cells, and an increased exposure period does not seem to improve the sensitivity of cell culture testings (Castaño and Gómez-Lechón2005).
After treatment, both attached and unattached cells were harvested. Therefore, supernatants were collected and centrifuged at 300×g for 5 min (Megafuge 1.0R, Heraeus). In addition, adherent cells were trypsinized and the trypsinized cells including floating cells from the medium were combined. All cells were washed with PBS and centrifuged at 1,000 rpm for 5 min at room temperature. Subsequently, the cell pellet was lysed in ice-cold PBS containing Triton X-100 (0.1 %, v/v) and 1 mmol/L phenylmethyl sulfonyl fluoride (PMSF). The resulting lysate was transferred to a glass potter tube and the extract was homogenized manually for 3 min on ice. Thereafter, the samples were stored at −80 °C until determination of SOD activity using the commercial kit from Sigma (Cat.-No. 19160) according to the man-ufacturer’s protocol. In parallel, the protein content was determined after dilution of 50μL of cell extracts with the same volume of PBS, followed by mixing and analyses of the protein concentrations in 25μL aliquots in triplicates using the bicinchoninic acid kit for protein determination (BCA1, Sigma) according to the manu-facturer’s protocol. Protein concentrations were calcu-lated using a standard curve prepared with bovine serum albumin.
Ascorbate assay
Exposure of cells to different concentrations of ascorbic acid was performed in well plates (BD Falcon™ 24-well Multi24-well Plate, Becton Dickinson AG, Allschwil, Switzerland) using 180,000 cells per well. Treatments were performed in duplicate on four independently treated plates. Concentrations of ascorbic acid were analyzed in medium samples and cell extracts according to the method by Vislisel et al. (2007). Medium samples were mixed with methanol and
diethylenetriaminepentaacetic acid (DTPA) to achieve final concentrations of 60 % (v:v) and 250μM, respec-tively. After treatment with ascorbic acid, cells were washed with Earle’s medium. Subsequently, the plates were frozen at −80 °C to achieve lysis of cells. The thawed cells were then incubated with a methanol-water mixture containing DTPA. All extracts were cen-trifuged at 12,000 rpm for 10 min at 4 °C. Subsequently, the supernatant was transferred to new vials which were stored at −80 °C. Prior to analyses, the samples were centrifuged at 16,000 rpm for 1 min at 4 °C. Subsamples of 50μL were used for the assay. Ascorbic acid in the samples was first oxidized to dehydroascorbate by ad-dition of 50μL tempol (4-hydroxy-2,2,6,6-tetramethyl-piperidinyloxy, 2.3 mM in 2 M sodium acetate buffer) per well, followed by short shaking, and addition of 30 μL o-phenylenediamine (OPDA, 5.5 mM in 2 M sodium acetate buffer). Fluorescence emission values were recorded at 450 nm immediately using a plate reader (Infinite M200, Tecan Group Ltd.) with excita-tion at 345 nm. Standard curves were prepared with ascorbic acid diluted to 14 different concentrations rang-ing from 0 to 150μmol L−1using the methanol-water mixture containing DTPA. In parallel, aliquots of the cell homogenates were also used for protein determina-tions using the bicinchoninic acid (BCA) assay (Sigma) according to the manufacturer’s protocol.
Statistics
Data of ROS determinations and cell vitality analyses are presented as the mean±SEM from three independent cell cultures which were measured in eight replicates. Measurements in duplicates were used for analysis of ascorbic acid in medium and cell extracts from eight independent cultures. Effects of treatments were deter-mined by comparison of treatment groups to controls using Friedman test followed by Wilcoxon test (SPSS 9.0 for Windows). A P value of <0.05 was accepted as being statistically significant.
Results
Metabolism and toxicity
In initial experiments, PCP metabolism in RTL-W1 cells was investigated. Accordingly, incubation of cells with PCP leads to an increasing amount of this
substance that could be found in cell extracts (Fig.1a). For example, 93 % of the initial PCP concentrations could be found in the cells when these were exposed to 12.5μM PCP. However, the portion of PCP that could be identified within the cells decreased from 61 to 36 % of the initial PCP concentrations in the according media when the cells were exposed to PCP concentrations higher than 12.5 μM PCP. In all media from PCP-treated cells, TCHQ was identified as a metabolite al-though the amounts of TCHQ were very low (Fig.2, showing the results for incubation of cells with 100μM PCP). As expected, PCP could not be detected in culture supernatants when cells were incubated with TCHQ only (Fig. 2b), although TCHQ concentrations in the media ranging from 2.0 to 76.9μM could be measured. The TCHQ levels within the cell extracts remained below the limit of detection when using the current
method (Fig.1b) which suggests that TCHQ is rapidly metabolized in cells or interacts with cell components and is therefore no longer detectable.
Assessment of membrane integrity using the NR assay and the MTT reduction assay revealed cytotoxic effects of PCP and TCHQ. A concentration of 0.78μM PCP and higher than 1.56μM PCP significantly lowered the up-take of NR by cells (Fig.3a). Although, the MTT assay showed increased dye conversion at concentrations be-tween 0.8 and 6.3μM (Fig.3b), concentrations of more than 6.3μM resulted in a decrease of cell viability mea-sured as a lowered formazan production. Nevertheless, further data analyses showed that the values of NR and MTT assays correlated significantly with each other (Spearman correlation test, R2=0.59, P<0.01). Cell death which was also indicated by increased PI fluorescence was observed at all PCP concentrations (Fig.3c). Relative
0 20 40 60 80 100 120 detected PCP [ M ] 0.8 1.6 3.1 6.3 12.5 25 50 100 nominal PCP concentrations [ M] initial t 24h medium t 24 cells A 0 20 40 60 80 100 120 detected TCHQ [ M ] 0.8 1.6 3.1 6.3 12.5 25 50 100 nominal TCHQ concentrations [ M] initial t 24h medium t 24 cells B µ µ
µ
µ
Fig. 1 Detection of PCP (a) and TCHQ (b) in media before (initial), after cell incubation for 24 h with PCP or TCHQ (media) and in cell extracts (cells) after exposure determined by means of HPLC analyses
potencies of TCHQ have been calculated for all viability assays showing comparable values independent of the dye that was used for the test (Table1).
Results from further studies (Fig.4a) demonstrated that PCP at a concentration of 12.5μM significantly increased ROS production by hepatocytes as assessed by the fluo-rescent dye H2DCF-DA. However, the ROS production after treatment with 50μM PCP was found to be signif-icantly reduced (P<0.05). Due to higher variability of the fluorescent emission by cells exposed to 100 μM PCP which was probably caused by cellular disturbance and cytotoxic events in these incubations, exposure to this PCP concentration showed only a tendency in reduction of oxidative stress in these cells (P=0.083). In addition, NBT reduction indicated that low concentrations of PCP (0.8 and 1.6μM, respectively) decreased ROS production (P<0.05) by these cells (Fig.4b). The decreased oxidative stress upon exposure to 50μM PCP that has already been
observed using the fluorescent dye (Fig. 4a) was con-firmed. In contrast, the incubation with 100 μM PCP resulted in high NBT conversion (Fig. 4b). Moreover, SOD activity was found to be increased at concentrations higher than 12.5μM PCP (Fig.4c).
Exposure to TCHQ showed mostly similar results compared to the treatment with PCP. Lysosome activity as assessed by the NR assay was impaired by 6.3μM or higher TCHQ levels (Fig.3d). Conversion of MTT was increased at 1.6μM and decreased at 6.3 μM TCHQ or higher concentrations of this substance (Fig. 3e). Moreover, further data analyses showed that the values of NR and MTT assays correlated significantly with each other (Spearman correlation test, R2=0.73, P<0.01). PI fluorescence of cells exposed to TCHQ (Fig. 3f) was increased at concentrations of 3.1μM TCHQ or higher reaching very high levels at the high concentrations 0 20 40 60 80 100 120 140 mAU 1.5 2.9 4.4 5.8 7.3 8.7 10.2 11.6 13.1 14.6
retention time (min)
PCP
PC P TC H Q 0 20 40 60 80 100 120 140 mAU 1.5 2.9 4.4 5.8 7.3 8.7 10.2 11.6 13.1 14.6 retention time (min)TCHQ
TC H Q PC P Fig. 2 HPLC chromatogramms of Earle’s media containing initial concentrations of 100μM PCP and 100μM TCHQ, respectively, incubated with RTL-W1 cells for 24 h. Retention times are 2.2 and 8.7 min for TCHQ and PCP, respectively(P<0.001) compared to the maximal PI fluorescence observed in cells incubated with PCP (Fig.3c).
As can be seen from Fig.4d, ROS production was high at 1.56 μM TCHQ (P<0.05) and decreased at concentrations of 6.3 μM or higher (P<0.01). The NBT conversion was also found to be decreased at this range of concentrations of TCHQ (Fig.4e). However, SOD activity was only elevated in cells exposed to 100μM TCHQ (Fig.4f).
Effects of ascorbic acid on PCP and TCHQ toxicity Exposure to ascorbic acid increased ascorbic acid concentrations that could be detected in RTL-W1
cells in a concentration-dependent fashion (Fig. 5). Since ascorbic acid is also a pro-oxidant especially at high concentrations, possible interference with the assays was investigated. Interference with the NR assay was not observed (Fig. 6a). Only the highest ascorbic acid concentration reduced the measurable level of cellular NR accumulation due to influencing cell adherence during the assay. More importantly, continuous exposure of cells to ascorbic acid during the MTT and NBT assay revealed interference of ascorbic acid with the tetrazolium salts by leading to increased dye con-version (Fig. 6b, c). Thus, a washing step for the following experiments was included.
0 20 40 60 80 100 120 Vita lity (% co n tro l) MetOH 0.78 1.56 3.13 6.25 12.5 25 50 100 * * * *** * ** * ** * ** ** * * A 0 20 40 60 80 100 120 MetOH 0.78 1.56 3.13 6.25 12.5 25 50 100 ** * ** * ** * * * * *** D 0 20 40 60 80 100 120 140 V italit y ( % c o n trol ) MetOH 0.78 1.56 3.13 6.25 12.5 25 50 100 ** *** *** * ** * ** * ** * ** * * B 0 20 40 60 80 100 120 140 MetOH 0.78 1.56 3.13 6.25 12.5 25 50 100 * * * * ** ** * * ** ** * * E 0 200 400 600 800 1'000 P I fluor e scenc e ( % c o nt ro l) MetOH 0.78 1.56 3.13 6.25 12.5 25 50 100 ** * ** * *** ** * *** ** * ** * ** * C 0 200 400 600 800 1'000 MetOH 0.78 1.56 3.13 6.25 12.5 25 50 100 ** * ** * ** * ** * ** * ** * F M PCP M TCHQ µ µ
Fig. 3 Cell viability and membrane integrity after incuba-tion of cells with PCP (a–c) and TCHQ (d–f) for 24 h determined by the uptake of neutral red in RTL-W1 cells , MTT conversion , and PI fluorescence by
RTL-W1 cells at 90 min after dye application ; mean ± SEM,*P < 0.05, **P < 0.01, ***P < 0.001
M PCP M TCHQ 0 2'000 4'000 6'000 ROS p ro d ucti on MetOH 0.78 1.56 3.13 6.25 12.5 25 50 100 * * A 0 2'000 4'000 6'000 MetOH 0.78 1.56 3.13 6.25 12.5 25 50 100 * * * * ** ** *** ** D 0 20 40 60 80 100 120 140 160 ROS p ro d ucti on ( % co ntro l) MetOH 0.78 1.56 3.13 6.25 12.5 25 50 100 * ** * * * B 0 20 40 60 80 100 120 140 160 MetOH 0.78 1.56 3.13 6.25 12.5 25 50 100 ** * ** * ** * ** * *** E 0.0 0.5 1.0 1.5 2.0 2.5 SOD ( U mg -1 pr o te in -1) MetOH 0.78 1.56 3.13 6.25 12.5 25 50 100 * * ** C 0.0 0.5 1.0 1.5 2.0 2.5 MetOH 0.78 1.56 3.13 6.25 12.5 25 50 100 * F µ µ
Fig. 4 Oxidative status in RTL-W1 cells measured as ROS production assessed by fluorescence units emitted by H2DCF-DA or the NBT assay (expressed relative to control measurements), compared to the SOD
activity (expressed as U mg protein−1) after incuba-tion of RTL-W1 cells with PCP (a–c) or TCHQ (d–f) for 24 h, mean ± SEM,*P < 0.05, **P < 0.01, ***P < 0.001 0 5 10 15 20 25 30 35 40 ascorbate in cells ( M ) Earle`s 7.8 15.6 31.3 62.5 125 250 500 750 1000 1500
**
*
*
**
**
**
** ** **
*
ascorbate in media ( M) µ µFig. 5 Uptake of ascorbic acid by RTL-W1 cells measured as fluorescence units after exposure to different
concentrations of ascorbate in Earle’s medium (displayed as nominal concentrations on the x-axis) for 24 h, mean ± SEM,*P < 0.05, **P < 0.01
Addition of ascorbic acid before incubation with 12.5μM PCP significantly increased NR retention in cells (Fig.7a) and did not change MTT conversion by cells (Fig.7b). In contrast, exposure to 50μM PCP after ascorbic acid addition leads to strongly reduced NR levels in cells (Fig 7d) and increased MTT signals (Fig. 7e). The NBT conversion was increased by co-exposure of 250μM ascorbic acid and 12.5 μM PCP
(Fig. 7c), whereas all ascorbic acid concentrations in-creased ROS production when 50μM PCP were added to the cells (Fig.7e). Preconditioning of RTL-W1 cells with ascorbic acid followed by exposure to 12.5 μM TCHQ led to increased NR values at ascorbic acid concentrations of 1,000 μM and below that (Fig.8a). In contrast, co-exposure of ascorbic acid and 50 μM TCHQ led to reduced NR retention of cells at all
0 20 40 60 80 100 120 140 vital ity (% contr o l) contr 7.8 15.6 31.3 62.5 125 250 500 750 1000 1500 NR NR with wash
A
0 50 100 150 200 250 300 350 400 450 vital ity (% control) contr 7.8 15.6 31.3 62.5 125 250 500 750 1000 1500 MTT MTT with washB
0 200 400 600 800 1'000 ROS producti on (% control) contr 7.8 15.6 31.3 62.5 125 250 500 750 1000 1500 ascorbate [ mol L-1] NBT NBT with washC
µFig. 6 Influence on the cell viability assays (a: NR and b: MTT test) and c: ROS production due to incubation with different ascorbate concentrations, hatched columns display assay procedures including a washing step before addition of assay due compared to procedures without intermediate washing (filled columns), mean± SEM,*P<0.05, **P<0.01, ***P<0.001
ascorbic acid concentrations (Fig. 8d). Reduced MTT conversion was observed at co-exposure of ascorbic acid concentrations higher than 750 μM and TCHQ. Concentrations of more than 250μM ascorbic acid led to reduced ROS production when cells were simulta-neously exposed to 12.5 μM TCHQ, whereas 50 μM TCHQ increased NBT conversion due to co-exposure to 500 and 750 μM ascorbic acid and reduced ROS
production at the highest concentration of ascorbic acid (Fig.8e).
Exposure to 12.5 μM PCP did not lead to differ-ent ascorbic acid concdiffer-entrations in the media after 24 h of exposure compared to the exposure to 50μM PCP (Fig.9a). Similar results were observed for exposures to the two different TCHQ concentra-tions (Fig. 9b). M ascorbate M ascorbate + 12.5 M PCP + 50 M PCP 0 20 40 60 80 100 120 140 160 180 V itali ty (%) 0 250 500 750 1000 1500
**
*
**
*
**
*
**
*
**
*
A
0 20 40 60 80 100 120 140 160 180 0 250 500 750 1000 1500D
**
*
**
*
**
**
*
**
*
0 100 200 300 400 500 V ital ity (% ) 0 250 500 750 1000 1500B
0 100 200 300 400 500 0 250 500 750 1000 1500E
**
*
**
*
**
*
**
*
**
*
0 100 200 300 400 500 ROS pr od uc ti o n ( % ) 0 250 500 750 1000 1500C
**
0 100 200 300 400 500 0 250 500 750 1000 1500F
**
*
**
*
**
*
**
*
*
µ µ µ µFig. 7 Cell viability and ROS production after incubation of cells with different concentrations of ascorbate for 24 h measured as the uptake of neutral red in RTL-W1 cells , MTT conversion , and ROS measurement by NBT conversion with
simultaneous application of 12.5μM TCHQ (a–c) or 50 μM TCHQ (d–f) 3 h after ascorbate addition and inclusion of a washing step with Earle’s medium before dye application, mean ±SEM,*P<0.05, **P<0.01, ***P<0.001
Effects of quercetin on PCP and TCHQ toxicity Quercetin at concentrations of less than 2.5μM did not influence NR and MTT assays (Fig. 10). Therefore, concentrations of 1μM quercetin or less were chosen for co-exposure with PCP or TCHQ. These concentrations did not negatively influence cell viability although ROS production was reduced due to exposure to quercetin concentrations of 0.031 μM or higher.
The cytotoxic effects of 50μM PCP were even more pronounced after preexposure to quercetin which was not observed when 12.5μM PCP were used (Fig.11). In addition, both, 12.5 and 50 μM PCP, led to increased ROS production after combined exposure with querce-tin. The combination of TCHQ and quercetin led to different results showing no cytotoxicity in the NR and MTT assay and reduction of ROS production in some cases (the highest and the lowest quercetin concentra-tion in combinaconcentra-tion with 50 μM TCHQ) (Fig. 12).
M ascorbate M ascorbate + 12.5 MTCHQ +50 M TCHQ 0 20 40 60 80 100 120 140 V ita li ty (% ) 0 250 500 750 1000 1500
A
**
*
**
*
**
*
**
0 20 40 60 80 100 120 140 0 250 500 750 1000 1500**
*
**
*
**
*
**
*
**
D
0 20 40 60 80 100 120 V ita li ty (% ) 0 250 500 750 1000 1500B
**
*
**
0 20 40 60 80 100 120 0 250 500 750 1000 1500E
**
*
**
0 25 50 75 100 125 150 175 200 ROS p rod uc ti on ( % ) 0 250 500 750 1000 1500C
**
**
**
*
0 25 50 75 100 125 150 175 200 0 250 500 750 1000 1500F
*
*
*
µ µ µ µFig. 8 Cell viability and ROS production after incubation of cells with different ascorbate concentrations for 24 h measured as the uptake of neutral red in RTL-W1 cells , MTT conversion , and ROS measurement by NBT conversion with the
simultaneous application of 12.5μM PCP (a–c) or 50 μM PCP (d–f) 3 h after ascorbate addition and inclusion of a washing step with Earle’s medium before dye application, mean ± SEM,*P<0.05, **P<0.01, ***P<0.001
Surprisingly, the values of the NR assays of cells after treatment with all quercetin concentrations in combina-tion with 50 μM TCHQ were found to be strongly increased (Fig.12d).
Discussion
Metabolization of PCP
Our study demonstrated for the first time that RTL-W1 cells are capable of transforming PCP to TCHQ. In other animals, PCP is commonly metabolized to TCHQ and tetrachlorocatechol which can be further oxidized to tetrachloro-1,4-benzoquinone and tetrachloro-1,2-ben-zoquinone via the corresponding semiquinones (van Ommen and van Bladeren 1989; Lin et al. 1999). In our study, only TCHQ was analyzed because other derivatives are often short-lived and difficult to detect. Oxidation of TCHQ and/or the reduction of tetrachloro-1,4-benzoquinone to semiquinones have been reported
to be associated with a redox cycling that generates oxygen radicals. The resulting radicals have often been reported to increase DNA lesions in PCP-treated or TCHQ-treated mice (Sai-Kato et al. 1995; Umemura et al.1999). Oxidative DNA lesions may also be suffi-cient to induce hepatic carcinogenesis in fish which should be the objective of future research.
Since the liver is considered to be a major site for metabolism of PCP, effects of this substance on hepato-cytes have often been investigated, but different assays investigating various endpoints have rarely been applied in one study. Therefore, the degree of inhibition of cell functions in the present experiments was determined by using different endpoints that are useful for identifica-tion of specific patterns of cytotoxicity of a certain chemical. The biphasic response of RTL-W1 cells to PCP observed in our study using the MTT assay con-firmed previous observations in AML mouse hepato-cytes (Dorsey et al. 2004). At higher concentrations, PCP is able to uncouple oxidative phosphorylation and causes damage to mitochondrial membranes (Weinbach 1954; Deichman and Keplinger1981) and morpholog-ical changes in mitochondria have been reported (Smith and Ord1979). Other cytotoxicity assays revealed that compared to other chlorophenols, PCP showed very high inhibition of NR uptake in goldfish-scale cells (Saito et al.1991). High sensitivity of the NR assay to PCP in RTL-W1 cells was also observed in the present study. Moreover, hepatocytes of channel catfish showed dose-dependent cytotoxicity of PCP after 48 h of incu-bation, although these hepatocytes were less sensitive to PCP than the permanent cell culture from rainbow trout used in our study (Dorsey and Tchounwou2004). The observed cytotoxicity in the present study is probably due to interference of this substance with structures and/ or processes that are essential for cell survival and proliferation. Our findings, thus, confirm previous stud-ies reporting that high PCP concentrations were respon-sible for cytotoxic effects of this chemical in mammalian cell cultures. Moreover, our results show a good quan-titative correlation of the NR and the MTT assay which has been observed in mammalian cells treated with PCP as well (Caminada et al.2006).
The observed cytotoxic effects of PCP were also used to calculate EC50values for this substance. Interestingly, the obtained values were quite different from those that already have been reported. For example, primary he-patocytes obtained from rainbow trout showed EC50 values of 16 μM, whereas RTL-W1 cells revealed
0 500 1'000 1'500 2'000 ascor b ate [ m ol L -1] contr 250 500 750 1000 1500 12.5 mol L-1 50 mol L-1 A 0 500 1'000 1'500 2'000 ascor b ate [ m ol L -1] contr 250 500 750 1000 1500
nominal ascorbate concentration [ mol L-1]
12.5 mol L-1 50 mol L-1 B µ µ µ µ µ µ µ
Fig. 9 Ascorbate concentrations in media after simultaneous ex-posure of RTL-W1 cells to 12.5 or 50 μmol L−1PCP (a) or TCHQ (b) measured as fluorescence units (displayed as nominal concentrations on the x-axis) for 24 h, mean ± SEM,*P<0.05, **P<0.01
EC50values at concentrations between 19 and 22μM, depending on the fluorescent dye that was chosen for cell vitality analyses (Schreer et al. 2005). The NR50 values for other rainbow trout cell lines treated with PCP for 24 and 48 h ranged from 36 to 90μM (Castaño et al. 1995; Clemedson et al.1998; Repetto et al.2001). Even lower sensitivity has been reported for other fish cell
lines (Babich and Borenfreund 1987; Fent and Hunn 1996). This shows that the exposure system used in the present study was very sensitive to PCP. However, it should be noted that toxicity of PCP is pH dependent (Spehar et al. 1985). Moreover, the presence of FBS, which often has been used for cell exposure in previous studies (e.g. at concentrations of 5 to 10 % by Fent and 0 20 40 60 80 100 120 vitality (% control) etoh 0.008 0.016 0.031 0.063 0.125 0.25 0.5 0.75 1.0 2.5
A
0 20 40 60 80 100 120 140 vit a lity (% control) etoh 0.008 0.016 0.031 0.063 0.125 0.25 0.5 0.75 1.0 2.5B
*
*
*
*
*
*
*
0 20 40 60 80 100 120 ROS production ( % control ) etoh 0.008 0.016 0.031 0.063 0.125 0.25 0.5 0.75 1 2.5 quercetin [ M]*
*
*
*
*
*
*
*
*
*
*
*
*
*
*
C
µFig. 10 Effects of different quercetin concentrations on a: NR
, b: MTT , and c: NBT assays, mean± SEM,*P<0.05, **P<0.01
Hunn1996; Schreer et al.2005, and Dorsey et al.2004), is also known to influence the availability of PCP and therefore sensitivity of cells may have been underestimated (Uhl et al.1986). Fortunately, the pres-ence of FBS is not mandatory for fish cell propagation and can be omitted in short-term exposures without negatively affecting cell viability which is advantageous for the evaluation of cytotoxicity of chemicals (Mothersill et al. 1995; Michel et al. 2014). Still, the experimental design may at least partly explain the observed differences in sensitivity of fish cells to PCP. Cell-specific differences in sensitivity are probably also due to either specific mechanisms of action of PCP or its
biotransformation into TCHQ. A lower EC50value for mammalian liver cells exposed to TCHQ compared to the exposure to PCP has already been noted in HepG2 cells, which was assumed to be due to different mech-anisms of toxicity for these two compounds (Schroeder et al.2012). Together with the study of Fent and Hunn (1996), the lower EC50 values of the NR assays com-pared to the MTT assays in our study suggest a primary role of a lysosomal pathway as a mode of action of PCP and TCHQ in fish cells. Similarly, lysosomes have been described as primary targets of PCP in mammalian Vero cells (Fernández Freire et al.2005) which supports this hypothesis. The present study shows for the first time
0 20 40 60 80 100 120 vit a li ty (% cont ro l) 0 0.031 0.063 0.125 0.250 0.500
*
A
0 20 40 60 80 100 120 0 0.031 0.063 0.125 0.250 0.500D
*
*
*
*
*
0 20 40 60 80 100 120 vitali ty (% cont ro l) 0 0.031 0.063 0.125 0.250 0.500B
0 20 40 60 80 100 120 0 0.031 0.063 0.125 0.250 0.500**
**
**
*
**
E
*
0 50 100 150 200 250 R O S prod uction (%) 0 0.031 0.063 0.125 0.250 0.500 M quercetinC
*
*
*
*
*
0 50 100 150 200 250 0 0.031 0.063 0.125 0.250 0.500 M quercetinF
*
*
+ 12.5 MPCP +50 M PCP µ µ µ µFig. 11 Effects of preexposure to quercetin on the modulation of NR , MTT , and NBT assays by PCP (12.5μM, a-c, and 50μM, d-f), mean±SEM,*P<0.05, **P<0.01
that this is also true for TCHQ in fish cells, although further research should identify the exact target of TCHQ in lysosomal pathways.
The occurrence of cell death after treatment of RTL-W1 cells with PCP was further confirmed using the fluorescent dye propidium iodide. Chen et al. (2004) observed necrosis-like mechanisms which lead to cell death by exposure of a mouse connective tissue fibro-blast cell line to PCP. In contrast, a recent study on Asian stinging catfish (Heteropneustes fossilis) indicated PCP-induced apoptotic events in several cell types (Ali et al. 2013). The use of the PI method in the present study
does not allow distinguishing necrotic cell death from the occurrence of apoptosis although the early onset of increased PI fluorescence favors the former assumption. Nevertheless, further research should provide more ev-idence for this assumption.
The effects of PCP on ROS production in RTL-W1 cells were less pronounced compared to the exposure to TCHQ which has already been observed in HepG2 cells (Schroeder et al. 2012). The observed cytotoxicity of PCP in RTL-W1 cells is probably due to production of ROS which was increased at a concentration of 12.5μM PCP. Furthermore, the observed decrease of ROS
+ 12.5 MTCHQ +50 M TCHQ 0 50 100 150 200 250 300 350 400 0 0.031 0.063 0.125 0.250 0.500 * * * * *
D
0 50 100 150 200 250 300 350 400 vitali ty (% co ntro l) 0 0.031 0.063 0.125 0.250 0.500A
0 20 40 60 80 100 120 140 0 0.031 0.063 0.125 0.250 0.500E
0 20 40 60 80 100 120 140 vita li ty (% contr o l) 0 0.031 0.063 0.125 0.250 0.500B
0 20 40 60 80 100 120 140 160 0 0.031 0.063 0.125 0.250 0.500 M quercetin *F
* 0 20 40 60 80 100 120 140 160 vi tali ty (% co ntro l) 0 0.031 0.063 0.125 0.250 0.500 M quercetin *C
µ µ µ µFig. 12 Effects of preexposure to quercetin on the modulation of NR , MTT , and NBT assays by TCHQ (12.5 μM, a-c, and 50 μM, d-f), mean±SEM,* = P<0.05
production at 50μM PCP may be due to reduced cell viability or detoxification of ROS by cellular systems before excessive ROS production could be detected in our assays. An important part of the enzymatic system for the detoxification of ROS is realized by SOD. In our study, high PCP concentrations increased the SOD ac-tivity in RTL-W1 cells. Nevertheless, it can be assumed that the activation of the antioxidative SOD upon expo-sure to high PCP concentrations was not sufficient to prevent cell damage by ROS. This supports the assumed hazardous potential of PCP in liver cells.
According to Tsai et al. (2001) two pathways of metabolism for PCP are possible. In the present study, it was shown for the first time that fish cells are able to metabolize PCP to TCHQ by one of these mechanisms which is supposed to enhance toxicity and carcinoge-nicity of PCP in rodents (Lin et al.1999; Umemura et al. 1999). Thus, TCHQ was also evaluated for possible cytotoxic effects in RTL-W1 cells, which suggested that incubation with TCHQ alone does not lead to more toxic effects in RTL-W1 cells than the exposure to PCP since the RPTCHQ values were lower than 1. However, it is necessary to consider that cells treated with PCP also biotransform this substance to TCHQ within 24 h, and the resulting effects on cell viability are mixed effects of both substances and possible further metabolites. Thus, it is not reasonable to fully estimate the cytotoxicity of TCHQ based on the conducted experiments, and further research is needed to clarify the cytotoxic potency of TCHQ compared to PCP.
Since TCHQ is known to induce oxidative stress in rodents (Lin et al. 1999; Umemura et al. 1999), the effects of TCHQ on ROS production were also evaluat-ed in our studies. Similar to the previous experiments using PCP, the exposure to TCHQ induced ROS pro-duction at a low concentration. Higher concentrations of TCHQ reduced the ROS production which is probably due to its effects on cell viability and activation of antioxidative mechanisms in TCHQ-treated cells that are not sufficient to prevent cell death. However, it has been suggested that the effects of PCP and TCHQ on cell viability also depend on the cell type (Wang et al. 1997, 2000), and species-dependent differences in the quantitative metabolism of PCP have been observed in mice and rats (Lin et al.1999).
In addition, trout is also capable of biotransforming PCP via glucuronidation and to a lesser extent by for-mation of PCP sulfates (Black et al.1995; Cravedi et al. 1999). Consequently, further experiments involving fish
cell lines from different species are currently employed in our labs to study species-specific cytotoxic effects of TCHQ and PCP and the characteristics of their metabolization in detail.
Effects of ascorbic acid and quercetin on PCP and TCHQ toxicity
Exposure to ascorbic acid in medium increased intracel-lular levels of ascorbic acid and increased the tolerance of the RTL-W1 cells to the detrimental effects of PCP and TCHQ to some extent but co-exposure to 50μM PCP revealed that ascorbic acid can also lead to further cellular damage. The beneficial effect of ascorbic acid could be due to its antioxidative capacity and its influ-ence to other antioxidants such as glutathione (Winkler et al.1994). van Ommen et al. (1986) indicated that the benzoquinone or semiquinone form of TCHQ is inhibited by glutathione through conjugation. However, ascorbic acid is also capable of reducing benzoquinones and semiquinones to hydroquinones so that the transformation of PCP to TCHQ and tetrachloro-1,2-hydroquinone (TCoHQ) is increased. This would lead to increased detrimental effects on cells which may have occurred at higher PCP and TCHQ concentrations.
Quercetin is the member of the group of natural compounds called flavonoids which are known to have antioxidative properties that differ from those of ascor-bic acid. Flavonoids are known to scavenge free radi-cals, inhibit lipid peroxidation, and reduce DNA dam-age caused by exposure to mutdam-agenic chemicals (Afanasev et al. 1989; Bors et al. 1994; Sestill et al. 1998). Thus, they are subjects of intense research on the basis of their antioxidant, inflammatory, and anti-cancer activities. In in vitro experiments, quercetin can be effective as an agent reducing the side effects of toxic chemicals without influencing intracellular antioxidants such as glutathione (Kook et al.2008).
Quercetin alone was not found to be toxic to RTL-W1 cells exposed for 24 h which is in agree-ment to other reports on mammalian cell lines that used considerably higher quercetin concentrations (up to 100 μM) but treated the cells for only 30 min (Sestill et al. 1998). Although quercetin reduced the ROS production alone, it could not prevent toxic effects of PCP and especially at the higher PCP concentration of 50μM, quercetin, par-adoxically, intensified the detrimental effects on the
RTL-W1 cells. Similar responses have also been found in menadione-treated HL-60 cells where co-culture with quercetin prevented DNA damage, but increased the impairment of membrane integrity and did not increase cell viability as it would be expect-ed from an antioxidant (Bestwick and Milne 2001). This is certainly connected to the fact that flavo-noids may also exhibit pro-oxidative characteristics (Miura et al.1998). The phenomenon was therefore called the “quercetin paradox” (Boots et al. 2007), whereby the prevention of oxidative damage by quercetin leads to the formation of highly reactive quercetin-quinone that depletes glutathione levels and increases membrane damages and intracellular calcium concentrations. In contrast, quercetin was able to reduce the negative effects of TCHQ on RTL-W1 cells probably by acting on redox cycles in the cells and/or prevention of apoptotic events as has been shown for oxidative stress in mammalian systems (Kook et al. 2008).
In conclusion, the present study is the first one that showed the occurrence of TCHQ as a metabolite of PCP in fish cells. Moreover, cytotoxic effects due to oxidative stress by PCP or TCHQ in permanent cell lines of fish have not been demonstrated so far. Thus, our study is an important contribution to the understanding of toxic mechanisms of common environmental chemicals, such as PCP and TCHQ. The antioxidants were able to atten-uate the cytotoxic effects of PCP and TCHQ to a certain extent but especially at higher PCP and TCHQ concen-trations, ascorbic acid and quercetin add to the detrimen-tal effects on cells. Nevertheless, it remains to be deter-mined whether PCP and its metabolites would reveal the same effects on cell viability and cell function in vivo.
Acknowledgments The authors owe special thanks to the Bundesamt für Umwelt, Wald und Landschaft (BUWAL) in Bern (Switzerland) for financial support of the project “MicroPoll” (project no. StoBoBio/2004.H.15a) which allowed the initial investigations on effects of PCP on RTL W-1 cells. Grateful acknowledgment is also made for the financial support by the “Fonds zur Förderung von Lehre und Forschung” that belongs to the Freiwillige Akademische Gesellschaft (FAG) in Basel (Switzerland) which enabled us to purchase the plate reader Infinite M200 from Tecan Group Ltd. (Switzerland). Furthermore, the authors like to thank Prof. Kristin Schirmer from the Swiss Federal Institute of Aquatic Science and Tech-nology (Eawag, Dübendorf, Switzerland) for providing the liver cell line established from rainbow trout. In addition, we are grateful to Heidi Schiffer for maintaining the cell cultures and additional help in the laboratory work.
References
Afanasev IB, Dorohzko AL, Brodskii AV, Korstyuk VA, Potapovitch AI. Chelating and free radical scavenging mech-anism of inhibitory action of rutin and quercetin in lipid peroxidation. Biochem Pharmacol. 1989;38:1763–8. Ali MN, Nazam N, Lone MI, Shaikh S, Ahmad W. Evidence of
apoptosis in some cell types due to pentachlorophenol (PCP) in Heteropneustes fossilis. Saudi J Biol Sci. 2013;20:45–9. Babich H, Borenfreund E. In vitro cytotoxicity of organic pollutants
to bluegill sunfish (BF-2) cells. Environ Res. 1987;42:229–37. Bestwick CS, Milne L. Quercetin modifies reactive oxygen levels but exerts only partial protection against oxidative stress within HL-60 cells. Biochim Biophys Acta. 2001;1528:49–59. Black MC, Björkroth K, Oikari A. Probing the routes, rates, and
mechanisms of xenobiotic elimination by rainbow trout (Oncorhynchus mykiss) with a physiological chamber. In: Hughes JS, Biddinger GR, Monas E, editors. Environmental toxicology and risk assessment– Third volume, ASTM STP 1218. Philadelphia: American Society for Testing and Materials; 1995. p. 351–64.
Boots AW, Li H, Schins RPF, Duffin R, Heemskerk JWM, Bast A, et al. The quercetin paradox. Toxicol Appl Pharmacol. 2007;222:89–96.
Borenfreund E, Puerner JA. Toxicity determined in vitro by mor-phological alterations and neutral red absorption. Toxicol Lett. 1985;24:119–24.
Bors W, Michel C, Saran M. Flavonoids antioxidants: rate con-stants for reactions with oxygen radicals. Methods Enzymol. 1994;234:420–9.
Caminada D, Escher C, Fent K. Cytotoxicity of pharmaceuticals found in aquatic systems: comparison of PLHC-1 and RTG-2 fish cell lines. Aquat Toxicol. 2006;79:114–23.
Castaño A, Gómez-Lechón MJ. Comparison of basal cytotoxicity data between mammalian and fish cell lines: a literature survey. Toxicol in Vitro. 2005;19:695–705.
Castaño A, Vega MM, Tarazona JV. Acute toxicity of selected metals and phenols on RTG-2 and CHSE-214 fish cell lines. Bull Environ Contam Toxicol. 1995;55:222–9.
Chen J, Jiang J, Zhang F, Yu H, Zhang J. Cytotoxic effects of environmentally relevant chlorophenols on L929 cells and their mechanisms. Cell Biol Toxicol. 2004;20:183–96. Clemedson C, Barile FA, Ekwall B, Gómez-Lechón MJ, Hall T,
Imai K, et al. MEIC evaluation of acute systemic toxicity. III. In vitro results from 16 additional methods used to test the first 30 reference chemicals and a comparative cytotoxicity analysis. Altern Lab Anim. 1998;26(1):93–129.
Cravedi JP, Lafuente A, Baradat M, Hillenweck A, Perdu-Durand E. Biotransformation of pentachlorophenol, aniline and bi-phenyl in isolated rainbow trout (Oncorhynchus mykiss) he-patocytes: comparison with in vivo metabolism. Xenobiotica. 1999;29:499–509.
Deichman WB, Keplinger ML. Phenols and phenolic compounds. In: Clayton GD, Cayton FE, editors. Patty’s industrial hy-giene and toxicology. New York: John Wiley and Sons; 1981. p. 2567–627.
Dorsey WC, Tchounwou PB. Pentachlorophenol-induced cytotox-ic, mitogencytotox-ic, and endocrine-disrupting activities in channel catfish, Ictalurus punctatus. Int J Environ Res Public Health. 2004;1:90–9.
Dorsey WC, Tchounwou PB, Sutton D. Mitogenic and cytotoxic effects of pentachlorophenol to AML 12 mouse hepatocytes. Int J Environ Res Public Health. 2004;1(2):100–5. Dwyer FJ, Mayer FL, Sappington LC, Buckler DR, Bridges CM,
Greer IE, et al. Assessing contaminant sensitivity of endangered and threatened aquatic species: Part I. Acute toxicity of five chemicals. Arch Environ Contam Toxicol. 2005;48:143–54. Fent K, Hunn J. Cytotoxicity of organic environmental chemicals to
fish liver cells (PLHC-1). Mar Environ Res. 1996;42:377–82. Fernández Freire P, Labrador V, Perez Martin JM, Hazen MJ.
Cytotoxic effects in mammalian Vero cells exposed to pen-tachlorophenol. Toxicology. 2005;210:37–44.
Ge J, Pan J, Fei Z, Wu G, Giesy JP. Concentrations of pentachlo-rophenol (PCP) in fish and shrimp in Jiangsu Province, China. Chemosphere. 2007;69:164–9.
Glickman AH, Statham CN, Wu A, Lech JJ. Studies on the uptake, metabolism, and disposition of pentachlorophenol and pentachloroanisole in rainbow trout. Toxicol Appl Pharmacol. 1977;41:649–58.
Hanson R, Dodoo DK, Essumang DK, Blay J, Yankson K. The effect of some selected pesticides on the growth and repro-duction of fresh water Oreochromis niloticus, Chrysicthys nigrodigitatus and Clarias gariepinus. Bull Environ Contam Toxicol. 2007;79:544–7.
Hodson PV, Blunt BR. Temperature-induced changes in penta-chlorophenol chronic toxicity to early life stages of rainbow trout. Aquat Toxicol. 1981;1:113–27.
Johnson WW, Finley MT. Handbook of acute toxicity of chemicals to fish and aquatic invertebrates. Washington, DC: US Department of Interior, Fish and Wildlife Service; 1980. p. 98.
Kook D, Wolf AH, Yu AL, Neubauer AS, Priglinger SG, Kampik A, et al. The protective effect of quercetin against oxidative stress in the human RPE in vitro. Investig Ophthalmol Vis Sci. 2008;49(4):1712–20.
Koss G, Koransky W. Pentachlorophenol in different species of vertebrates after administration of hexachlorobenzene and pentachlorobenzene. In: Rao KR, editor. Pentachlorophenol: chemistry, pharmacology, and environmental toxicology. New York: Plenum Press; 1978. p. 131–7.
Kulikov SM, Holder BJR. Kinetics of acid-assisted hydrolysis of pentachlorophenol in aqueous media. Kinet Catal. 2008;49: 361–5.
Lampi P, Vartiainen T, Tuomisto J. Population exposure to chlorophenols, dibenzo-p-dioxins and dibenzofurans after a prolonged ground water pollution by chlorophenols. Chemosphere. 1990;20:625–34.
Lin P, Waidyanatha S, Pollack G, Swenberg J, Rappaport S. Dose-specific production of chlorinated quinone and semiquinone adducts in rodent livers following administration of penta-chlorophenol. Toxicol Sci. 1999;47:126–33.
Michel C, Herzog S, de Capitani C, Burkhardt-Holm P, Pietsch C. Natural mineral particles are cytotoxic to rainbow trout gill epithelial cells in vitro. In press in PLOS ONE 2014. Miura YH, Tomita I, Watanabe T, Hirayama T, Fukui S. Active
oxygen generation by flavonoids. Biol Pharm Bull. 1998;21: 93–6.
Mothersill C, Lyng F, Lyons M, Cottell D. Growth and differen-tiation of epidermal cells from the rainbow trout established as explants and maintained in various media. J Fish Biol. 1995;46(6):1011–25.
Pierce Jr RH, Victor DM. The fate of pentachlorophenol in an aquatic ecosystem. In: Rao KR, editor. Pentachlorophenol: chemistry, pharmacology, and environmental toxicology. New York: London Plenum Press; 1978. p. 41–52. Pietsch C, Bucheli T, Wettstein F, Burkhardt-Holm P. Frequent
biphasic cellular responses of permanent fish cell cultures to deoxynivalenol (DON). Toxicol Appl Pharmacol. 2011;256: 24–34.
Proudfoot AT. Pentachlorophenol poisoning. Toxicol Rev. 2003;22:3–11.
Renner G, Mücke W. Transformation of pentachlorophenol. Toxicol Environ Chem. 1986;11:9–29.
Repetto G, Jos A, Hazen MJ, Molero ML, del Peso A, Salguero M, et al. A test battery for the ecotoxicological evaluation of pentachlorophenol. Toxicol in Vitro. 2001;15:503–9. Saito H, Sudo M, Shigeoka T, Yamauchi F. In vitro cytotoxicity of
chlorophenols to goldfish GF-scale (GFS) cells and quanti-tative structure-activity relationships. Environ Toxicol Chem. 1991;10:235–41.
Sai-Kato K, Umemura T, Takagi A, Hasegawa R, Tanimura A, Kurokawa Y. Pentachlorophenol-induced oxidative DNA damage in mouse liver and protective effect of antioxidants. Food and Chemical Toxicology. 1995;33:877–882. Schreer A, Tinson C, Sherry JP, Schirmer K. Application of
Alamar blue/5-carboxyfluorescein diacetate acetoxymethyl ester as a noninvasive cell viability assay in primary hepato-cytes from rainbow trout. Anal Biochem. 2005;344:76–85. Schroeder IE, van Tonder JJ, Steenkamp V. Comparative toxicity
of pentachlorophenol with its metabolites tetrachloro-1,2-hydroquinone and tetrachloro-1,4-benzoquinone in HepG2 cells. Open Toxicol J. 2012;5:11–20.
Schummer C, Sadiki M, Mirabel P, Millet M. Analysis of t-butyldimethylsilyl derivatives of chlorophenols in the atmo-sphere of urban and rural areas in east of France. Chromatographia. 2006;63:189–95.
Segner H, Lenz D. Cytotoxicity assays with the rainbow trout R1 cell line. Toxicol in Vitro. 1993;7:537–40.
Sestill P, Guidarelli A, Dacha M, Cantoni O. Quercetin prevents DNA single strand breakage and cytotoxicity caused by tert-butylhydroperoxide: free radical scavenging versus iron che-lating mechanism. Free Radic Biol Med. 1998;25(2): 196–200.
Smith R, Ord M. Morphological alterations in the mitochondria of Amoeba proteus induced by uncoupling agents. J Cell Sci. 1979;37:217–29.
Song ZH. Effects of pentachlorophenol on Galba pervia, Tubifex sinicus and Chironomus plumousus larvae. Bull Environ Contam Toxicol. 2007;79:278–82.
S p e h a r R L , N e l s o n H P, S w a n s o n M J , R e n o o s J W. Pentachlorophenol toxicity to amphipods and fathead min-nows at different test pH values. Environ Toxicol Chem. 1985;4:389–97.
Tsai CH, Lin PH, Waidyanatha S, Rappaport SM. Characterization of metabolic activation of pentachlorophenol to quinones and semiquinones in rodent liver. Chem Biol Interact. 2001;134: 55–71.
Uhl S, Schmid P, Schlatter C. Pharmacokinetics of pentachloro-phenol in man. Arch Toxicol. 1986;58:182–6.
Umemura T, Kai S, Hasegawa R, Sai K, Kurokawa Y, Williams GM. Pentachlorophenol (PCP) produces liver oxidative stress and
promotes but does not initiate hepatocarcinogenesis in B6C3F1 mice. Carcinogenesis. 1999;20:1115–20.
US EPA. Environmental Protection Agency. Basic information about pentachlorophenol in drinking water. US Environmental Protection Agency Website. Available athttp://water.epa.gov/ drink/contaminants/basicinformation/pentachlorophenol.cfm. Accessed at Nov 20, 2013.
van Ommen B, van Bladeren PJ. Possible reactive intermediates in the oxidative biotransformation of hexachlorobenzene. Drug Metabol Drug Interact. 1989;7:213–43.
van Ommen B, van Bladeren PJ, Temmink JH, Muller F. Formation of pentachlorophenol as the major product of microsomal oxidation of hexachlorobenzene. Biochem Biophys Res Commun. 1985;126:25–32.
van Ommen B, Adang A, Müller F, van Bladeren PJ. The micro-somal metabolism of pentachlorophenol and its covalent bind-ing to protein and DNA. Chem Biol Interact. 1986;60:1–11. Vislisel JM, Schafer FQ, Buettner GR. A simple and sensitive
assay for ascorbate using a plate reader. Anal Biochem. 2007;365(1):31–9.
Wang YJ, Ho YS, Chu SW, Lien HJ, Liu TH, Lin JK. Induction of glutathione depletion, p53 protein accumulation and cellular transformation by tetrachlorohydroquinone, a toxic
metabolite of pentachlorophenol. Chem Biol Interact. 1997;105:1–16.
Wang YJ, Ho YS, Jeng JH, Su HJ, Lee CC. Different cell death mechanisms and gene expression in human cells induced by pentachlorophenol and its major metabolite, tetrachlorohydroquinone. Chem Biol Interact. 2000;128:173–88. Weinbach EC. The effect of pentachlorophenol on oxidative
phos-phorylation. J Biol Chem. 1954;210:300–15.
WHO. Pentachlorophenol in drinking-water. Background docu-ment for preparation of WHO Guidelines for drinking-water quality. Geneva: World Health Organization; 2003. WHO/ SDE/WSH/03.04/62).
WHO. Pentachlorophenol. In: Environmental health criteria. Geneva: World Health Organization; 1987: pp. 2–4. Winkler BS, Orselli SM, Rex TS. The redox couple between
glutathione and ascorbic acid: a chemical and physiological perspective. Free Radic Biol Med. 1994;17(4):333–49. Yi H, Ao XL, Ho YS. Use of citation per publication as an
indicator to evaluate pentachlorophenol research. Scientometrics. 2008;75:67–80.
Zheng M, Zhu L. Toxicity effects of pentachlorophenol on Brachydanio rerio. Yingyong Shengtai Xuebao. 2005;16: 1967–71.