OATAO is an open access repository that collects the work of Toulouse
researchers and makes it freely available over the web where possible
Any correspondence concerning this service should be sent
to the repository administrator:
[email protected]
This is an author’s version published in:
http://oatao.univ-toulouse.fr/25284
To cite this version:
Varenne, Fanny and Makky, Ali and Gaucher-Delmas, Mireille and
Violleau, Frédéric and Vauthier, Christine
Multimodal Dispersion of
Nanoparticles: A Comprehensive Evaluation of Size Distribution with 9 Size
Measurement Methods. (2016) Pharmaceutical Research, 33 (5). 1220-1234.
ISSN 0724-8741
DOi 10.1007/sl 1095016 1867 7
Multimodal Dispersion of Nanoparticles: A Comprehensive
Evaluation of Size Distribution with 9 Size Measurement
Methods
Fanny Varenne 1 • Ali Makky 1 • Mireille Gaucher Delmas2 • Frédéric Violleau3•4 • Christine Vauthier 1
ABSTRACT
Purpose Evaluation of particle size distribution (PSD) of mul
timodal dispersion of nanoparticles is a difficult task due to
inherent limitations of size measurement methods. The pres ent work reports the evaluation of PSD of a dispersion of poly(isobutylcyanoacrylate) nanoparticles decorated with dex
tran known as multimodal and developed as nanomedecine. Methods The nine methods used were classified as batch
particle i.e. Starie Light Scattering (SLS) and Dynamic Light
Scattering (OLS), single particle i.e. Electron Microscopy
(EM), Atomic Force Microscopy (AFM), Tunable Resistive
Pulse Sensing (fRPS) and Nanoparticle Tracking Analysis
(NTA) and separative particle i.e. Asymmetrical Flow Field
Flow Fractionation coupled with OLS (AsFlFFF) size mea
surement methods.
Results The multimodal dispersion was identified using
AFM, TRPS and NTA and results were consistent with those provided with the method based on a separation step prior to on line size measurements. None of the light scattering batch methods could reveal the complexity of the PSD of the dispersion.
Conclusions Difference between PSD obtained from ail size measurement methods tested suggested that study of the PSD of multimodal dispersion required to analyze sarnples by at
r8I Chri.stine Vauthier christine. vauthier@u psu:J fr
1 Institut Galien Paris Su:!, CNRS, Univ. Paris Sud, University Paris Saday, 922 96 Châtenay Malabry, France
2 INP Ecole d'ingénieurs de PURPAN, Département Scierces ,t,.gronaniques & ,t,.groalimentaires, Uriversité de
Toulouse, Toubuse. France
3 INP Ecole d'ingénieurs de PURPAN, Laboratoire de Chmie ,t,.gro Industrielle, Université de Tououse, loulouse, Frarce 4 INRA UMR I0I0CAI, Tououse, France
least one of the single size particle measurement method or a method that uses a separation step prior PSD measurement.
KEY WORDS
light scattering • microscopy • nanoparticletracking analysis · particle size distribution · tunable resistive pulse sensing
ABBREVIATIONS
AFM AsRFFF DCS OLS EM IBCA NTA PCCS PIBCA PSD PTA Qels SdFFF SEM SLS TEM TRPSAtomic force microscopy
Asymmetrical flow field flow fractionation Differential centrifuga! sedimentation Dynamic light scattering
Electron microscopy lsobutylcyanoacryiate Nanoparticle tracking analysis
Photon cross correlation spectroscopy
Poly(isobutylcyanoacrylate)
Particle size distribution Particle tracking analysis
Quasi elastic light scattering
Sedimentation field flow fractionation Scanning electron microscopy
Starie light scattering
Transmission electron microscopy Tunable resistive pulse sensing INTRODUCTION
Nanoparticles have been introduced in many applications in
cluding transport i.e. additives for fuels (1), industrial produc
tion i.e. catalysis (2), cosmetics i.e. sun blocks (3) and medicine
i.e. drug delivery (4), contrast agents for imaging technique
(5-7) or adjuvants potentializing effects of radiotherapy (8,9).
Physicochemical properties of nanoparticles are strongly size
properties knowledge is important to understand and opti mize processes. For instance, particle size and particle size distribution (PSD) measurements are paramount to investi gate the repeatability and the efficiency of various industrial processes and products (11). In medicine, desired properties of the nanoparticles could be drawn by controlling nanoparticle size among other physico chemical characteristics (12–20). Although size and PSD of nanomaterials and nanomedicines have been identified as critical for a given application, it is paramount to be able to measure accurately these parameters having reliable size measurement methods (20). In the indus try also the size characterization of nanomaterials is a critical parameter for the property and safety. A wide choice of methods based on different physical principles is available to measure nanoparticle size and PSD that can be applied on different types of particle. Microscopy is a direct method based on the analysis of images of the nanoparticles. In con trast, all the other methods are indirect. Although they are generally quite accurate to determine size characteristics of homogenously distributed monomodal nanoparticle disper sions (21–26), the determination of the PSD of a dispersion of nanoparticles having distinct populations with different sizes (multimodal) having their own PSD remains extremely challenging (19). The different methods can be classified the way they are evaluating the PSD. This can be achieved direct ly including the dispersion on the whole population, i.e.Bin batch^, or analyzing each nanoparticle individually (single size measurement method) (27). In general, signal produced from the application of physical methods are analysed based on mathematical models to deduce size characteristics of the dis persion. Several methods include a stage of separation en abling a fractionation of the particle as the function of their size prior to the determination of their size (27). The TablesI,
IIand IIIsummarize each method, the measurand and the type of obtained size distribution from the raw data for the different classes of methods i.e. batch, single and using a sep arative particle size measurement method respectively. While commercial apparatus are available to achieve size measure ments with these methods that are based on different modal ities, evaluating PSD of multimodal particles remains chal lenging. In general, it is recommended to investigate PSD of complex samples using different size measurement methods (24,33–40).
Several works have investigated the PSD of multimodal dispersions prepared intentionally by mixing particles of dif ferent size in different known proportions. The most advanced work was proposed by Anderson et al. investigating a multi modal mixture of 220, 330 and 400 nm polystyrene particles using different methods from the three classes of methods defined above: (i) batch particle size measurement method i.e. Dynamic Light Scattering (DLS), (ii) single particle size m e a s u r e m e n t me t h o d i . e . T r a n s m i s s i o n E l e c t r o n Microscopy (TEM), Tunable Resistive Pulse Sensing (TRPS) and Particle Tracking Analysis (PTA) and (iii) separative par ticle size measurement method i.e. Differential Centrifugal Sedimentation (DCS) (33). TRPS and DCS were able to dis criminate the three populations present in the mixed multi modal sample due to sufficient resolution. In contrast, light scattering methods were only able to resolve a single popula tion. PTA resolved the largest population whereas DLS re solved the smallest population in the multimodal mixture. It is noteworthy that each light scattering method was able to re solve and provide accurate mean particle size within 10% of TEM reference value for particles taken independently of each other. Other work proposed by Cascio et al. investigated PSD of a bimodal mixture of 40 and 70 nm monodisperse
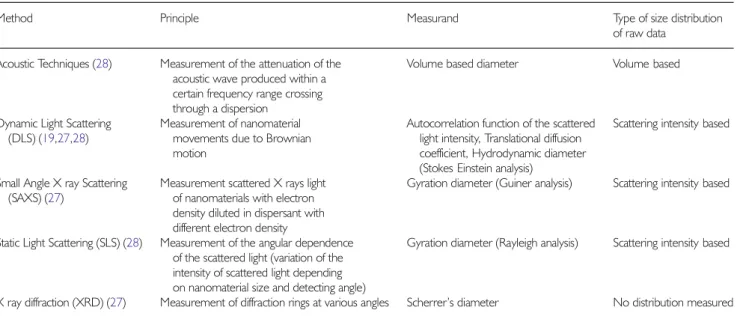
Table I Main Characteristics of Batch Particle Size Measurement Methods
Method Principle Measurand Type of size distribution
of raw data
Acoustic Techniques (28) Measurement of the attenuation of the
acoustic wave produced within a certain frequency range crossing through a dispersion
Volume based diameter Volume based
Dynamic Light Scattering
(DLS) (19,27,28)
Measurement of nanomaterial movements due to Brownian motion
Autocorrelation function of the scattered light intensity, Translational diffusion coefficient, Hydrodynamic diameter (Stokes Einstein analysis)
Scattering intensity based
Small Angle X ray Scattering
(SAXS) (27)
Measurement scattered X rays light of nanomaterials with electron density diluted in dispersant with different electron density
Gyration diameter (Guiner analysis) Scattering intensity based
Static Light Scattering (SLS) (28) Measurement of the angular dependence
of the scattered light (variation of the intensity of scattered light depending on nanomaterial size and detecting angle)
Gyration diameter (Rayleigh analysis) Scattering intensity based
silver nanoparticles using (i) batch particle size measurement method i.e. DLS and separative particle size measurement methods i.e. DCS and Sedimentation Field Flow Fractionation (SdFFF) (37). The separative particle size mea surement methods were able to discriminate the two
populations. However, the resolution was different because in one case, the direction of the separation was orthogonally performed to the elution (SdFFF), and in the other case, the directions of the separation and the displacement were paral lel (DCS). In contrast, the investigated batch particle size
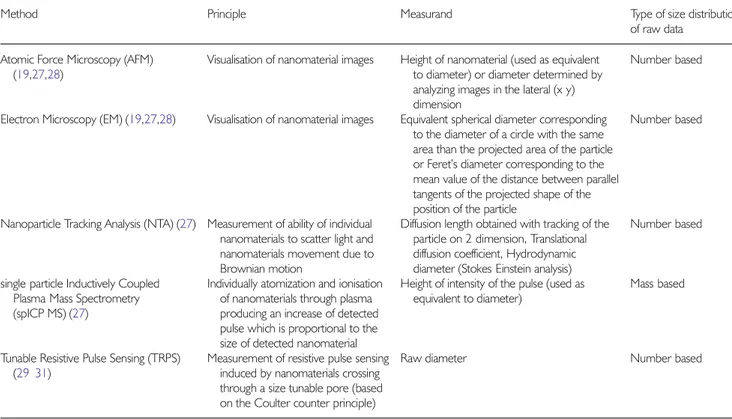
Table II Main Characteristics of Single Particle Size Measurement Methods
Method Principle Measurand Type of size distribution
of raw data Atomic Force Microscopy (AFM)
(19,27,28)
Visualisation of nanomaterial images Height of nanomaterial (used as equivalent
to diameter) or diameter determined by analyzing images in the lateral (x y) dimension
Number based
Electron Microscopy (EM) (19,27,28) Visualisation of nanomaterial images Equivalent spherical diameter corresponding
to the diameter of a circle with the same area than the projected area of the particle or Feret’s diameter corresponding to the mean value of the distance between parallel tangents of the projected shape of the position of the particle
Number based
Nanoparticle Tracking Analysis (NTA) (27) Measurement of ability of individual
nanomaterials to scatter light and nanomaterials movement due to Brownian motion
Diffusion length obtained with tracking of the particle on 2 dimension, Translational diffusion coefficient, Hydrodynamic diameter (Stokes Einstein analysis)
Number based
single particle Inductively Coupled Plasma Mass Spectrometry
(spICP MS) (27)
Individually atomization and ionisation of nanomaterials through plasma producing an increase of detected pulse which is proportional to the size of detected nanomaterial
Height of intensity of the pulse (used as equivalent to diameter)
Mass based
Tunable Resistive Pulse Sensing (TRPS) (29 31)
Measurement of resistive pulse sensing induced by nanomaterials crossing through a size tunable pore (based on the Coulter counter principle)
Raw diameter Number based
Table III Main Characteristics of Separative Particle Size Measurement Methods
Method Principle Measurand Type of size distribution
of raw data
Capillary Electrophoresis (CE) (19,32) Separation achieved by electrophoresis
phenomenon and based on diameter and charge density
Apparent mobility (migration time) Detector dependent
Differential Centrifugal Sedimentation (DCS) known as Centrifugal Liquid
Sedimentation (CLS) (27)
Measurement of sedimentation time. Separation according the sedimentation rate before detection
Light extinction as a function of sedimentation time Sedimentation diameter (Stokes analysis)
Extinction intensity based
Field Flow Fractionation (FFF) (19,27,28,32) Separation achieved through the interaction
of nanomaterials with an external physical field (no stationary phase) and based on elution mode. Flow: hydrodynamic diameter, Sedimentation: equivalent spherical volume diameter, Thermal: diameter and chemical composition, Electrical: diameter and charge density
Retention time Detector dependent
Hydrodynamic Chromatography
(HDC) (27,32)
Separation achieved by flow velocity and the velocity gradient across the particle and based on hydrodynamic diameter
Retention time Detector dependent
Size Exclusion Chromatography
(SEC) (27,32)
Separation achieved through differential partitioning between the mobile and porous stationary phase and based on hydrodynamic diameter
measurement method provided with a monomodal distribu tion with an intermediate value of hydrodynamic diameter between the two real sizes of the nanoparticles included in the model multimodal dispersion but closer to the largest par ticles. These examples underlined the limits of the DLS meth od to resolve nanoparticles having less than a factor of 3 in size difference as described previously in the literature (41). While the previous experiences were all performed with model mul timodal dispersions of known composition and size distribu tion, Sokolova et al. pointed out the difficulty to obtain rele vant PSD measurement from a sample of nanoparticles of the Breal life^ (34). The authors characterized size of exosomes from three different cell types using methods from two classes: batch particle size measurement method i.e. DLS and single particle size measurement method i.e. Scanning Electron Microscopy (SEM) and PTA. They reported that the size of exosomes was not accurately determined using DLS because of the polydispersity of the sample and the likely weak scatter ing contrast provided by the nature of the nano objects. The work of Ingebrigtsen et al. dedicated to the analysis of the PSD of a liposomes preparation as aBreal life^ sample, explored the relevancy of the separative particle size measurement method as Size Exclusion Chromatography before measuring PSD using DLS (39). The reports also proved the usefulness to employ a separative particle size measurement method to re solve the difficult task evaluating the PSD of heterogeneous samples. All size measurement methods may provide biased representation of the true PSD of a given sample (28). A care fully interpretation of their raw data is needed to investigate PSD measurement. Application of the electron microscopy (EM) that is an established direct method based on measure ments done on images of particles and that is recommended as reference method in the standard ISO (42) and by the Health Agencies (18) also shows limitations. It requires an homoge neous and representative deposit of well individualized parti cles on the grids to allow measurements on a minimum of thousand particles to obtain a statistically significant PSD (43). The stringent quality of deposition of particles on the grid needed to perform relevant size and PSD measurement by TEM could not be fulfill considering a sample of poly(isobutylcyanoacrylate) nanoparticles (PIBCA nanoparti cles) decorated with dextran having a multimodal distribution (44). A segregation between large and small particles occurred systematically during deposit on grids for TEM as shown in Fig.1. Also reported elsewhere (43), this hampers the estab lishment of unbiased PSD analyzing images obtained by EM. With this sample even the most straightforward method is unsuitable to achieve accurate evaluation of the PSD of the multimodal dispersion. Consequently, the evaluation of PSD of this sample appeared as a complex task. Thus, the aim of the present work was to achieve a comparative analysis using 9 different commercially available methods and to provide with a comprehensive critical evaluation of the results provided by
the methods that were taken from the different classes defined above. It was aimed to established advises based on experi mental facts to resolve the difficult task of size and PSD eval uation of unknown dispersions based on the analysis of a real sample of polymer nanoparticles obtained from a synthesis based on emulsion polymerization and developed as nanomedecine.
PRINCIPLE OF INVESTIGATED METHODS
FOR PARTICLE SIZE DETERMINATION
Single Particle Size Measurement Methods Direct Methods
Electron Microscopy. Electron Microscopy (EM) is a direct method described in the standards ISO (42) and recognized by Health Agencies to perform size and PSD measurement
Fig. 1 Electron micrographs obtained from the analysis of the dispersion. (a) and (b): scanning electron microscopy performed on lyophilizates obtained from two independent preparation of the dispersions. (c, d, e and f): Transmission electron micrographs obtained after negative staining of sample deposited on an ionized grid (c) and a non ionized grid (d, e, f). Scale bar: 200 nm.
(18). EM measures equivalent spherical diameter or Feret’s
diameter of nanometer sized nanoparticles by imaging sam ples based on the diffraction of electron beam passing through thin section of samples. EM is a counting method taking ac count of polydispersity of samples by producing a size value for each nanoparticle selected on images for analysis. Therefore, size distribution by number is mounted. It is note worthy that capturing images implying both larger and small er nanoparticles with unbiased and establishment of a repre sentative distribution is difficult. Many hundreds or thousands particles depending on the broadness of the PSD should be measured to provide a statistically significant particle size dis tributions as suggested by the standard ISO (43). To increase number of screened nanoparticles, automated analysis soft ware can be used. It requires to define measurements param eters that may induce bias in particle size distributions (45,46). Atomic Force Miscroscopy. Atomic Force Microscopy (AFM) belongs to the family of scanning probe microscopes. AFM is recognized by Health Agencies to perform size and PSD mea surement (18). Since its invention in 1986 by Binnig et al. (47), AFM has been widely used in nanomaterials science where microstructure or nanostructure needs to be determined. A standard AFM is composed of a flexible cantilever with a sharp tip (typically tip radius around 10 nm) at its end and a piezoelectric scanner which can move the probe very precisely in x, y and z axes and thus controls the interaction between the tip and sample. The deflection of the cantilever normal to the sample surface is monitored by means of a laser reflection on the back side of the cantilever based on the optical lever meth od proposed by G Meyer et al. (48). The small changes in cantilever deflection are thus detected with a position sensitive photodiode detector. This deflection is then processed by the system electronics by a feedback mechanism in order to main tain the same tip sample distance and thus to determine topo logical changes on the sample surface. The resolution of AFM in Z direction is very high in the sub Angstrom range; how ever lateral resolution is limited by the tip radius which is usually in the order of 10 nm. AFM is a counting method taking account of samples polydispersity by producing a size value for each nanoparticle selected on images for analysis. Therefore, size distribution by number is mounted. As for EM, capturing images implying both larger and smaller nano particles with unbiased and representative distribution is diffi cult. A large number of well separated particles are needed to provide a statistically significant particle size distribution. Automated image processing software may be used. But, it requires some assumptions about the nanoparticle shape to increase number of screened nanoparticles over time (49). Size information may be provided by means of two different approaches. The most commonly used approach consists in considering the height of the spherical nanoparticles as diam eter. Such approach may be applied to determine the size of
well separated nanoparticles. However, precautions should be taken into account when analyzing AFM images with this ap proach due to the elastic deformation in Z direction of the imaged features when applying high forces and to the inter action of nanoparticles with the underlying substrate which may induce changes in the polymeric nanoparticle shape. The other approach consists in analyzing AFM images in the lateral dimension (x y). However, it should be noted that the quality of AFM images highly depends on the (i) sample preparation method to get well separated features, (ii) the smoothness of the underlying substrate, (iii) the applied force and (iv) the shape and the radius of the tip. Indeed, the shape of the tip may affect the accuracy of the lateral information for very small nanoparticles.
Indirect Methods
Nanoparticle Tracking Analysis. Nanoparticle Tracking Analysis (NTA) utilizes the properties of both light scattering and direct evaluation of the Brownian motion of particle in order to analyze particle size distributions of samples in liquid disper sion. A laser beam is passed through a prism edged glass flat within the sample chamber containing the nanoparticle dis persion. Once in contact with the laser, the nano objects scat ter light. This signal is then collected via a microscope pathway mounted with a camera working in the black field mode. The camera records the movement of the particles under the Brownian motion. The NTA software simultaneously tracks particles as they move in the plane of focus and calculates the mean square displacement (in two dimensions) of each particle to obtain its translational diffusion coefficient. The translation al diffusion coefficient is converted into a size via the Stokes Einstein Equation while temperature and viscosity of the dis persing medium are known. Since the method is particle by particle and not a batch method, the size distribution profiles display a higher peak to peak resolution. In addition, this microscope based technology allows the rapid measurement of the number of particle based concentration of the sample. The tracking method should resolve individual population present in multimodal samples due to the ability to individu ally follow particles reducing the influence of the scattered light intensity of larger particles hence bias of the measured PSD (50).
Tunable Resistive Pulse Sensing. Tunable Resistive Pulse Sensing (TRPS) is a method based on a size tunable pore, to measure particle size, charge and concentration by resistive pulse sensing. One of the first reported works on the technol ogy, as described by Sowerby et al. (29), shows that it is possible to make a resizable aperture by penetrating an elastomeric membrane with a coned shaped needle probe. Based on the Coulter counter principle, the method involves measuring the increased electrical resistance induced by the passage of nano
and micro particles through the pore, immersed in a conduc tive liquid. The larger the volume of the particle is, the higher the displaced volume of electrolyte and hence resistance, will be. The rate of particle translocation is a function of concen tration and electrophoretic mobility, being the main driving force of particles in aqueous solution as they pass through the pore, which also gives precise concentration and charge mea surements on each counted particle, respectively, as an electric field is applied across electrodes (30).
This method requires a calibration with carboxylated poly styrene particles of known size, concentration and charge, based on the linear relationship between the variation of re sistance and particle volume. Hence a single point of calibra tion is needed to provide an accurate size measurement, if thereafter measurement conditions remain constant (31). Batch Particle Size Measurement Methods
Dynamic Light Scattering
Dynamic Light Scattering (DLS) or Photon Correlation Spectroscopy (PCS) is described in the standard ISO 22412:2008(E) (51) and recognized by Health Agencies to per form size and PSD measurement (18). It enables the evaluation of hydrodynamic diameter of particles dispersed in liquid by the measurement of translational diffusion coefficient characteriz ing the Brownian motion. The hydrodynamic diameter is then calculated using to the Stokes Einstein equation. In a usual DLS setup, a laser light illuminates the sample which scatters light in all direction with fluctuations due to the displacement of the nanoparticles depending on the time. The analysis over the time of these fluctuations leads to an autocorrelation function, fitted with an exponential behavior. Parameters of the decrease of the exponential decay rate are related to the diffusion of the particles in the dispersion medium. Two popular algorithms are usually used: Cumulants and Contin. Cumulants, described in the standard ISO (51) is suited for sample com posed of particles homogeneous in size with a low standard deviation value. This means that the autocorrelation function is fitted with a single exponential assuming that the sample is monodisperse. Contin, based on the Non Negative Least Squares (NNLS) method, is applied for multimodal samples but limited by the characteristics of the sample (range, mono/ polydispersity). Usual DLS instruments are designed to perform measurements at a fixed detection angle (90 or 173° with re spect to the laser illumination axis) or on a wide range of angles depending on the settings. Varying the detection angle is inter esting for the analysis of heterogeneous samples as small and large particles scattered light proportionally to the power six of their radius. The intensity of the scattered light contribution of large and small particles depends on the angle of measurement allowing to privilege detection of different size according to the angle of measurement. DLS is suitable for light being
scattered once. Multiple scattered light can lead to bias results and misinterpretations. To overcome this technical limitation, novel instruments based on dynamic light scattering followed by cross correlation of photons (Photon Cross Correlation Spectroscopy, PCCS) have been developed. Measurements can be achieved on concentrated samples as multiple scattering effects are considerably reduced in accordance with recommen dation of the standard ISO (51). In practice, two laser beams illuminate the same scattering volume and intensity fluctuations are recorded by two independent detectors. Multiple scattered lights are discarded by cross of the two separated autocorrela tion functions obtained by each detector.
Static Light Scattering
Static Light Scattering (SLS) also called Laser Diffraction (LD) enables to evaluate the radius of gyration of nanoparticles dispersed in liquid by measuring the angular dependence of the intensity of scattered light. Larger particles scatter much light at small angles whereas smaller particles scatter light at greater angles. In a usual SLS setup, a laser light illuminates the sample which scatters light at one or many angles. The evolution of the scattered intensity as a function of detected angles depends on particle size. The analysis of the optical signal leads to the deconvolution of scattering pattern into a series of individual number (one per size classification). The relative amplitude of individual number corresponds to the relative volume of equivalent spherical particles of that size. This deconvolution may be performed by means of either the Fraunhofer or Mie theories of light scattering.
Separative Particle Size Measurement Methods: Asymmetrical Flow Field-Flow Fractionation Coupled With Dynamic Light Scattering
Field Flow Fractionation is another method recommended by Health Agencies to perform size and PSD measurement (18). Asymmetrical Flow Field Flow Fractionation (AsFlFFF) is a liquid phase separation method that enables to fractionate nanoparticles based on their hydrodynamic size and appears as a powerful tool for obtaining high resolution information on the size distribution of a nanoparticle dispersion (52,53). Briefly, AsFlFFF is performed in stationary phase free channel in which the sample i.e. a dispersion of nanoparticles is carried though a narrow channel in a laminar parabolic flow profile with eluent. A perpendicular flow field is applied to this carrier flow that drives nanoparticles to the accumulation wall of the channel where they accumulate and move slower. The sepa ration of nanoparticles is then achieved according to their translational diffusion coefficient. Due to Brownian motion, the smaller nanoparticles having higher translational diffusion coefficient tend to reach an equilibrium position (diffusion against the applied field) at a larger distance from the
accumulation wall where they move faster. Thus, the gradient of velocity that establishes in the channel enables the separa tion of nanoparticles with different sizes. In the normal mode, the smaller particles move faster in the channel than the larger particles hence they are eluted before the latter ones. Combining the Stokes Einstein Equation and the relationship between the translational diffusion coefficient and the reten tion time, the hydrodynamic diameter may be evaluated. Different detectors may be coupled to AsFlFFF for unambig uous identification and quantification of nanoparticles.
MATERIALS AND METHODS
Materials
Deionized and ultrapure water (MilliQ®) were obtained from Millipore water system.
P I B C A n a n o p a r t i c l e s w e r e p r e p a r e d w i t h isobutylcyanoacrylate (IBCA) from Orapi, Dextran (66.7 kDa) from Sigma, Cerium (IV) ammonium nitrate and nitric acid (purity between 61.5 and 65.5%) from Prolabo. Preparation of Poly(Isobutylcyanoacrylate)
Nanoparticles Decorated with Dextran
Synthesis of PIBCA nanoparticles decorated with dextran was performed according to Vauthier et al. by redox radical emul sion polymerization (44). Briefly, dextran (0.0502 g) was dis solved in 9.3 mL of aqueous 0.2 N nitric acid in a glass tube at 40°C under argon bubbling. Vigorous stirring was applied to create a vortex. After 10 min, 0.7 mL of cerium (IV) ammo nium nitrate 8.10 2M in aqueous nitric acid 0.2 N was added followed immediately by 0.5 mL of IBCA. The reaction was left to continue for 1 h. After cooling down in an ice bath, milky dispersion of PIBCA nanoparticles was purified by di alysis (Spectra/Por® membrane Biotech, molecular weight cutoff of 100,000 Da, Spectrum Laboratories) twice against 1 L of deionized water for 30 min, once for 6 h and the last overnight. The purified dispersions were stored at 4°C before using. The concentration in nanoparticle of the dispersion was 51.1 ± 1.2 mg.mL 1as determined by gravimetry.
Evaluation of the Size Characterization Single Particle Size Measurement Methods Direct methods.
Electron Microscopy
For SEM, a sample of the nanoparticle dispersion was freeze dried and deposited on a sample holder for SEM with
a double faced tape. The sample was then coated with a layer of 2 nm of Pt/Pd using a Cressington Sputter Coater 208HR instrument (Cressington). Observations were performed using a scanning electron microscope MEB LEO 1530 (LEICA) equipped with a Gemini type column at the CNRS CECM (Vitry sur Seine, France).
For TEM, nanoparticles were deposited on a formvar/ carbon coated cupper grid (Agar Scientific) either by flotation for 3 min on dilution of the dispersion adjusted at a concen tration in nanoparticles of 0.5 mg.mL 1or by direct deposi tion of 3μL of the diluted dispersion on the grid. Both ionized and non ionized grids were used. After drying of the sample, grids were stained by flotation over a solution of phosphotung state at 1% for 30 s. The nanoparticles were imaged using a JEOL JEM1400 electron microscope equipped with a camera ORIUS SCI1000 1.
Atomic Force Miscroscopy
The AFM imaging of PIBCA nanoparticles was performed in ambient conditions using a JPK Nanowizard® 3 Ultraspeed AFM from JPK instruments in amplitude modulation AFM (AM AFM) with low force settings (80–90% of the free ampli tude). In AM AFM modulation, the tip surface distance reg ulation is performed to maintain constant the amplitude to a precised setpoint. Gold coated silicon cantilevers PPP NCHAuD with a spring constant of ~ 42 N.m 1and a tip curvature radius of ~10 nm (Nanosensors) have been used. Nanoparticle samples were diluted at a concentration of 0.1 mg.mL 1of nanoparticles with filtered ultrapure water, and 100μl of this solution was deposited on freshly cleaved mica substrates and kept to dry overnight at 22°C and ambient humidity. AFM images were processed and analyzed to eval uate PSD of nanoparticles including 393 counted nanoparti cles using JPK Data processing software (JPK instruments). To reduce the convolution effect on the lateral size of imaged nanoparticles, the widths were measured manually at the full width at half maximum (FWHM) of the peak height using the line profile measurement option.
Indirect methods.
Nanoparticle Tracking Analysis
Evaluation of the size characterization of the PIBCA nano particle dispersion was performed by NTA using a Nanosight NS300HSB device (Malvern Instruments) equipped with a sCMOS camera, a 405 nm laser and a syringe pump. The software version used for capturing and analyzing the data was the NTA 3.0.
Six measurements of the same sample of PIBCA nanopar ticles were performed. Measurements were performed under a regular flow (using the NanoSight Syringe Pump addon)
which allows the tracking of new particles all along the anal ysis. The sample of PIBCA nanoparticles was diluted in fil tered ultrapure water using a 0.22μm filter (Roth) with a 106 factor (v/v) (51.1 ng.mL 1).
Tunable Resistive Pulse Sensing
All measurements were made using an Izon qNano (NZ). Polystyrene calibration particles with a concentration of 1.2 × 10¹³particles.mL 1and mode size of 115 nm were pur chased from Thermo Fischer Laboratories. Sample particle diameters were calculated using a calibration process (47). Mode diameter of the calibration particles stands for the po sition of the maximum of the size distribution. All samples were dispersed in phosphate buffered saline containing 0.03% of Tween 20 (IZON solution Q) for analysis at a dilu tion factor of 1/103(v/v) (51.1μg.mL 1). Particle concentra tion and size were calculated using Izon Control Suite Software v 3.2 on a minimum of 500 particle events. Batch Particle Size Measurement Methods
Dynamic Light Scattering. Up to 4 different DLS were used to evaluate PSD of the PIBCA nanoparticle dispersion: single angle DLS working at 90 or 173°, multiangle DLS and PCCS.
Single Angle DLS
The hydrodynamic diameter of PIBCA nanoparticles, Dh, was measured at 25°C by DLS using two different Zetasizer Nano ZS from Malvern. The first one was a Zetasizer Nano ZS operating at fixed scattered angle at 173° using Zetasizer Software version 7.04. The second one was a Zetasizer Nano ZS 90 operating at fixed scattered angle at 90° using Zetasizer Software version 6.11. Both instruments were equipped with a laser source of wavelength of 633 nm. The sample of PIBCA nanoparticles was diluted in filtered ultrapure water using a 0.22μm filter (Roth) by 1/200 (v/v) (0.256 mg.mL 1) at room temperature. Measurements were performed in macrocuvette with four optical faces (VWR) controlled for spotting surface scratches or coatings that could interfere with optical measure ments, rinsed three times with filtered ultrapure water and stored in a dust free environment until use. Appropriate vol ume of samples (1 mL) was introduced into measurement cells and placed in the instrument for equilibration time of 300 s to ensure temperature homogeneity prior to making 3 measurements.
Multiangle DLS
Size measurements of PIBCA nanoparticles were per formed at 25°C by multi angle DLS using a NanoDS (Cilas)
using NanoExpert version 10.36 with detection from 10 to 150° equipped with a laser source of wavelength of 638 nm. For measurements, the sample of PIBCA nanoparticles was diluted in filtered ultrapure water using a 0.2 μm filter (Whatman) by 1/3000 (v/v) (17.0μg.mL 1) at room temper ature. The obtained diluted dispersion (3 mL) was prepared in a standard quartz cell and placed in the instrument for an equilibration time of 120 s prior to the measurements.
Photon Cross Correlation Spectroscopy
Evaluation of the size characterization PIBCA nanoparti cle dispersion was performed by photon cross correlation spectroscopy using a Nanophox (Sympatec) using Windox software version 5.8.7.0 at 25°C. The instrument was equipped with a laser source working at a wavelength of 658 nm and the detection was achieved at the fixed scattered angle at 90°. The sample was placed in macrocuvette with four optical faces (Sarstedt) inspected for any default, rinsed three times with filtered ultrapure water and stored in a dust free environment before use. Appropriate diluted sample of PIBCA nanoparticles in filtered ultrapure water by 1/20 (v/v) (2.56 μg.mL 1) at room temperature was introduced into measurement cells (volume of 1 mL) and placed in the instru ment for an equilibration time of 30 s. Five measurements were carried out on the sample.
Static Light Scattering. Size measurements of the PIBCA nano particle dispersion were performed at 25°C by SLS using a LS 13 320 apparatus (Beckman Coulter) and LS 13 320 software v 6.01 at different scattering angles (0.03 to 35°) to determine the diameter of gyration, Dg. The instrument was equipped with Polarization Intensity Differential Scattering (PIDS) to measure differences between horizontally and vertically radi ated light for several wavelengths (450, 600, and 900 nm), which were horizontally and vertically polarized at multiple angles. The instrument was equipped with a laser source of wavelength of 780 nm and measurements were performed in Universal Liquid module of 125 mL. Appropriate diluted sample of PIBCA nanoparticles in filtered ultrapure water (3 drops of the dispersion were added to 125 mL of filtered ultrapure water, dilution ~ 1/83, 61.3 μg.mL 1) was intro duced into Universal Liquid module at room temperature. This module was then placed in the apparatus. Three mea surements were carried out on the sample.
Separative Particle Size Measurement Methods: Asymmetrical Flow Field-Flow Fractionation Coupled With Dynamic Light Scattering
The Asymmetrical Flow Field Flow Fractionation (AsFlFFF) were performed on an Eclipse 2 System (Wyatt Technology Europe). The AsFlFFF channel was installed with a 350μm
spacer and a regenerated cellulose membrane with a 10 kDa cutoff (Wyatt Technology). The carrier flow was delivered by an Agilent 1100 Series Isocratic Pump (Agilent Technologies) with an in line vacuum degasser. The carrier liquid composed of deionized water containing 0.02% sodium azide (Sigma Aldrich) was filtered using vacuum filtration system (Gelman filters of 0.1μm). Samples of PIBCA nanoparticles were di luted at 1/100 with carrier liquid and mixed using a vortex (Scientific Industries) at 2500 rpm for 10 s prior injection into the channel. During focusing, the cross flow was fixed at 1.5 mL.min 1for 2 min. The sample (20μL) was then injected into the channel using an Agilent Autosampler at 0.2 mL.min 1for 5 min. After injection, 2 min of focus was applied before starting the elution. PIBCA nanoparticles were eluted using cross flow rate fixed at 0.3 mL.min 1, a channel flow fixed at 1.0 mL.min 1for 45 min and monitored by a 18 angles multi angle light scattering (MALS) instrument DAWN HELEOS II (Wyatt Technology) equipped with a Laser source at 633 nm and a Qels (DLS) at 99°, an Optilab Rex Refractometer (Wyatt Technology) and a UV detector Agilent 1100 operating at 254 nm. Measurements were per formed at room temperature. The software version installed on AsFlFFF chain was the Astra v 5.3.4.20.
RESULTS
Size characterization of a nanoparticle dispersion that ap peared quite heterogeneous by EM was evaluated using dif ferent instruments working on different principles. Most of them are methods recommended by the standard ISO (42,51) and by the Health Agencies (18). The results are given below, method by method, considering whether they are sin gle particle measurement methods, batch particle measure ment methods or measurement methods applied after a sep aration of particles of the dispersion according to their size with an appropriate method. All results described the nano particle size expressed in diameter calculated from the measurand of the corresponding method using models ex plained in the Materials and Methods when required. Single Particle Size Measurement Methods Direct Methods
EM can be used to determine size characteristics of nanomaterials based on the measurement of the size of each nanoparticle contained in the dispersion and seen on samples observed by EM. It is considered as a direct size particle mea surement method. To achieve these determination, deposition of the nanoparticles on the sample holder should fulfill some requirements. Particles should be well dispersed on the holder and randomly distributed. Figure 1 showed electron
micrographs of nanoparticles contained in the dispersion stud ied in the present work. Observed freeze dried samples by SEM obtained from two independent preparations of the dis persion revealed the presence of at least two populations of nanoparticles. Size measurement was not performed because of the high density of the deposit of particles on the sample holder found on the electron micrographs. The presence of large and small particles was confirmed from TEM observa tions on samples deposited by different methods on either ionized or non ionized grids. Areas on grids showed well iso lated nanoparticles as required by the standard ISO to per form measurements of nanoparticle size and to access the size distribution of the dispersion (28) (Fig.1eandf). However, by investigating sample for TEM observation on a systematic manner, it clearly appeared that a segregation between large and small particles occurred during the preparation of the grids compromising an objective determination of the size distribution. Although present in a lower number, larger nanoparticles were almost not found on areas included isolat ed particles. They were almost exclusively seen in clusters (Fig. 1d) while the majority of the isolated particles corresponded to the smallest nanoparticles (Fig. 1e andf). The larger particles appeared in the center of clusters while small particles accumulated at the periphery of large particles with the smallest nanoparticles located at the external border (Fig. 1d). These systematically observed arrangements may results of an artifact that occurred during the drying of sam ples on grids whatever was the method of deposition. As the deposition of the nanoparticles on the grid could not be ran dom, it compromised the evaluation of the size characteristics of the dispersion which appeared highly heterogeneous on a qualitative basis. From EM observations of the sample, it could be concluded that the dispersion contained various pop ulations of nanoparticles that differed in their size.
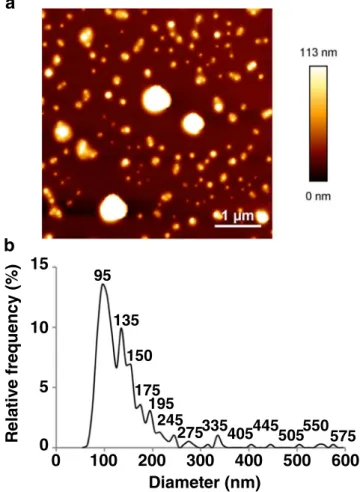
PSD of PIBCA nanoparticles contained in the sample was investigated using AFM. AFM images showed well dispersed particles on the holder that allowed to determine the number based size distribution of in the dispersion (Fig.2). In contrast with EM, apparently no segregation between large and small particles occurred during deposition of the dispersion and ac ceptable density of particles was found on images enabling an accurate determination of the size distribution. The PSD highlighted several populations of nanoparticles with a major population in number having a diameter of 95.0 nm and an asymmetric Gaussian showing several secondary peaks at 135, 150, 175 and 195 nm. Minor separated populations appeared at 245, 275 and 335 nm. A few large particles were present in the multimodal dispersion around 400–600 nm. No particles with size lower than 60 nm was highlighted, indicating thus that the radius of the AFM tipis sufficiently small to resolve such features. The dispersion contained various populations of nanoparticles with different size consistently with the quite complex polydis persity of the dispersion revealed by TEM on a qualitative basis.
Indirect Methods
The PSD of PIBCA nanoparticles was recorded using NTA. The Fig.3ashowed the corresponding number based distri bution of nanoparticles contained in the dispersion. The PSD highlighted one population of nanoparticles around 67.0 nm with an asymmetric Gaussian with several secondary peaks at 97.0, 143 and 217 nm. A few large particles were present in the multimodal dispersion in the range 355 to 500 nm.
The PSD of PIBCA nanoparticles was investigated using TRPS. The Fig.3bshowed the corresponding number based distribution of nanoparticles contained in the dispersion. The PSD highlighted one population of nanoparticles around 109 with an asymmetric Gaussian with several secondary peaks at 122, 135 and 188 nm. A few large particles were present in the multimodal dispersion around 300 nm. The diameter of 10% (D10) and 90% (D90) of the population of the multimodal dispersion was less than 97 and 190 nm respectively. The ratio D90/D10 was equal to 2 showing the polydispersity of the dispersion.
For both methods, the PSD of PIBCA nanoparticles was consistent with the PSD provided by AFM.
Batch Particle Size Measurement Methods
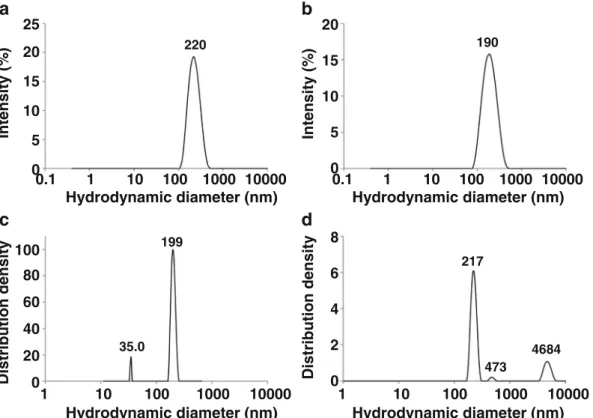
PSD of PIBCA nanoparticles was investigated using different DLS. The Fig.4aandbshowed the intensity based distribu tion of nanoparticles contained in the dispersion obtained from DLS working at fixed angle of 90 and 173° respectively. The PSD provided by the DLS method working at fixed angle showed only one population of nanoparticles with narrow dispersity suggesting a monomodal PSD. Mean Dhdetermined from the two appartus were 220 and 190 nm. for the angle of measurement of 90 and 173° respectively. The results were con sistent with known performances of the measurement method. At the low angle, the smallest particles were predominantly de tected. The contrary was observed with the detection at 90°. The Fig.4cshowed the intensity based distribution of nanoparticles contained in the dispersion obtained from DLS multi angle. The optimum angle was found at 120° to perform size measurement that would to be closed to the iso intensity between the different populations and thus show smaller populations. Two popula tions that differed in their size (35.0 and 199 nm) were observed on the PSD. It is noteworthy that the peak of the lower
b
a
0
100
200
300
400
500
600
0
5
10
15
Diameter (nm)
R
e
la
tiv
e fr
equency (%)
95 135 150 175 195 245 275335405445505550575Fig. 2 AFM image (a) and number based size distribution (b) obtained from the analysis of the dispersion. Size distribution obtained from the measure ment of 393 nanoparticles.
b
a
0 100 200 300 400 500 600 Raw diameter (nm) Concen tr a tio n (10 12 NP s.mL -1) 0 100 200 300 400 500 600 Hydrodynamic diameter (nm) 0 4 8 12 160
1
2
3
4
5
6
Concen tr a tio n (10 14 NP s.mL -1) 67.0 97.0 143 217 355 501 109 122 135 188 221 248 281 300 333Fig. 3 Number based size distribution obtained from the analysis of the dispersion for NTA (a) and TRPS (b).
population was not repeatable that of the larger population ap peared at a size that was consistent to that revealed by the two previous DLS methods working at fixed angle. The Fig.4d
showed the intensity based distribution of nanoparticles contained in the dispersion obtained from PCCS. Three popu lations that differed in their size (217, 473 and 4684 nm) were detected on the PSD. This instrument revealed populations of larger size while the population at 217 nm could correspond to that also detected with other DLS apparatus. Results obtained by light scattering methods in batch were provided with very simple PSD compared with those that could deduced from AFM and other single particle size measurements methods.
PSD of PIBCA nanoparticles was recorded using SLS. The Fig.5showed the corresponding volume based distribution of nanoparticles contained in the dispersion. The PSD showed in terestingly three well separated populations of nanoparticles characterized by Gaussian at 63.8, 195 and 496 nm. SLS re vealed a quite complex PSD characteristics of the PIBCA nano particles although it appeared more simple than that depicted by AFM and the other single particle size measurement methods. Separative Particle Size Measurement Methods: Asymmetrical Flow Field-Flow Fractionation Coupled With Dynamic Light Scattering
Separative particle size measurement methods may provide with a more resolute PSD while analysing unknown
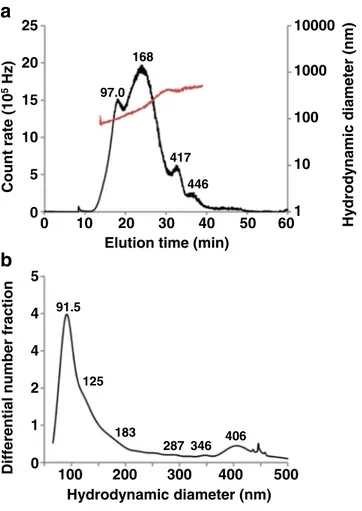
dispersions of nanoparticles. PIBCA nanoparticle dispersion was then analysed by AsFlFFF coupled with a DLS detector. The Fig. 6a showed the obtained fractogram. The elution profile of PIBCA nanoparticles recorded by DLS detector showed a broad PSD with 4 peaks having maxima at elution time of 18.0, 23.9, 32.4 and 36.2 min. These peaks indicated the presence of particles of significantly different size as shown by their measured hydrodynamic diameter (97.0, 168, 417 and 446 nm). The multimodal dispersion was well identified by the AsFlFFF. The number based size distribution (Fig.6b)
190 0.1 1 10 100 1000 10000 217 473 4684 1 10 100 1000 10000 35.0 199 1 10 100 1000 10000 0.1 1 10 100 1000 10000 220 Hydrodynamic diameter (nm) Distribution density Intensity (% ) Distribution density Intensity (% )
a
b
c
d
Hydrodynamic diameter (nm) Hydrodynamic diameter (nm) Hydrodynamic diameter (nm) 0 5 10 15 20 25 0 20 40 60 80 100 0 5 10 15 20 0 2 4 6 8Fig. 4 Intensity based size distribution obtained from the analysis of the dispersion for (a) DLS 90° (NNLS), (b) DLS 173° (NNLS), (c) Multi angle DLS, optimal angle: 120° (Contin) and (d) PCCS (NNLS).
63.8 195 496
1
10
100
1000
10000
V
olume (%
)
Gyration diameter (nm)
0
5
10
15
Fig. 5 Volume based distribution obtained from the analysis of the dispersion for SLS (Mie theory).
deduced from the analysis was consistent with images of mi croscopy and PSD provided by AFM and single particle size measurement method.
DISCUSSION
A dispersion of PIBCA nanoparticles prepared by emulsion polymerization appeared quite heterogeneous from observa tions by electron microscopy. The size characteristic of the dispersion was first evaluated by DLS which is a widely used method in laboratories due to its apparent ease of use, the short duration of the measurements and the availability of accessible marketed apparatus. The dispersion was character ized by DLS working at two detection angles, 90 (DLS 90°) and 173° (DLS 173°). Both have provided with a single pop ulation of particles with mean hydrodynamic diameters at 220 and 190 nm respectively. Results provided by the DLS instruments were not satisfied as it seemed that they did not reflect the heterogeneity of the dispersion shown on electron micrographs. Although not satisfying, they agreed with the known fact that determination of size characteristics of
complex dispersions by DLS is problematic (33,34,38) while the method is powerful to evaluate size characteristics of monomodal dispersions with a high accuracy (21). The limi tation comes from the fact that the intensity of scattered light depends on particle size being proportional to the power six of the particle diameter. Thus, intensity of scattered light due to large particles can hinder the detection of populations of par ticles having a smaller diameter. Due to a segregation that occurred during preparation of the samples for observation by EM, PSD of the PIBCA nanoparticle dispersion could also not be determined by this direct method of measurement. Size characteristics of this dispersion was then studied by different methods including a series of light scattering methods that can be classified as batch methods, a series of methods that are based on the determination of the size characteristics of single particles and a method that include a separation process as the function of the nanoparticle size prior to achieve size measure ments by a light scattering method that gives accurate results on homogeneously dispersed monomodal dispersion.
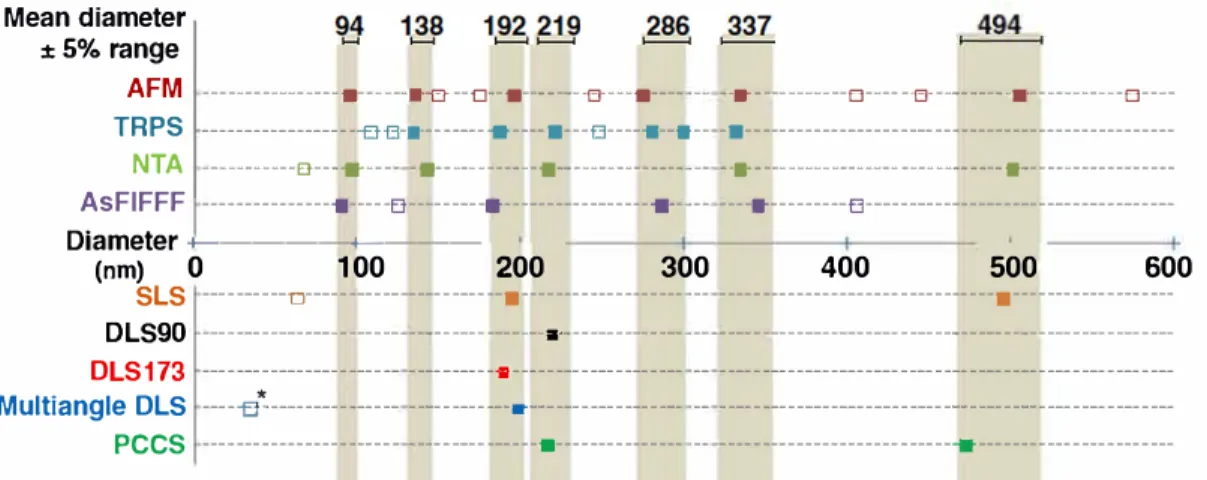
The Fig. 7 summarizes the position of peaks on a scale reporting the diameter of the corresponding nanoparticle populations given from the analysis of the PSD of the disper sion of PIBCA nanoparticles by the different particle size mea surement methods considered in the present work.
Results obtained from single particle size analysis, i.e. AFM, TRPS, NTA, and based on a separative method, i.e. AsFlFFF, were plotted on the upper part of the graph while those produced by batch methods based on light scattering were plotted on the lower part of the graph. Methods consid ered in the upper part of the graph revealed the presence of several populations of nanoparticles of different diameters suggesting that the dispersion had a quite complex PSD. Graphs of size distributions obtained from all these methods showed a very similar shape of the size distribution curves consistently with what was expected from qualitative observa tions made by electron microcopy. Each method was based on a different principle and provided with slightly different ways to express the nanoparticle diameters. Despite these differ ences, several populations of size were detected by at least 3 methods of analysis giving a mean diameter within a ± 5% range as underlined by the grey backgrounds shown on the graph at certain size positions (Fig. 7). It is noteworthy that results provided by these methods were rather consistent be tween them and with those of the AFM that is considered as a direct method of the evaluation of the size characteristics of dispersion. The consistency obtained between these methods supports that the deposit of the nanoparticle sample on the mica plate holder was random and representative to the size distribution characteristics of the dispersion. Despite slightly different results, all these methods have revealed that the dis persion was composed of several populations of nanoparticles that differed from their size making the PSD quite complex. Their consistency with AFM that is a direct method suggested 100
a
Hydrodynamic diameter (nm) 0 200 300 400 500 1 2 4 4 5 0 5 10 15 20 25 10 20 30 40 50 60 0 Hy drody namic diameter (nm) Count rate (10 5Hz) Differential number fractionb
1 10 100 1000 10000Elution time (min)
91.5 125 183 287 346 406 446 417 168 97.0
Fig. 6 AsFlFFF fractogram of PIBCA nanoparticles recorded by DLS detector working at 99° (a) intensity based size distribution and (b) number based size distribution (Unit of differential number fraction: 1/log(nm)).
Mean diameter
: 5% range
AFM TRPS
NTA
---■---a--EJ---e--■---e----■---- -- --. ---e---e---a---e --- --f} G-a-----e ----■---G--------■-- -■--- ___ ---e----e--- -■---•--- -- ---■--- ---As FI FFF ---•---e---•---e-- -- ----•---e ---Diameter +---+----(nm) SLS 0 ---□--- ---■--- -- ---■---100 200 300 400 500 600 DLS90 ---•--- OLS 173 ---a--- -- --- ---Multiangle OLS ---e"'--- ---.--- -- --- PCCS --- ---■--- -- ---
---Fig. 7 Summary oftœ obtained PSDfrum the dispersion of PIBCA nanoparticles analyzed by differentsize measurement methods. Resuts frum measurements
performed with single size measurement methods (AFM, TRPS, NTA) and methcxls ba.sed on a separative proces.s (AsFIFFF) are shc:Mtn on the upper part of the graph. Results !rom measurements performed with batch size measurement metrods comprising different light scattering methods (SL.S, OLS, PCCS) are
summarized on tœ loNer part oftœ graph. * indicates a significant variation d the size position d tœ corresponding detected population. Mean diameters were
cala..rlated frum the diameters of the population of nanopartides with the comesponding size that was detected in a ± 5% range ( shown by the grey backgruu,d)
by at least 3 different methcxls.
that they provided with a qui te representative view of the PSD of the analyzed dispersion. This is interesting because AFM is a very demanding method while the rime required to perform one analysis by the other methods is much shorter. Indeed, rimes required to perform an analysis by NT A, TRPS and AsFlFFF are 18, 2 and 60 min respectively.
Methods of analysis used to provide with the results sum marized on the lower part of the graph suggested that the PSD of the nanoparticle dispersion was composed of 1, 2 or a maximum of 3 populations of nanoparticles. Light scattering methods that formed this group of methods were ail able to detect one population of nanoparticles with a diameter around 200 nm. lt seemed that this population of particle was also detected by the other methods with peak positions slightly below, 192 nm, or slightly above, 219 nm The three OLS methods only revealed this population of nanoparticles. In contrast, the SLS and the PCCS methods have detected a second population of nanoparticles with a diameter around 494 nm that corresponded to a population also detected by 2 methods of the other group, AFM and NTA Nevertheless, PSD depicted by the five light scattering methods used to characterize the dispersion of PIBCA nanoparticles was rather simple cornpared with PSD revealed by methods based on single particle size measurement methods, i.e. AFM, NTA, TRPS, and a separation process, i.e. AsFlFFF. Thus, the dif ferent light scattering methods tested in this work have failed to provide with a representative view of the complex PSD revealed by the analysis performed with methods based on totally different principles and that was expected from the qualitative observations of the electron micrographs. lt is note worthy that the change in modalities to carry on light scatter ing measurements by using SLS and PCCS improved the sensibility of the method as wimesses by the detection of 2 or 3 populations. However, it remained insufficient cornpared
with methods based on single particle size measurement and methods including a separation by size prior to particle size measurement, i.e. AsFlFFF that have revealed a much corn
plex PSD for the nanoparticle dispersion considered in this
work in a consistent way. This confirms once more that light scattering methods should be applied carefully while charac terizing unknown dispersions. Although they are well im planted in laboratories and achieved measurements in few minutes, they are unsuitable to depict size characteristics of
dispersions having complex PSD (33,37-39). This is why sev
eral reports of the literature (19,33) recommend the use of at
least two methods to characterize unknown dispersions or
hyphenated separative particle size measurement methods
with other particle size measurement methods (32,39). From
the present work that have investigated size characteristics of a
complex dispersion of polymer nanoparticles with 9 methods
chosen among 3 classes of methods, it can be suggested that at least one of the two particle size measurement methods should be chosen among methods based on single particle size mea surement or should include a method of separation by size. Applications oflight scattering methods that are parts of the batch methods must only be applied to the characterization of
dispersions with simple
PSD
once this has been established.CONCLUSION
Taking account the inherent limitations of particle size mea surement methods, the evaluation of
PSD
of complex dispersions of nanoparticles with multimodal distribution is a diffi cult task to provide an accurate and representative
PSD. PSD
of unknown dispersions of nanoparticles should be measured
with two methods based on different physical principles in cluding at least one method based on single particle size
measurement or on a prior separative step of nanoparticles according to their size before size measurement.
ACKNOWLEDGMENTS AND DISCLOSURES
This work was supported by BpI France (Project NICE). The authors acknowledge the Région Ile de France (BEquipement mi lourd 2012^ program, DIM Malinf) and the JPK Company for their active support. The authors acknowledge all persons who performed measurement with different instru ments: Camille Roesch (Izon Science Europe Ltd, Magdalen Centre, The Oxford Science Park, Oxford, UK), Pierre Peotta (Malvern, Parc club de l’Université, Orsay, France), Philippe Violle (Sympatec, Orsay, France), Serge Réteaud (Beckman Coulter, Villepinte, France), Caroline Ferré and Alain Jalocha (Cilas, Orléans, France). The present work has benefited from the facilities and expertise of the Electron Micoscopy facilities of Imagerie Gif (http://www.i2bc.paris saclay.fr/spip.php?article282). This core facility is member of the Infrastructures en Biologie Santé et Agronomie (IBiSA), and is supported by the French national Research Agency under Investments for the Future programs BFrance BioImaging^, and the Labex BSaclay Plant Science^ (ANR 10 INSB 04 01 and ANR 11 IDEX 0003 02, respectively).
REFERENCES
1. Jung H, Kittelson DB, Zachariah MR. The influence of a cerium
additive on ultrafine diesel particle emissions and kinetics of oxida-tion. Combust Flame. 2005;142:276 88.
2. Jøgensen B, Kristensen SB, Kunov-Kruse AJ, Fehrmann R,
Christensen CH, Riisager A. Gas-phase oxidation of aqueous eth-anol by nanoparticle vanadia/anatase catalysts. Top Catal. 2009;52:253 7.
3. Wissing SA, Müller RH. Cosmetic applications for solid lipid
nano-particles (SLN). Int J Pharm. 2003;254:65 8.
4. Olivier J. Drug transport to brain with targeted nanoparticles.
NeuroRx. 2005;2:118 9.
5. Cormode DP, Naha PC, Fayad ZA. Nanoparticle contrast agents
for computed tomography: a focus on micelles. Contrast Media Mol Imaging. 2014;9(1):37 52.
6. Neuwelt EA, Varallyay P, Bago AG, Muldoon LL, Nesbit G,
Nixon R. Imaging of iron oxide nanoparticles by MR and light microscopy in patients with malignant brain tumours. Neuropathol Appl Neurobiol. 2004;30:456 71.
7. Perlman O, Weitz IS, Azhari H. Copper oxide nanoparticles as
contrast agents for MRI and ultrasound dual-modality imaging. Phys Med Biol. 2015;60(15):5767 83.
8. Galper MW, Saung MT, Fuster V, Roessl E, Thran A, Proksa R,
et al. Effect of computed tomography scanning parameters on gold nanoparticle and iodine contrast. Invest Radiol. 2012;47(8):475 81.
9. Liu CJ, Wang CH, Chen ST, Chen HH, Leng WH, Chien CC,
et al. Enhancement of cell radiation sensitivity by pegylated gold nanoparticles. Phys Med Biol. 2010;55(4):931 45.
10. Seaton A, Tran L, Aitken R, Donaldson K. Nanoparticles, human
health hazard and regulation. J R Soc Interface. 2009;7:119 29.
11. Li C. Structure controlling and process scale-up in the fabrication of
nanomaterials. Front Chem Eng China. 2010;4:18 25.
12. Organisation for Economic Co-operation and Development
(OCDE), Regulatory frameworks for nanotechnology in foods and medical products: summary results of a survey activity, DSTI/STP/NANO(2012)22/FINAL, 21 March 2013. Available
f r o m : h t t p : / / s e a r c h . o e c d . o r g / o f f i c i a l d o c u m e n t s /
publicdisplaydocumentpdf/?cote DSTI/STP/NANO% 282012%2922/FINAL&docLanguage En (consulted on November 2015). Available from.
13. Draft guidance from FDA, Considering Whether an
FDA-Regulated Product Involves the Application of Nanotechnology,
1 4 J u n e 2 0 1 1 . A v a i l a b l e f r o m :h t t p : / / w w w . f d a . g o v /
RegulatoryInformation/Guidances/ucm257698.htm (consulted on November 2015).
14. Reflection paper on the data requirements for intravenous
liposo-mal products developed with reference to an innovator liposoliposo-mal product, EMA/CHMP/806058/2009/Rev 02, 21 February 2013.
Available from:http://www.ema.europa.eu/docs/en_GB/
document_library/Scientific_guideline/2013/03/WC500140351.
pdf(consulted on November 2015).
15. Joint MHLW/EMA reflection paper on the development of block
copolymer micelle medicinal products, EMA/CHMP/13099/
2013, 17 January 2013. Available from:http://www.ema.europa.
eu/docs/en_GB/document_library/Scientific_guideline/2013/ 02/WC500138390.pdf(consulted on November 2015).
16. Report of the Joint Regulator -Industry Ad Hoc Working Group:
Currently Available Methods for Characterization of
Nanomaterials, 17 June 2011. Available from:http://ec.europa.
eu/consumers/sectors/cosmetics/files/pdf/iccr5_char_nano_en.
pdf(consulted on November 2015).
17. Organization for Economic Co-operation and Development
(OCDE), Guidance manual for the testing of manufactured nanomaterials: OECD’s sponsorship programme; First revision ENV/JM/MONO(2009)20/REV, 2 June 2010. Available from: http://search.oecd.org/officialdocuments/displaydocumentpdf/? cote env/jm/mono%282009%2920/rev&doclanguage en (consulted on November 2015).
18. FDA advisory committee for pharmaceutical science and clinical
pharmacology meeting Topic 2 Nanotechnology - Update on FDA
Activities, 9 August 2012. Available from:http://www fda.gov/
downloads/AdvisoryCommittees/CommitteesMeetingMaterials/Drugs/ AdvisoryCommitteeforPharmaceuticalScienceandClinicalPharmacology/ UCM314585.pdf(consulted on November 2015).
19. Gaumet M, Vargas A, Gurny R, Delie F. Nanoparticles for drug
delivery: the need for precision in reporting particle size parame-ters. Eur J Pharm Biopharm. 2008;69:1 9.
20. Shekunov BY, Chattopadhyay P, Tong HHY, Chow AHL. Particle
size analysis in pharmaceutics: principles, methods and applica-tions. Pharm Res. 2006;24(2):203 27.
21. Varenne F, Botton J, Merlet C, Beck-Broichsitter M, Legrand F-X,
Vauthier C. Standardization and validation of a protocol of size measurements by dynamic light scattering for monodispersed stable nanomaterial characterization. Colloid Surf A. 2015;486:124 38.
22. Braun A, Couteau O, Franks K, Kestens V, Roebben G, Lamberty
A, et al. Validation of dynamic light scattering and centrifugal liquid sedimentation methods for nanoparticle characterisation. Adv Powder Technol. 2011;22:766 70.
23. Woodward RC, Heeris J, St Pierre TG, Saunders M, Gilbert EP,
Rutnakornpituk M, et al. A comparison of methods for the measure-ment of the particle-size distribution of magnetic nanoparticles. J Appl Crystallogr. 2007;40:495 500.
24. Elizalde O, Leal GP, Leiza JR. Particle size distribution
measure-ments of polymeric dispersions: a comparative study. Part Part Syst Charact. 2000;17:236 43.
25. Fielding LA, Mykhaylyk OO, Armes SP, Fowler PW, Mittal V, Fitzpatrick S. Correcting for a density distribution: particle size analysis of core-shell nanocomposite particles using disk centrifuge photosedimentometry. Langmuir. 2012;28:2536 44.
26. Bell NC, Minelli C, Tompkins J, Stevens MM, Shard AG.
Emerging techniques for submicrometer particle sizing applied to Stoeber silica. Langmuir. 2012;28:10860 72.
27. Linsinger T, Roebben G, Gilliland D, Calzolai L, Rossi F, Gibson
N, et al, Requirements on measurements for the implementation of
the European Commission definition of the termBnanomaterial^.
JRC Reference Reports. 2012.
28. Powers KW, Brown SC, Krishna VB, Wasdo SC, Moudgil BM,
Roberts SM. Research strategies for satefy evaluation of nanomaterials. Part VI. Characterization of nanoscale particles for toxicological evaluation. Toxicol Sci. 2006;90(2):296 303.
29. Sowerby SJ, Broom MF, Petersen GB. Dynamically resizable
nanometre-scale apertures for molecular sensing. Sensors Actuators B. 2007;123:325 30.
30. Willmott GR, Vogel R, Yu SSC, Groenewegen LG, Roberts GS,
Kozak D, et al. Use of tunable nanopore blockade rates to investi-gate colloidal dispersions. J Phys-Condens Mat. 2010;22(45):1 11.
31. Vogel R, Willmott G, Kozak D, Roberts GS, Anderson W,
Groenewegen L, et al. Quantitative sizing of nano/microparticles with a tunable elastomeric pore sensor. Anal Chem. 2011;83:3499 506.
32. Lespes G, Gigault J. Hyphenated analytical techniques for
multidi-mensional characterisation of submicron particles: a review. Anal Chim Acta. 2011;692:26 41.
33. Anderson W, Kozak D, Coleman VA, Jämting ÅK, Trau M. A
comapartive study of submicron particle sizing platforms: accuracy, precision and resolution analysis of polydisperse particle size distri-butions. J Colloid Interface Sci. 2013;405:322 30.
34. Sokolova V, Ludwig A-K, Hornung S, Rotan O, Horn PA, Epple
M, et al. Characterisation of exosomes derived from human cells by nanoparticle tracking analysis and scanning electron microscopy. Coilloid Surf B. 2011;87:146 50.
35. Pace HE, Rogers NJ, Jarolimek C, Coleman VA, Gray EP, Higgins
CP, et al. Single particle inductively coupled plasma-mass spectrom-etry: a performance evaluation and method comparison in the de-termination of nanoparticle size. Environ Sci Technol. 2012;46: 12272 80.
36. van der Pol E, Coumans FAW, Grootemaat AE, Gardiner C,
Sargent IL, Harrison P, et al. Particle size distribution of exosomes and microvesicles determined by transmission electron microscopy, flow cytometry, nanoparticle tracking analysis, and resistive pulse sensing. J Thromb Haemost. 2014;12:1182 92.
37. Cascio C, Gilliland D, Rossi F, Calzolai L, Contado C. Critical
experimental evaluation of Key methods to detect, size and quan-tify nanoparticulate silver. Anal Chem. 2014;86:12143 51.
38. Calzolai L, Gilliland D, Garcìa CP, Rossi F. Separation and
char-acterization of gold nanoparticle mixtures by flow-field-flow frac-tionation. J Chromatogr A. 2011;1218:4234 9.
39. Ingebrigtsen L, Brandl M. Determination of the size distribution of
liposomes by SEC fractionation, and PCS analysis and enzymatic assay of lipid content. AAPS Pharm Sci Tech. 2002;3(2):9 15.
40. Sitar S, Kejžar A, Pahovnik D, Kogej K, Tušek-Žnidarič M,
Lenassi M, et al. Size characterization and quantification of exosomes by asymmetrical-flow field-flow fractionation. Anal Chem. 2015;87:9225 33.
41. Gun’ko VM, Klyueva AV, Levchuk YN, Leboda R. Photon
corre-lation spectroscopy investigations of proteins. Adv Colloid Interface. 2003;105:201 328.
42. ISO/TS 10797:2012: Nanotechnologies - Characterization of
single-wall carbon nanotubes using transmission electron microscopy.
43. ISO 133221:2004 Particle size analysis Image analysis methods
-Part 1: Static image analysis, methods.
44. Vauthier C, Persson B, Lindner P, Cabane B. Protein adsorption
and complement activation for di-block copolymer nanoparticles. Biomaterials. 2011;32:1646 56.
45. Rasband W. ImageJ (Computer Program), National Institute of
Health, 2013.
46. Cybernetics M. Image-Pro Plus (Computer Program), Roper
Industries, 2013.
47. Binnig G, Quate CF, Gerber C. Atomic force microscope. Phys
Rev Lett. 1986;56:930 3.
48. Meyer G, Amer NM. Novel optical approach to atomic force
mi-croscopy. Appl Phys Lett. 1988;53(12):1045 7.
49. Couteau O, Roebben G. Measurement of the size of spherical
nanoparticles by means of atomic force microscopy. Meas Sci Technol. 2001;22(6):65101 8.
50. Filipe V, Hawe A, Jiskoot W. Critical evaluation of Nanoparticle
Tracking Analysis (NTA) by NanoSight for the measurement of nanoparticles and protein aggregates. Pharm Res. 2010;27:796 810.
51. ISO 22 412:2008(E): Particle size analysis - dynamic light scattering
(DLS).
52. Cho TJ, Hackley VA. Fractionation and characterization of gold
nanoparticles in aqueous solution: asymmetric-flow field flow frac-tionation with MALS, DLS, and UV vis detection. Anal Bioanal Chem. 2010;398:2003 18.
53. Rbii K, Violleau F, Guedj S, Surel O. Analysis of aged gelatin by
AFlFFF-MALS: Identification of high molar mass components and their influence on solubility. Food Hydrocoll. 2009;23:1024 30.