INFLUENCE OF FLUORIDE ON THE ELECTROCHEMICAL BEHVIOR OF A NEW SYNTHESIZED Ti-10Ta-2Mo ALLOY FOR BIOMEDICAL APPLICATIONS
L. Sadi Oufella1,*, A. Benchettara2
1,2
Laboratory of Electrochemistry-Corrosion, Metallurgy and Inorganic Chemistry, Faculty of Chemistry, USTHB, El Alia-BP-32, Bab Ezzouar, Algiers 16 079, Algeria
Received: 22 March 2016 / Accepted: 22 August 2016 / Published online: 01 September 2016 ABSTRACT
The aim of the present study is to investigate the corrosion resistance of a new synthesized Ti-10Ta-2Mo in 0.9%NaCl solution containing different NaF concentrations using electrochemical techniques, including open circuit potential, potentiodynamic polarization, cyclic voltammetry and electrochemical impedance spectroscopy.
The results showed that Ti-10Ta-2Mo exhibits a good corrosion resistance in 0.9% NaCl as well as in 0.9%NaCl containing fluoride and even in acidified 0.9% NaCl free of fluoride ion. Very low corrosion current densities and high impedance values were obtained, indicating the passive behavior of the alloy. An active state was observed in acidified 0.9%NaCl of pH 2 in the presence of fluoride. The results showed that Ti-10Ta-2Mo is more appropriate than some materials cited in the literature, suggesting its suitability for biomedical applications.
Keywords: Ti-10Ta-2Mo; NaCl 0.9%; Fluoride; EIS ; Corrosion.
Author Correspondence, e-mail:mellesadioufella@yahoo.fr doi:http://dx.doi.org/10.4314/jfas.v8i3.5
1. INTRODUCTION
Titanium and titanium alloys are the best materials for biomedical and dental applications because of their biocompatibility, excellent mechanical properties and their good corrosion resistance in biological fluids. Their highly chemical stability is due to formation of a very resistant and protective oxide layer on their surface [1-3]. The phenomenon of passivation is a guarantee of their excellent resistance to corrosion in various electrolytic media such as
ISSN 1112-9867
Available online at http://www.jfas.info
Journal of Fundamental and Applied Sciences is licensed under aCreative Commons Attribution-NonCommercial 4.0 International License.Libraries Resource Directory. We are listed underResearch Associationscategory.
0.9%NaCl [4-7], Ringer’s solution[8-10], Hank’s solution[11, 12], Phosphate buffered saline solution PBS [13,14] and other simulated physiological media.
The contact between the metallic implant and the receiving living tissues is made through the oxide layer on the implant surface, which allows the ossteointegration process [15, 16]. The chemical properties of the oxide layer play an important role in the biocompatibility of titanium implants and the surrounding tissues and must not break down if the implant is to be successful.
However, titanium oxide films can be destroyed in the oral environment because of its pH variation, food decomposition, changes in temperature, humidity and oxygen presence. Fluoride is one of the elements that can interact with the metal surface [5, 8, 16-21].
Therapy with fluorides (F−) is known as the main method to prevent plaque formation and dental caries. Dentifrices, mouthwashes and prophylactic gels can contain from 200 to 20 000 ppm F−and can present acidic to neutral character (the pH is alkaline in the case of inflammations or infections) [22], which can affect the corrosion behavior of titanium alloys biomaterials present in the oral cavity. The effects of fluoride on the corrosion behavior of titanium and its alloys have been presented by several authors [17-21, 23-26]. According to their results, whenever in contact with fluoride solutions, the oxide film undergoes a reaction resulting in the formation of titanium fluoride, titanium oxide fluoride or sodium titanium fluoride on the alloy surface and the corrosion resistance decreases markedly in these fluoride solutions.
According to Strietzel [23], fluoride ions in organic acids with 2.1 < pH < 3.8 can react with Ti surfaces. Frateur et al.[24] observed some pitting on Ti in acidic fluoride media (pH 2.0 and 3.0). Reclaru and Meyer [25] showed that crevice corrosion and pitting occur on Ti alloys in a fluoride containing NaCl solution with pH below 3.5. Furthermore, Schiff [26] found pitting of Ti6Al4V alloy in fluoridated acidified saliva (pH 2.5).
On the other hand, among the various types of Ti alloys, the conventional Ti-6Al-4V was one of the first titanium biomaterial introduced in orthopedic implant applications and has achieved a greatest success. Although this alloy is still widely utilized in medicine, some concern has been recently expressed over its use since it appears that small amounts of both vanadium and aluminum, released in the human body, induce possible cytotoxic effect and neurological disorders, respectively [27, 28]. Due to the detrimental effect of Aluminum and vanadium, different titanium alloys containing non toxic elements (Nb, Ta, Mo, Zr) known as β-stabilizer elements, were developed in order to replace Ti-6Al-4V, such as Ti-Ta[29,30],
Ta-Mo [7, 8, 31, 32]; few works are available in the literature about the mechanical and corrosion behavior of Ti-Ta-Mo ternary alloy [33, 34].
Regarding literature, the corrosion behaviors are related to the concentration of fluoride and the surrounding environment Therefore, the surface reaction on the studied alloy under the existence of fluoride is important, to understand the corrosion of Ti-10Ta-2Mo in oral environment.
2. MATERIALS AND METHODS
Ti–10Ta-2Mo substrate used as the working electrode was synthesized from commercially pure Ti, Ta and Mo in an arc-furnace BUHLER MAMI type, under controlled argon atmosphere; ingot with approximately 15 g was obtained. In order to ensure homogeneity, the sample was turned and remelted another 8 times. The alloy was then homogenized at 1000°C for 48h then naturally cooled in the furnace to room temperature.
The alloy was characterized by X-ray diffraction using a PHILIPS PW diffractometer using CuKα radiation (1.54060 A° wave length). The microstructure of the Ti-10Ta-2Mo alloy was analyzed after mirror polishing and etching their surface with a Kroll solution which contains (15mL HNO3, 5mL HF and 80mL H2O) for approximately 15s by an optical microscope (ZEISS ICM 405). The microhardness was determined using ZEISS microhardness tester at a load of 200 g applied for 15s.
The studied material was embedded into a dental resin after soldering it to a copper wire covered by an insulating matter, giving a geometric area of 0.496 cm2. The active surface undergoes a particular polishing with emery paper of decreasing grit silicate–carbon papers (240, 600, 800, 1200 and 2400), watched with distilled water and immediately immersed in the corrosive medium.
The corrosion test electrolyte was 0.9% NaCl with a natural pH 5.5 was prepared from analytic grade agents and distilled water. The fluoride species were added to 0.9% NaCl solution using NaF salt to study the influence of fluoride at different concentrations (0, 250, 500, 750, 1000, 1500 and 9500 ppm). The 0.9% NaCl base solution and NaF concentrations were chosen based on some reports found in literature [4-6].
In the first part of this study; it was decided to not alter the pH obtained after NaF addition in order to avoid the addition of other substances. Indeed; different concentrations of NaF were added to the NaCl solution and the pH varies between 5.5 and 6.08. In the second part of this study, the pH was adjusted to pH 2 using dilute HCl solution. The solution was naturally
aerated and the experiments were conducted with stirring. The temperature was maintained at 37°C using a thermostatic bath. Prior to polarization experiments or impedance measurements (EIS), the working electrode was immersed in the test solution for one hour.
A conventional three electrode cell of multi necked flask was used in this study, where Ti-10-Ta-2Mo was the working electrode. The reference electrode was a saturated calomel electrode (SCE) to which all potentials were referred and a platinum electrode was used as a counter electrode.
Different electrochemical techniques were employed: Open circuit potential measurement, potentiodynamic polarization and cyclic voltammetry were taken with a computer controlled potentiostat PGP201 (Volta lab Radiometer Analytical) piloted by Volta Master 4.0. Potentiodynamic and cyclic voltammetry studies were carried out at a scan rate of 5mV/sec from -600mV to +2000mV vs. SCE with respect to open circuit potencial (OCP) to study the corrosion behaviour.
Electrochemical impedance spectroscopy measurements were performed using the electrochemical interface Solartron 1287 combined with the frequency response analyser Solartron 1260 [7], controlled by the Ecorr/Zplot Software. The frequency was scanned from 100 KHz down to 10 mHz and a 10 mV sinusoidal potential peak to peak was applied.
3. RESULTS AND DISCUSSION
3.1. Microstructure, crystallographic structure and microhardness of Ti-10Ta-2Mo The microstructure of the Ti-10Ta-2Mo alloy was analyzed after mirror polishing and etching their surface using a mixture of 15mL HNO3, 5mL HF and 80mL H2O for approximately 15s (Fig.1).
The microstructure of Ti-10Ta-2Mo reveals the presence of α-phase precipitates with a lamellar morphology in a β-phase matrix, due to the partial transformation of β-phase(dark area) to α-phase (light area) during natural cooling to room temperature in the furnace. Intermediate α’and α’’phases were also presente according to the DRX pattern.
Fig. 1. Optical micrograph of Ti10Ta2Mo alloy: (a) x100, (b) x 200
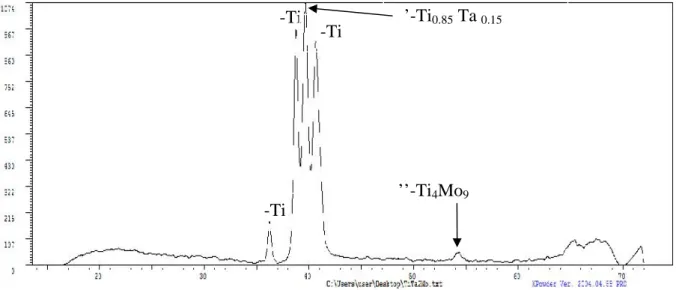
Fig. 2. XRD patern of Ti-10Ta-2Mo homogenized in vacuum at 1000°C for 48 h and natural cooling to room temperature in the furnace.
The alloy was characterized by X-ray diffraction (Fig.2), observed by optical microscopy and found to have a mixture of the body-centred-cubic β, hexagonal α, orthorhombic α’ and tetragonal α’’ phases. The microhardness of Ti-10Ta-2Mo alloys was found to be 389.5 ±5 HV0.2.
α-Ti β-Ti
α-Ti α’-Ti0.85Ta0.15
3.2 OCP and potentiodynamic polarisation studies of Ti-10Ta-2Mo alloy: 3.2. 1 Open circuit potential analysis
0 5 1 0 1 5 2 0 2 5 3 0 3 5 4 0 4 5 5 0 5 5 6 0 6 5 -7 0 0 -6 5 0 -6 0 0 -5 5 0 -5 0 0 -4 5 0 -4 0 0 -3 5 0 -3 0 0 -2 5 0 -2 0 0 0 p p m 2 5 0 p p m 5 0 0 p p m 7 5 0 p p m 1 0 0 0 p p m 1 5 0 0 p p m 9 5 0 0 p p m E (m V ) t(m in )
Fig. 3. Open circuit potential vs. time for Ti-10Ta-2Mo in 0.9% NaCl in presence of different concentrations of NaF after 1 h of immersion.
Fig.3 shows the profil of open-circuit potentials of Ti-10Ta-2Mo as a function of immersion time in aqueous 0.9% NaCl containing various NaF concentrations , at 37°C. The corrosion potentials increase rapidly with time in the noble direction, attesting the formation and growth of passive film on the surface.
All OCPs values are found in the stability region of TiO2 oxide in Ti-H2O Pourbaix and are recorded in Table.1 as a function as F-and HF concentrations calculated using the equilibria constants and mass conservation equation.
The same profils are observed in different physiological medias containing fluoride ion at neutral pH solution [10, 16]. The presence of fluoride ions in a solution containing 10000 ppm of NaF at pH 6.75 does not hinder the formation of a protective layer on the studied titanium alloy using cyclic voltammetry [15]. According to Nakagawa et al [20], in acidic conditions, 30 ppm of HF led to the destruction of the passive film on Ti surface. The amount of formed HF is much lower than 30ppm as shown in Table. 1; consequently the presence of F-ions in these conditions does not interfere with the formation of a protective layer.
Table.1 Open circuit potential values as a function of calculated F-, HF and pH
[NaF] / ppm measured pH [HF]/(ppm) [F-]/ (ppm) E(mV)
0 5.5 0 0 -235,02 250 6.03 0.36 249.63 -324,24 500 6.05 0.70 499.29 -349,14 750 6.04 1.08 748.91 -360,21 1000 6.07 1.34 99.65 -370,36 1500 6.05 2.11 1497.88 -380,18 9500 6.08 12.52 9487.47 -414,25
3.2.2 Potentiodynamic polarisation studies
-0.4 0.0 0.4 0.8 1.2 1.6 2.0 -7.0 -6.5 -6.0 -5.5 -5.0 -4.5 E(mV) lo g i( A /c m 2 ) 0ppm 250ppm 500ppm 750ppm 1000ppm 1500ppm 9500ppm
Fig. 4. Potentiodynamic polarization curves for Ti-10Ta-2Mo in 0.9% NaCl containing different NaF concentrations.
Potentiodynamic polarization curves of Ti-10Ta-2Mo in 0.9% NaCl solution containing different of fluoride concentrations ions at 37°C are illustrated in Fig. 4. For all NaF concentrations, the alloy reaches a stable passive current densities and no breakdown potential
is observed in the range potential test (until to 2 V vs. SCE). This indicates that the passive film formed on the surface of Ti-10Ta-2Mo alloy is very integral and protective.
The corresponding corrosion parameters calculated using Tafel extrapolation method Ti-10Ta-2Mo alloy are compiled in Table. 2.
There is a cathodic shift in Ecorr from -405 mV to -501.3 mV vs. SCE and an increase in icorr from 0.21µA/cm2 to1.24 µA/cm2 with the increase in fluoride ion concentration, indicating their negative effect.
The obtained values of icorrand ipassare in order of 10-7to 10-6A/cm2and are lower than those obtained by some authors [6, 16], indicating the good corrosion resistance of the studied alloy. In 0.9%NaCl containing 9500 ppm NaF, the icorr and ipass obtained are respectively about 1.24µA/cm2 and 25.67 µA/cm2 but Kumar et al [5] found in their studies that the values of icorr and ipass for Ti–15Mo (richer in Mo) in the same medium were respectively 2.30 μA/cm2 and ipass732µA/cm2. Ti-10Ta-2Mo performed well than Ti-15Mo richer in Molybdenum.
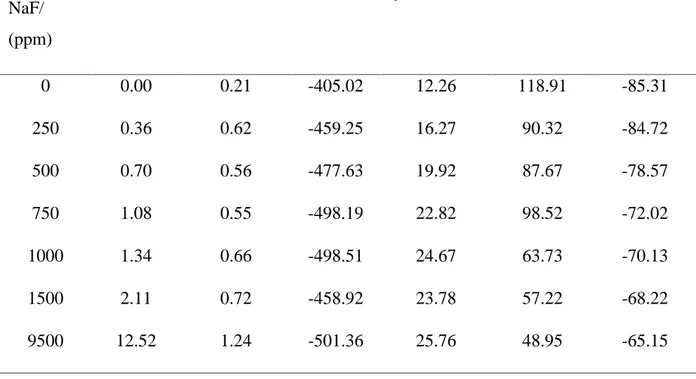
Table 2 Electrochemical parameters of Ti-10Ta-2Mo in 0.9NaCl containing different NaF concentrations obtained from the anodic polarization curves
NaF/ (ppm)
HF/(ppm) icorr(µA/cm2) Ecorr(mV) ipass(µA/cm2) Ba(mV/dec) Bc(mV/dec)
0 0.00 0.21 -405.02 12.26 118.91 -85.31 250 0.36 0.62 -459.25 16.27 90.32 -84.72 500 0.70 0.56 -477.63 19.92 87.67 -78.57 750 1.08 0.55 -498.19 22.82 98.52 -72.02 1000 1.34 0.66 -498.51 24.67 63.73 -70.13 1500 2.11 0.72 -458.92 23.78 57.22 -68.22 9500 12.52 1.24 -501.36 25.76 48.95 -65.15
3.2.3 Cyclic voltammetry analysis
Cyclic voltammograms recorded for Ti-10Ta-2Mo2Mo in 0.9% NaCl with various NaF concentrations are shown in Fig.5. They display a region of formation and growth of the anodic oxide in the passive region during the cathodic-anodic potential scan, reaching a current plateau. In the reverse scan, the current density value was reduced rapidly to values close to zero, without reduction of the oxide film formed. The fact that no pitting corrosion occurred in the potential scans in solutions suggests a high resistance to corrosion in the Ti-10Ta-2Mo alloy studied at the different NaF concentrations. The presence of fluoride ions did not prevent the formation of a protective layer at the surface of the alloy because of the small amount of HF formed at all aqueous solutions.
Similar passive behavior characteristic of valve metals was found by [9, 31, 34] but with higher passive current plateau. For example, A. V. Rodrigues [37] found when studying Ti-15Mo in Ringer solution at 25°C that the passive plateau currents are between 300µA/cm2and 800µA/cm2 which are very higher than those obtained in our study, varying between 12.26µA/cm2and 25.76 µA/cm2, in addition our study was carried out at 37°C. The Ti-10Ta-2Mo shows a better passive behavior than other materials richer in molybdenum.
-0,5 0,0 0,5 1,0 1,5 2,0 -30 -15 0 15 30 45 60 E(V) VS SCE i( A /c m 2 ) 0ppm 250ppm 500ppm 750ppm 1000ppm 1500ppm 9500ppm
Fig. 5. Cyclic voltammograms for Ti-10Ta-2Mo alloy in 0.9% NaCl containing various NaF concentrations; scan rate 5mV/s.
3.2.4. EIS data analysis
The EIS measurements of Ti-10Ta-2Mo in 0.9% NaCl solution with various concentrations of fluoride ion are presented through Nyquist and Bode phase plots.
The Nyquist diagrams show incomplete semicircles (Fig.6.a), whose diameter decreases slightly with increasing NaF concentration, denoting the dependence of the impedance values on the fluoride ion concentration. The decrease in resistance and increase in capacitance suggests the negative influence of fluoride ions on the corrosion resistance of Ti–10Ta-2Mo alloy and supports the observations made by potentiodynamic polarization studies.
For highly corrosion resistance materials, the corrosion resistance may even reach 105-106 Ω.cm2 [16, 35]. Therefore, in this study the alloy still maintained good corrosion resistance, though the presence of fluoride led to a decrease in resistance. In our study, the obtained resistance Rct values are between 17.47 kΩ.cm2and 134.85 KΩ.cm2 and are high enough to admit the good performance of the studied alloy. In addition, these values are higher than those obtained by some authors [5, 16]. S. Kumar [5] found only 65.8 KΩ.cm2 for Ti-15Mo richer in Molybdenum in 0.9NaCl without fluoride, in our study Rb is about 134.85 KΩ.cm2; in 0.9%NaCl containing 9500ppm of fluoride, S. Kumar found about 6.64 KΩ.cm2 and we found in our study 17.47 KΩ.cm2. Also, A.M. Al-Mayouf et al [16] found lower value of Rb for Ti6Al4V and Ti-30Cu-10Ag studied in artificial saliva at pH 7.2 without and with fluoride presence. The alloy Ti-10Ta-2Mo performs better compared to some alloys cited in the literature, confirming its suitability for biomedical applications.
0 10000 20000 30000 40000 50000 0 10000 20000 30000 40000 50000 60000 70000 80000 0 10000 20000 30000 40000 50000 0 5000 10000 15000 20000 25000 750ppm 0ppm 250ppm 500ppm 750ppm 1000ppm 1500ppm 9500ppm -Z '' (O h m /c m 2 ) Z' (Ohm/cm2)
Fig.6 (a). Nyquist plots of Ti–10Ta-2Mo alloy in natural 0.9% NaCl without and with varying NaF concentrations .
The Bode phase angle plots presented in Fig.6 (b) show two peaks revealing the involvement of two relaxation time constants, attributed to the bi-layered oxide surface consisting of a porous outer layer and a barrier inner layer [17,18]. The phase angle maximum approaching -90° at intermediate frequencies is typical for a passive surface indicating good corrosion resistance of the studied alloy.
-2 -1 0 1 2 3 4 5 0 10 20 30 40 50 60 70 80 log Frequency / Hz - / d eg re es 0ppm 250ppm 500ppm 750ppm 1000ppm 1500ppm 9500ppm
Fig.6 (b). Bode phase angle plots for Ti–10Ta-2Mo alloy in 0.9%NaCl without and with varying NaF concentrations.
An equivalent electrical circuit (ECC) consisted of Rs(C1R1)(CdlRct) was used to model the impedance spectra data (Fig.7) . Rs is the solution resistance, C1and R1 are the capacitance and resistance of the oxide film, respectively. Cdlis the capacitance of the double layer and Rct is the resistance charge transfer. This EEC was already proposed by different authors to fit the impedance data for titanium and titanium alloys [3, 4, 17, 18, 19, 22 36, 37]. The different electrochemical parameters derived from the impedance spectra simulated by ZView software are recorded in Table.3.
The layer at the interface cannot be considered as an ideal capacitor and the constant phase element (CPE) was often used as a substitute for the ideal capacitor. The impedance of CPE is given by:
1 ) ( n CPE C j Z .Where, C is the capacitance, (jω) is the complex variable for sinusoidal perturbations with
f
w2 ,and n is related to non-uniform current distribution due to surface roughness or inhomogeneity [21].
Fig. 7. The equivalent circuit used for the modeling of the impedance spectra for Ti-10Ta– 2Mo alloy in 0.9%NaCl without and with fluoride presence
Table. 3 Electrochemical parameters derived from the impedance spectra in 0.9%NaCl containing different NaF concentrations.
/ Rs(Ω.cm2) C1(F.cm-2) n1 R1(Ω.cm2) Cdl(F.cm-2) n2 Rct(Ω.cm2) 0ppm 18.93 1.17.10-5 0.89 5795 2.83.10-5 0.90 134850 250ppm 13.68 5.16.10-5 0.81 4254 3.88.10-5 0.86 88680 500ppm 10.82 5.89.10-5 0.79 3134 4.71. 10-5 0.84 68100 750ppm 5.51 5.79.10-5 0.80 1475 7.13.10-5 0.85 53047 1000ppm 5.34 5.92.10-5 0.75 1666 10.23.10-5 0.83 45091 1500ppm 17.97 6.20.10-5 0.77 8805 12.53.10-5 0.82 29896 9500ppm 11.4 6.56.10-5 0.71 3983 14.52.10-5 0.83 17478
3.3 OCP measurements and potentiodynamic polarisation studies of Ti-10Ta-2Mo alloy at pH 2
0 10 20 30 40 50 60 -1000 -900 -800 -700 -600 -500 -400 E / (m V v s E S C ) t(min) 0ppm 250ppm 500ppm 750ppm 1000ppm 1500ppm 9500ppm
Fig . 8. Variation of open circuit potential with exposure time for Ti-10Ta-2Mo in acidified 0.9%NaCl, containing various NaF concentrations (0 to 9500ppm) at pH 2.
Fig.8 shows the variation of OCP for Ti-10Ta-2Mo in 0.9% NaCl without and with different fluoride concentrations at pH 2.
For 0.9% NaCl of pH 2 without fluoride, the OCP shifts on the noble direction, attesting the development of passive films on the studied alloy. In 0.9% NaCl of pH 2 containing fluoride, the OCPs drop sharply to very negative values and then start to increase and reach a constant value. Similar behavior was observed by other authors [38, 8, 16], but with more negative values of OCP.
The open circuit potential obtained in our study in 0.9%NaCl containing fluoride varies between -428mV and -796mV after 1h of immersion, values which are more noble but those obtained by A. Robin [8] for CP-Ti, Ti-5Nb-13Zr, Ti-13Nb-13Zr and Ti-20Nb-13Zr in Ringer’s solution of pH 3 containing 1000 ppm F, the values are between 881 mV and -964mV respectively. The OCP values found by A.M Al-Mayouf [16] for Ti and Ti-6Al-4V in artificial saliva of pH 3.0 containing only 0.01M fluoride are about -952MmV and -924mV, respectively.
Such a decrease in potential denotes the active behavior of the studied alloy [32, 39, 40]. At pH 2, F-ions are hydrolyzed and the HF amount formed increases with increasing NaF added to 0.9%NaCl solution. Table.4 reports the calculated concentration of and HF, F-for pH=2 at different fluoride ions and the corresponding open circuit potential after 1Sec, 1min and 1h. It is clear that the concentration of HF formed increases with increasing NaF added to the base
solution 0.9%NaCl at pH 2, this lead to the destruction of the passive layer. Visual inspection confirms the macroscopic corrosion and the roughness of the alloy surface.
Table.4 Open circuit potential values after 1sec, 1min and 60 min of immersion at pH 2 obtained from the OCP measurement
[NaF] ppm HF/ppm F- /ppm E(mV) after 1sec E (mV) after 1min E(mV) after 1H 0 0.00 0.00 -562.08 -486.01 -428.31 250 235.18 14.82 -534.25 -985.21 -796.23 500 470.36 29.63 -794.32 -943.12 -778.41 750 705.55 44.45 -670.63 -980.14 -752.14 1000 940.73 59.27 -749.12 -917.41 -715.12 1500 1411.1 88.90 -355.47 -886.23 -690.21 9500 8936.97 . 563.03 -796.21 -836.31 -657.08
3.3.2 Potentiodynamic polarisation studies at pH 2
- 1 , 5 - 1 , 0 - 0 , 5 0 , 0 0 , 5 1 , 0 1 , 5 2 , 0 - 8 - 7 - 6 - 5 - 4 - 3 - 2 - 1
lo
gi
/
(A
/c
m
2)
0 p p m 2 5 0 p p m 5 0 0 p p m 7 5 0 p p m 1 0 0 0 p p m 1 5 0 0 p p m 9 5 0 0 p p m E ( V ) v s S C EFig.9. Potentiodynamic polarization curves for Ti-10Ta-2Mo alloy in acidified 0.9%NaCl with varying NaF concentrations at pH 2
The anodic polarization curves of Ti-10Ta-2Mo in 0.9% NaCl solution of pH 2, containing various NaF concentrations are presented in Fig. 9. These curves present a noticeable active-passive transition, which supports the spontaneous active behavior of Ti-10Ta-2Mo at OCP under these conditions. Similar results were obtained for Ti, Ti-6Al-7Nb and Ti-6Al-4V alloys in 0.1%NaF [38] and for CP-Ti, Ti-5Nb-13Zr, Ti-13Nb-13Zr and Ti-20Nb-13Zr in Ringer’s solution of pH 2 containing 1000 ppm of fluorides [8].
The active behavior was attributed to the presence of hydrofluoric acid HF which dissolves the oxide film on the surface of the alloy via the formation of Ti-F compounds such as TiF3, TiF4, and TiOF2according to the following reactions [20]:
O H TiOF HF TiO2 2 2 2 (1) O H TiF HF TiO2 4 4 2 2 (2) O H TiF HF O Ti2 3 6 2 3 3 2 (3)
Table.5 reports the different electrochemical parameters as a function as the formed HF concentration. The corrosion current densities icorrand passive current densities ipassincreased
nearly 3 and 2 order of magnitude respectively in 0.9%NaCl containing fluoride ions at pH 2, when compared to the values measured for 0.9% NaCl without fluoride ions. The same tendency was found in several studies [8, 16, 20, 21, 38, 40].
Table. 5 Electrochemical parameters of Ti-10Ta-2Mo in 0.9%NaCl containing different NaF concentrations at pH 2 obtained from the anodic polarization curves
[NaF]/ (ppm)
HF (ppm)
Ecor/mV Icor/µA/cm2 ipass(µA/cm2) Ba(mV/dec) Bc (mV/dec) 0 0.00 -391 0.72 25.23 109.42 -89.22 250 235.18 -720 170.7 676.82 117.504 -94.51 500 470.36 -792 240.3 1096.47 125.32 -98.13 750 705.55 -723 333.1 1737.80 140.41 -104.51 1000 940.73 -725 689.5 2045.73 147.93 -105.12 1500 1411.1 -686 738.2 3162.27 150.11 -107.94
9500 8936.97. -664 836.4 5128.13 156.32 -113.32
3.2.3. EIS data analysis at pH 2
0 10 20 30 40 50 60 70 80 90 -20 0 20 40 60 80 100 120 140 -Z ''( O h m .c m 2 ) Z'(Ohm.cm2) 250ppm 500ppm 750ppm 1000ppm 1500ppm 9500ppm 0 2000 4000 6000 8000 10000 0 2000 4000 6000 8000 10000 0 ppm
Fig.10 (a). Nyquist diagrams of Ti–10Ta-2Mo in 0.9%NaCl without and with varying NaF concentrations at 37°C at pH 2.
The impedance spectra of Ti-10Ta-2Mo alloy in 0.9%NaCl containing different fluoride ion concentrations are presented as Nyquist and bode phase angle plots and are shown in Fig.10 (a) and Fig.10 (b) respectively. The Nyquist plots without fluoride ions exhibit a small and flattened semicircle, followed by another incomplete semicircle with high impedance value. In the presence of fluoride ions, Nyquist plots are constituted of two defined semicircles characterized by very small diameters which decrease drastically as the fluoride concentration increase, indicating the great reduction in corrosion resistance. Two relaxation time constants are clearly indicated by two peaks on the phase angle plots denoting the presence of two layers at the surface (Fig.10 (b)).
The impedance data were fitted using the equivalent electrical circuit shown in Fig.7 and the different electrochemical parameters derived from the impedance spectra simulated by ZView software were recorded in Table.6.
-2 -1 0 1 2 3 4 5 0 10 20 30 40 50 60 70 -P h as e an g le / d eg re es logf(Hz) 0ppm 250ppm 500ppm 750ppm 1000ppm 1500ppm 9500ppm
Fig.10 (b). Bode phase diagrams of Ti–10Ta-2Mo in 0.9%NaCl without and with varying NaF concentrations at pH 2.
The corrosion resistance of the alloy diminished significantly at pH 2 when the concentration of fluoride ions increases. Very low values of the charge transfer resistance are found and it indicates that it does not act as a barrier layer [41]. The presence of high concentration of fluoride destroyed the two layers affecting severely their corrosion resistance [42]. An identical tendency is obtained by A. Robin et al [21] but with more feeble values of charge transfer resistance.
The charge transfer obtained for Ti-10Ta-2Mo in 0.9% NaCl containing 1000 ppm of fluoride is 18.40 Ω.cm2 (Table.6), which is higher than those obtained for Ti-6Al-4Vand Ti-23Ta alloys in saliva of pH 2 containing 1000 ppm Fluoride [21] . The charge transfer resistances are only about 2.727 and 9.995 Ω.cm2, respectively. This comparison indicates the good performance of the studied Ti-10Ta-2Mo alloy.
Table. 6 Electrochemical parameters derived from the impedance spectra in 0.9%NaCl containing different NaF concentrations at pH 2
/ Rs(Ω.cm2) C1 (F.cm-2) np R1(Ω.cm2) Cdl (F.cm-2) nb Rct(Ω.cm2) 0ppm 12.21 0.00024 0.806 378.30 0.00026 0.95 78205 250ppm 12.88 0.0038 0.854 30.39 0.021 0.90 43.62 500ppm 12.50 0.0039 0.875 23.15 0.015 0.91 26.50 750ppm 12.01 0.0044 0.875 16.21 0.026 0.92 24.68 1000ppm 12.91 0.0038 0.854 11.47 0.026 0.93 18.40 1500ppm 9.87 0.0025 0.883 07.21 0.033 0.95 06.47 9500ppm 1.39 0.0011 0.898 4.20 0.055 0.98 3.50 4. CONCLUSION
In this work, a new titanium alloy Ti-10Ta-2Mo was synthesized using the melting process in an arc furnace, under atmosphere of argon. The influence of fluoride ion concentration and pH on the electrochemical and corrosion behaviors of Ti-10Ta-2Mo in 0.9% NaCl was investigated utilizing electrochemical techniques. The main conclusions are summarized as follows:
In natural 0.9% NaCl solution containing fluoride, the HF concentration formed was low and not sufficient to dissolves the passive film that naturally exists at the surface of the alloy. The increase in fluoride ions concentration decreases slightly the corrosion resistance of the alloy but does not interfere with the formation of a protective layer at the surface.
Very low corrosion current densities and passive current densities (in the order of 10-6 A/cm2) were obtained from the polarization curves, which is indicative of higher stability of the passive films in 0.9%NaCl with and without fluoride ions in natural 0.9% NaCl solution. High impedance values (in order of 106Ωcm2) were obtained corroborating with the results obtained in the OCP, potentiodynamique polarization and cyclic voltammetry techniques.
In acidified 0.9% NaCl not containing fluoride, a passive behavior is observed was observed for Ti-10Ta-2Mo, traduced by very low current densities and high impedance values.
In acidified 0.9% NaCl solution of pH 2 containing various concentrations of fluoride, the corrosion resistance of Ti-10Ta-2Mo decreased markedly in comparison with that in a solution not containing fluoride which is due to the interaction of the alloy with the important content of HF formed at pH 2 resulting to the progressive deterioration of surface oxide film.
At pH 2, increased fluoride increased icorr from 1.59 to 836.4 µA/cm2 and shifted Ecorr from -391 to -664mV, moreover, very low impedance (101Ωcm2) values were obtained which confirm the active state of the Ti-10Ta-2Mo under these conditions attributed to the presence of high HF concentration.
The comparison of our results to other studies attested that Ti-10Ta-2Mo performed well than some other materials cited in the literature and is acceptable for biomedical applications.
5. REFERENCES
[1] Huang YZ, Blackwood DJ. Characterization of titanium oxide film grown in 0.9% NaCl at different sweep rates. Electrochim. Acta., 2005, 51, (1099-1107)
[2] Fadl-allah Sahar A, Mohsen Q. Characterization of native and anodic oxide films formed on commercial pure titanium using electrochemical properties and morphology techniques. Appl. Surf. Sci., 2010, 256, (5849–5855)
[3] Pan. J, Thierry. D, Leygraf. C, Electrochemical impedance spectroscopy study of the passive oxide film on titanium for implant application. Electrochim. Acta., 1996, 41, (1143-1153)
[4] Xie FX, He XB, Cao SL, Lu X, Qu XH. Structural characterization and electrochemical behavior of a laser-sintered porous Ti–10Mo alloy. Corros. Sci., 2013, 67, (217–224)
[5] Kumar S, Sankara Narayanan TSN. Corrosion behaviour of Ti–15Mo alloy for dental implant applications. J. Dent., 2008, 36, (500 – 507)
[6] Kumar S, Sankara Narayanan TSN. Influence of fluoride ion on the electrochemical behavior of β-Ti alloy for dental implant application. Corros. Sci., 2010, 52 , (1721 –1727)
[7] Wang BL, Zheng YF, Zhao LC. Electrochemical corrosion behavior of biomedical Ti-22Nb and Ti- Ti-22Nb-6Zr alloys in saline medium. Mater. Corros., 2009, 60, (788–794)
[8] Robin A, Carvalho OAS. Influence of pH and Fluoride Species on the Corrosion Behavior of Ti-xNb-13Zr Alloys in Ringer’s Solution. Adv. Mater. Sci. Eng., 2013, (2013), doi:
http://dx.doi.org/10.1155/2013/434975
[9] Oliveira NTC, Ferreira EA, Durate LT, Bggio SR, Rocha-Filho RC, Bocchi N. Corrosion resistance of anodic oxides on the Ti-50Zr and Ti-13-Nb-13-Zr alloys. Electrochim. Acta., 2006, 51, (2068-2075)
[10] Robin A, Carvalho OAS, Schneider SG, Schneider S. Corrosion behavior of Ti-xNb-13Zr alloys in Ringer’s solution. Mater. Corros. 2008., 59, (929-933)
[11] De Assis SL., Wolynec S, Costa I. Corrosion characterization of titanium alloys by electrochemical techniques. Electrochim. Acta., 2006, 51, (1815–1819)
[12] Assis SL, Costa I. Electrochemical evaluation of Ti-13Nb- 13Zr, 4V and Ti-6Al-7Nb alloys for biomedical application by long-term immersion tests. Mater. Corros., 2007, 58, (329–333)
[13] Khan MA, Williams RL, Williams DF. In-vitro corrosion and wear of titanium alloys in the biological environment. Biomater., 1996, 17, (2117–2126)
[14] Khan MA, Williams RL, Williams DF. The corrosion behavior of 4V, Ti-6Al-7Nb and Ti-13Nb-13Zr in protein solutions. Biomater., 1999, 20, (631–637)
[15] Toumelin-chemia F, Rouelle, F, Burdairon G. Corrosive properties of fluoride-containing odontologic gels against titanium. J. Dent., 1996, 24, (109-115)
[16] Al-Mayouf AM, Al-Swayih AA, Al-Mobarak NA, Al-Jabab AS. Corrosion behavior of a new titanium alloy for dental implant applications in fluoride media. Mater. Chem. Phys., 2004, 86, (320–329)
[17] Souza JCM, Barbosa SL, Ariza E, Celis JP, Rocha LA. Simultaneous degradation by corrosion and wear of titanium in artificial saliva containing fluorides. Wear., 2012, 292–293, (82–88)
[18] Huang HH. Electrochemical impedance spectroscopy study of strained titanium in fluoride media. Electrochim. Acta., 2002,47, (2311-2318)
[19] Souza JCM., Barbosa SL, Ariza E, Henriques M, Teughels W, Ponthiaux P, Celis JP , Rocha LA. How do titanium and Ti6Al4V corrode in fluoridated medium as found in the oral cavity? An in vitro study. Mater. Sci. Eng. C., 2015, 47, (384–393)
[20] Nakagawa M, Matsuya S, Shiraishi T, Ohta M. Effect of fluoride concentration and pH on corrosion behavior of titanium for dental use. J. Dent. Res., 1999, 78(9), (1568 – 1572)
[21] Robin A, Meirelis JP. Influence of fluoride concentration and pH on corrosion behavior of Ti-6Al-4V and Ti-23Ta alloys in artificial saliva. Mater. Corros., 2007, 58, (173–180)
[22] Calderon Moreno JM, Vasilescu E, Drob P, Osiceanu P, Vasilescu C, Drob SI, Popa M. Surface and electrochemical characterization of a new ternary titanium based alloy behaviour in electrolytes of varying pH. Corros. Sci., 2013, 77, (52–63)
[23] Streitzel R, Hösch A, Kalbfleisch H, Buch D. In vitro corrosion of titanium, Biomater., 1998, 19(16),(1495-1499)
[24] Frateur I, Lattarin S, Musiani M, Tribollet BJ. Electrodissolution of Ti and p-Si in acidic fluoride media: formation ratio of oxide layers from electrochemical impedance spectroscopy. J.Electroanal. Chem., 2000, 482(2), (02- 210)
[25] Reclaru L, Meyer JM. Effects of fluorides on titanium and other dental alloys in dentistry. Biomater., 1998, 19(1-3),(85-92)
[26] Schiff N, Grosgogeat B, Lissac M, Dalard F. Influence of fluoride content and pH on the corrosion resistance of titanium and its alloys. Biomater.,1995, 23(9),(1995-2002)
[27] Lavos-Valereto IC, Wolynec S, Deboni MCZ, Konig Jr B. In-vitro and in-vivo biocompatibility testing of Ti–6Al–7Nb alloy with and without plasma-sprayed hydroxyapatite coatings. J. Biomed. Mater. Res., 2001, 58,(727–33)
[28] Brama M, Rhodes N, Hunt J, Ricci A, Teghil R, Migliaccio S and al. Effect of titanium carbide coating on the ossteointegration response in vitro and in vivo. Biomater., 2007, 28,(595–608)
[29] Zhou YL, Niinomi M, Akahori T, Fukui H, Toda H. Corrosion resistance and biocompatibility of Ti–Ta alloys for biomedical applications. Mater. Sci. Eng. A., 2005, 398, (28–36)
[30] Mareci D, Chelariu R, Gordin DM, Ungureanu G, Gloriant T. Comparative corrosion study of Ti–Ta alloys for dental applications. Acta Biomater., 2009, 5, (3625–3639)
[31] Oliveira NTC, Aleixo G, Caramb R, Guastaldi AC. Development of Ti–Mo alloys for biomedical applications: Microstructure and electrochemical characterization. Mater Sci. Eng. A., 2007, 452–453, (727–731)
[32] Oliveira NTC, Guastaldi AC. Electrochemical stability and corrosion resistance of Ti– Mo alloys for biomedical applications. Acta Biomater., 2009, 5, (399–405)
[33] Delvat E, Gordin DM, Gloriant T, Duval JL, Nagel MD. .Microstructure, mechanical properties and cytocompatibility of stable beta Ti–Mo–Ta sintered alloys. J. Mech. Behav. Biomed. Mat., 2008, 1(4), (345-351)
[34] Gordin DM, Gloriant T, Nemtoi Gh, Chelariu R, Aelenei N, Guillou A, Ansel. Synthesis, structure and electrochemical behavior of a beta Ti-12Mo-5Ta alloy as new biomaterial. Mater. Lett., 2005, 59(23), (2936 – 2941)
[35] D.A. Jones, Principles and Prevention of Corrosion, Prentice-Hall, 2ndedition, New Jersey, 1996, pp. 143-167.
[36] Dalmau A, Guinon Pina V, Devesa F, Amigo V, Igual Munoz A. Electrochemical behavior of near-beta titanium biomedical alloys in phosphate buffer saline solution. Mater. Sci. Eng. C., 2015, 48, (55-62)
[37] Rodrigues AV, Oliveira NTC, Dos Santos ML, Guastaldi AC. Electrochemical behavior and corrosion resistance of Ti–15Mo alloy in naturally-aerated solutions, containing chloride and fluoride ions. J. Mat. Sci: Mater. Med., 2015, doi: 10.1007/s10856-014-5323-0
[38] Nakagawa M, Matsuya S, Udoh K. Corrosion behavior of pure titanium and titanium alloys in fluoride-containing solutions. Dent. Mater. J., 2001, 20, (305–14)
[39] Nakagawa M, Matsuya S, Udoh K, Effect of fluoride and dissolved oxygen concentrations on the corrosion behavior of pure titanium and titanium alloys. Dent. Mater. J., 2002, 21, (83–92)
[40] Nakagawa M, Matono Y, Matsuya S, Udoh K, Ishikawa K. The effect of Pt and Pd alloying additions on the corrosion behavior of titanium in fluoride containing environments. Biomater., 2005, 26, (2239–2246)
[41] Cheng TP, Lee JT and Tsai WT. Passivation of titanium in molybdate containing sulphuric acid solution. Electrochim. Acta., 1991, 36, (2069-2076)
[42] Huang HH, Lee TH. Electrochemical impedance spectroscopy study of Ti–6Al–4V alloy in artificial saliva with fluoride and/or bovine albumin. Dent. Mater., 2005, 21, (749–755)
How to cite this article:
Sadi Oufella L, Benchettara A. Influence of fluoride on the electrochemical behvior of a new synthesized ti-10ta-2mo alloy for biomedical applications. J. Fundam. Appl. Sci., 2016, 8(3),