HAL Id: hal-02355306
https://hal.archives-ouvertes.fr/hal-02355306
Submitted on 8 Nov 2019
HAL is a multi-disciplinary open access
archive for the deposit and dissemination of
sci-entific research documents, whether they are
pub-lished or not. The documents may come from
teaching and research institutions in France or
abroad, or from public or private research centers.
L’archive ouverte pluridisciplinaire HAL, est
destinée au dépôt et à la diffusion de documents
scientifiques de niveau recherche, publiés ou non,
émanant des établissements d’enseignement et de
recherche français ou étrangers, des laboratoires
publics ou privés.
On reducing the cross-domain traffic of box-powered
CDN
Yiping Chen, Jimmy Leblet, Gwendal Simon
To cite this version:
Yiping Chen, Jimmy Leblet, Gwendal Simon. On reducing the cross-domain traffic of box-powered
CDN. ICCCN 2009 : 18th International Conference on Computer Communications and Networks, Aug
2009, San Francisco, United States. �hal-02355306�
On Reducing the Inter-AS Traffic
of Box-Powered CDN
Yiping Chen
∗†, Jimmy Leblet
†, Gwendal Simon
†∗Thomson Research, France
†Institut T´el´ecom - T´el´ecom Bretagne, France {firstname.lastname}@telecom-bretagne.eu
Abstract—On-demand video delivery with a Content Delivery Network (CDN) solely based on set-top-boxes has been recently introduced. In previous works, videos are separated into pieces and randomly stored in boxes, requests from clients being redirected to the nearest boxes. However, random strategy may lead to some costly and inefficient allocation. For example, a video part could be placed much further than other parts of the same video, while two close boxes host the same part. This paper aims to reduce downloading cost by exploiting the network location of boxes when allocating the videos. We show that optimizing the allocation is NP-hard. In this paper, in order to analyze the impact of different content allocation methods on cross-domain traffic, we compare an existing approximate algorithm and two simple heuristics with random allocation. Simulations with realistic network settings demonstrate that inter-AS traffic can be efficiently reduced, when knowledge on network topology is integrated in the allocation algorithm, such as links and relationships among Autonomous Systems.
I. INTRODUCTION
The advantages of exploiting set-top-boxes to raise a mas-sive and cheap box-powered Content Delivery Network (CDN) have been introduced in [1]. Several studies have recently refined the design of this appealing system with a focus on Video on Demand services [2]–[5]. It has been shown that an optimal architecture requires to cut the videos into smaller pieces (sub-streams) and to distribute these sub-streams over the boxes, clients being expected to find all sub-streams of the requested video in nearby boxes. However, the size of the catalog of videos is very large, although the number of boxes is limited, so not so many boxes host sub-streams of a given video [4]. Hence, a client is sometimes unable to find all sub-streams on boxes that are within its Autonomous System (AS). Previous works have considered a basic random strategy to allocate the sub-streams to boxes. However, random strategy may lead to some costly and inefficient allocation. For exam-ple, two boxes within the same AS may host the same sub-stream while one sub-sub-stream of this video is not available in this AS. This would produce some unnecessary inter-AS traf-fic, and calls for the design of new content allocation strategies aiming at reducing the cross-domain traffic generated by the use of a box-powered CDN.
We formulate four applicative scenarios:
• the service provider has a full knowledge, i.e. it knows
the exact position of every box and every future client, moreover it knows the cost of transmitting data from any box to any client. In this ideal case, the formal
description of the sub-stream allocation problem reveals that determining an optimal allocation is NP-hard.
• the service provider does not know the location of clients, but it knows the location of boxes and the network cost of the links between boxes. This scenario corresponds to a service provider being also a large Internet Service Provider (ISP) responsible of various ASs over the In-ternet. It can perfectly determine the cost of transmitting data from one of its AS to another.
• the service provider knows the location of boxes and the
inter-AS map. It is then able to estimate the inter-AS rout-ing, but it does not know inter-AS peering agreements. This scenario occurs when the service provider is not related with network operators.
• the service has no knowledge, therefore the only way to allocate the content is to use a random strategy.
In this paper, we make a theoretical analysis of the inter-AS traffic generated by a box-powered CDN. This work is thus another step in the design of these attractive systems. To the best of our knowledge, this is the first time that networking aspects are thoroughly studied in this topic. This paper could thus be used as a guideline for the settings of box-powered CDN. Our main contribution is the analysis of the gain that can be expected by the service provider if it implements a strategy exploiting its knowledge. Our simulations show that the inter-AS traffic can be reduced by up to 60%, that is, a lightweight strategy based on a realistic knowledge can provide substantial savings for network operators.
The remainder of this paper is organized as follows: We introduce related works in Section II. Then, we propose a theoretical analysis in Section III. We show the results of our simulations in Section IV.
II. RELATEDWORKS
We first recall the main design principles of box-powered CDN. They are now clearly stated, this part allows us to emphasize our exact position in the state of the art, and to review some previous works. In a second part, we give some details about close works that have been conducted for CDN and peer-to-peer VoD systems.
A. Box-Powered CDN
1) a catalog of videos (noted C) to be hosted by the box-powered CDN is selected. Requests for the top 5%
popular videos (approximately half of the global traffic) are handled by CDN proxies. The traffic generated by the three quarter most unpopular videos (a tenth of the global traffic) is managed by the data-center. Therefore, the catalog C is chosen in the remaining: several millions of mid-popular videos in the popularity range [5%, 25%]. 2) a set of boxes (noted V) agree to participate.
3) each video a ∈ C is cut into kaindependent sub-streams.
The principle of spreading distinct video sub-streams in distributed video service is now widely admitted [6]. The optimal number of sub-streams per video has been extensively studied in [4].
4) a subset of boxes Va⊂ V is chosen to host a sub-stream
of the videoa ∈ C. The ideal number of boxes (|Va|) has
been thoroughly analyzed in [3, 4]. A random choice of boxes is usually assumed.
5) the ka sub-streams of a video a ∈ C is allocated to
the boxes Va. Capacity constraint imposes to allocate
only one sub-stream to each box. Previous works have neglected the question of which sub-stream to which box. This is the topic of this paper.
6) requests from clients of any video a ∈ C (noted Ja)
are automatically routed to the ka nearest boxes in
Va hosting separate sub-streams. Various works have
addressed the nearest server selection problem [7]–[10] B. CDN and Peer-to-Peer VoD
The design of a CDN hosting multiple sub-streams has been introduced in [11]. Authors provide a short description of a coloring problem where the goal is to assign to each proxy a color corresponding to a unique sub-stream. However, this study considers only two sub-streams per video, so the distribution of sub-streams across proxies is not really an issue. Since, it has been shown that increasing the number of sub-streams can lead to substantial performance improvements (e.g. [12, 13]). Therefore, the problem of allocating sub-streams to participants of a delivery network has been more deeply analyzed, but these works usually focus on maintaining a number of sub-streams proportional to their popularity as a countermeasure to crashes [14, 15]. How to reduce the network cost when clients retrieve all pieces of requested video segments is less frequently addressed. The distributed storage system described in [16] proposes a mechanism to discover the “closest” video parts. However, the allocation algorithm does not take into account any network proximity, so a video sub-stream may be excessively far from other sub-streams while two close peers could store the same sub-stream. In our context, the video service provider is expected to implement a redirection mechanism able to route the request of clients to the k closest peers hosting the k required sub-streams of the requested video.
III. THEORETICALANALYSIS A. Problem Formulation
Generally, a large catalog of videos is hosted by the box-powered CDN. For a given video a, the set Va is nearly static
for several hours or days, because pushing the content to boxes is a costly operations that is not done frequently. Therefore, all videos can be treated independently, and we will omit the subscript a in the notation. The set of clients is thus noted J , the set of selected boxes V and the number of descriptions k. We call network cost the cost to transport the data from the boxes hosting the sub-streams to the clients. The notion of network cost is generic: it can be computed at the AS level with cross-domain cost or at the router level with the number of traversed routers. In this paper, without loss of generality, we use the first indicator, so we consider an AS-level Internet map, the network cost is computed using the AS path length and the relationship among ASes. We denote by d(x, p) the cost of the transport of one sub-stream from a box x ∈ V to a client p ∈ J . The decision problem related with allocating the sub-streams to boxes can be formulated as follows. Decision Problem for Box-powered Video Delivery Net-work
INSTANCE: Two subsets J and V , a positive integer k ≤ |V |,
a cost function d : J × V → R+ and a positive real K ∈ R.
QUESTION : Is there a labelling function ϕ from V onto
{1, · · · , k} such that the sum of all minimum costs to other sub-streams is lower or equal to K, that is :
X p∈J X i∈[1,k] min {d(x, p) : x ∈ V, ϕ(x) = i} ≤ K B. Approximation Algorithms
This problem is a sub-problem of k-Product Uncapacitated Facility Location Problem (k-PUFLP) [17]. It is known as NP-hard. An approximate optimal algorithm for the k-PUFLP problem has been recently proposed in [18]. The algorithm is able to find a solution which it is at most 32k − 1 times the optimal solution. The idea of this algorithm is as follows. For each client p ∈ J , the set of k nearest boxes, N (p), and the overall costP
p∈N (x)d(x, p) are computed. Then, clients
are processed iteratively in ascending order of overall cost. For every client, the algorithm tries to place k distinct sub-streams for all boxes in N (p). If it is impossible, then the next client is processed. When all clients are processed, if it remains unfilled boxes, they choose a random sub-stream.
Despite various stochastic models are studied, we can hardly imagine that the location of clients is precisely known in advance. Therefore, we use here a simpler approach. We consider only boxes, therefore we assume that clients and boxes are merged, and the distance between two boxes x and y is still noted d(x, y). Note that, the problem restricted to study the boxes is a variant of the domatic number problem, so it also NP-hard.
We define a heuristic called k-nearest allocation: to assign one sub-stream out of k possible to all boxes, we process all boxes in a random order. For every box x, we determine its k−1 nearest boxes according to the distance function. We note N+(x) the set of boxes N (x)∪{x}. Every box in N+(x) that
is not already allocated should then pick randomly one of the missing sub-streams. Hence, the set N+(x) contains as many
distinct sub-streams as possible, ideally k. Note that the k-nearest allocation is an online algorithm. When a new box joins the system, we just determine its k − 1 nearest boxes, and allocate to this box one of the missing sub-streams. The k-PUFLP requires to recompute the whole assignment.
This algorithm does not provide any guaranteed approxi-mation, but our tests reveals that it works actually well in comparison to exact algorithms. The idea here is to evaluate the gains that can be obtained from a clever sub-stream allocation. Therefore such a heuristic matches our objectives. C. AS-Graph Traffic Model
An AS-level Internet topology is represented by a directed graph G(A, E ): each vertex a ∈ A represents an AS over the Internet. The set E is the set of edges connecting two ASs. Each link in the AS graph represents a transit or peering agreement between two ASs: every AS may be the peering AS of its neighbor, or in the case of transit link, be the customer (or provider) of its adjacent AS. The set of ASs is usually distinguished into three distinct non-overlapping classes :
• tier-1 ASs are the core of the Internet, they only have connections toward peering ASs (other tier-1 ASs) and transit customers. They have no outgoing provider rela-tions as they are at the top level.
• on the opposite, tier-3 ASs are at the “border”, their outgoing edges do not reach customers but only peering and provider ASs.
• tier-2ASs are the rest of ASs, connecting tier-1 and tier-3 ASs.
Using the shortest path to determine the route between two ASs has been shown to not reflect the path that is actually used over the Internet. Some conditions to obtain a distributed and stable routing among ASs are given in [19]. More precisely, some path selection rules should be respected: all routes are classified into customer routes, peer routes and provider routes. Usually, AS prefers customer routes over peer and provider routes. Moreover, the routes should be valley-free. For example, a tier-2 AS can not reach another tier-2 AS via any tier-3 AS.
Each link in E is associated with a cost that depends on the agreement between both ASs. One customer AS pays for traffic transited by its provider, so the transit link has high cost. Two ASs having a peering agreement do not charge each other, peering link has relatively low cost. We note c(e) the cost associated with an edge e ∈ E , so the AS-graph is more precisely defined as G(A, E , c).
D. Levels of Knowledge
As mentioned in Introduction, various levels of knowledge on the AS-graph can be defined. In an ideal one, the video service provider knows not only the graph G and the cost function c, but also the location of clients. Despite it is not realistic, this configuration is interesting because it allows to evaluate the k-PUFLP approximate algorithm. As we will see later, our proposed heuristic performs better than the k-PUFLP algorithm. This opens perspectives for future works.
Determining the k − 1 nearest boxes of a box requires to know the AS-graph G. If we consider a totally blind service provider having no knowledge of the location of boxes or of the AS-graph, the only heuristic that can be implemented is a random one, each box choosing its sub-stream randomly among all sub-streams. This algorithm is what have been proposed in previous works.
Between these two extrema, it is possible to distinguish into two intermediate levels of knowledge. In the first one, the graph G is known but the cost function c is not known. Actually, various maps of AS-level Internet are now available, so a service provider able to determine the AS of every box can easily estimate the closest boxes of a given box by computing the shortest path over this topology. Since only the links among ASs are known by the service provider, the heuristic is thus called topology-aware heuristic.
Finally, the service provider can know the graph G and the cost function c. That is, it is able to compute exactly the cheapest path between two ASs. This can be realistic when the service provider is also a network operator. With this knowledge, the heuristic is called relationship-aware heuristic.
IV. EXPERIMENTALANALYSIS
We conduct extensive simulations to measure the gain that can be obtained by the heuristics. Recall that these heuristics are not optimal, but are expected to provide a good approx-imation of what can be done if the service provider has a certain knowledge level. The goal of this study is to highlight the gain that can be obtained, so it could be included in the design of box-powered CDN. The simulations rely on realistic network topologies, widely adopted parameters and experimentally demonstrated properties. Therefore we expect to provide accurate and meaningful results.
A. Simulation Environment
In our simulation, we use the dataset from CAIDA project [20] (AS relationship 20090105). After all loops are removed, the graph consists of 28, 421 ASs and 115, 244 links. Table I shows some properties of each tier: their size, average number of providers and customers per AS and the total number of intra-tier peering link. These properties are also observed in practice, for example, the high number of customers of Tier-1 AS, the high percentage of peering link in Tier-2, and the small average number of providers in Tier-3. This AS graph is now widely admitted to be representative of the current Internet.
Size #Providers/AS #Customer/AS #Peering
Tier-1 35 0 434.4 42
Tier-2 3995 2.845807 9.553692 2894
Tier-3 24301 1.728406 0.000000 20
TABLE I PARTITION OFAS GRAPH
For the routing, we made a tradeoff between realism and simulation time complexity. We replace the distributed proto-col by a centralized “prioritized” Depth-First Search (p-DFS),
where different branches of the same node are explored with a defined priority, following the aforementioned path selection rules:
1) Links with a Provider-to-Customer relation are explored first, because a provider is in charge of connecting its different customers or sub-customers;
2) Peering links can be used when no more Provider-to-Customer link is available.
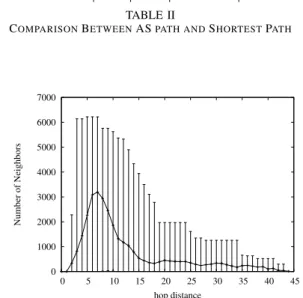
3) Finally, the Customer-to-Provider links can be used. We guarantee the valley-free property of routes among ASs, by checking the link relation of previous hop to determine possible next hops. We first give an overview of the difference between the path discovered by the p-DFS routing and the one computed by a shortest path. We compute the paths between all ASs in the tier-3. Results shown in Table II reveals the that shortest paths routing exhibit too small average path lengths. In comparison to this oversimplified AS routing, the p-DFS algorithm gives acceptable results with conform path length value and noticeable variation. We now provide an illustration of the distances between two ASs in the network. Figure 1 shows the distance distribution among ASs. For each AS, we compute the number of ASs at distance x, y-axis shows the min, average and max number of ASs at distance x. This figure is mostly useful to understand some interpretations given later.
min max average Std Dev
Shortest 1 10 3.907981 0.861664
Prioritized DFS 2 44 11.517826 6.404997
TABLE II
COMPARISONBETWEENASPATH ANDSHORTESTPATH
0 1000 2000 3000 4000 5000 6000 7000 0 5 10 15 20 25 30 35 40 45 Number of Neighbors hop distance
Fig. 1. Distribution of distances among Tier-3 ASs (24301 ASs)
We call peer the system elements (clients and boxes). In our context, all peers are located at tier-3 ASs. Boxes are able to store sub-streams, while clients do not have storage capacity. Both clients and boxes send request for the selected video. To add clients and boxes in the AS graph, we randomly select a number of edge ASs in the tier-3 set obtained in previous partition. Then, we transform them into a small cluster according to [21]: we attach to the selected AS a number of peers following a normal distribution N (µ, 0.2µ)
where µ is an adjustable parameter. Intuitively, a high value for µ means that elements are clustered, which is representative of a VoD service that either is offered to clients of a few ISP, or is a local service, for instance delivering video related with local topics. On the contrary, a low value for µ indicates that elements are spread all over the Internet, so the VoD service is probably a worldwide service. Then we defined pbox, as the percentage of boxes over all peers. It represents
the proportion of participants being able to store video sub-streams. Moreover, µbox = µ × pbox is the average number
of boxes in the same AS. We will show later that µbox is a
crucial indicator.
B. Global Cross-Domain Traffic Reduction
We run a set of simulations for a given configuration where 10, 000 peers are requesting the video, and 30% of them are boxes. This corresponds approximately to the case of a popular video in [4]. We also assume that µ = 100, so µbox is equal
to 30. It is difficult to determine this number µ in simulations, our choice is made after a careful reading of measurements on VoD services given in [22]. The number of sub-streams varies from 4 to 30. For these first runs, we measure the AS path length between the peers and their closest boxes hosting all sub-streams. The motivation is to measure the cross-domain traffic. Figure 2 shows the results.
0 200000 400000 600000 800000 1e+06 1.2e+06 1.4e+06 0 5 10 15 20 25 30 35 40
Global Traffic (Total hop count)
number of substreams 10000 peers, 3000 boxes, mu-box = 30
Random Topology-aware Relationship-aware k-PUFLP
Fig. 2. Total Cross-Domain Traffic
Intuitively, our heuristics guarantee that, for a number of boxes that is less or equal to the number of sub-streams, our heuristics allocate distinct sub-streams to every box within the same AS. On the contrary, a random process is unable to guarantee no redundancy. Actually, this explains in a straightforward manner that the global traffic increases for the random algorithm with a far lesser number of sub-streams. This advocates for a very basic implementation where all boxes within the same AS cooperate to not store the same sub-streams.
More disappointing is the evolution of curves. That is, it seems that all algorithm behaves similarly once the sub-streams can not be found in the AS. It means that a clever algorithm trying to minimize the distance between the AS of
a client and the AS of closest boxes has few impact on the overall cross-domain traffic volume. We will analyze this more carefully later.
Another interesting fact is that the k-PUFLP algorithm behaves exactly similarly as the other heuristics. Besides this confirms the previous point, this shows that the complete knowledge of the system can hardly be exploited, or it would require the design of specific algorithms.
C. Analysis of the Cross-Domain Traffic Reduction
For these second runs, we study the AS-links that are used by the various heuristics. We force the system to generate cross-domain traffic by setting µbox to values less than the
number of sub-streams k. We measure now the cost (defined with distinct values for edges in E regarding their inter-AS relations). We compute the gain of the total cost generated by our heuristics over the cost of a random allocation. Therefore we can quantify the gain for network operators in Fig. 3.
For small values of k, the gain is significant for the reasons we previously emphasized. A random allocation is unable to guarantee that boxes in an AS store distinct sub-streams. Nevertheless, this 60% gain (Fig.2, k = 30) clearly shows the interest of some simple implementations. The gain becomes less substantial when k increases, because, with µbox= 5, the
number of outgoing connections is roughly equivalent. The gain is now around 20%, which is though an impressive gain. When we detail on every class of links, we show that this gain is mostly obtained through the reduction of the peering traffic. This latter result is questioning us, therefore we analyze more carefully the cross-domain link. We analyze every out-going connection for all heuristics, by calculating the aver-age hops per connection (Fig.4). We show that, despite our heuristic are expected to allocate the sub-streams to close ASs, the gain actually obtained is not so significant. With a basic random allocation, a client is able to find subs-streams in relatively close AS. This can be explained by recalling that most distances inter-ASs are around 5 hops (cf Fig.1). Note however that the difference of distance between a random allocation and a clever one increases with the number of sub-streams because the number of boxes by sub-streams increase. The gain reaches 10%. A detailed analysis reveals that this gain is mostly due to peering routes (Fig.4(c)), because the lengths of customer routes are only slightly larger for random allocation. Finally, we study the scalability of content allocation algo-rithms, by varying the population in the system. We set µ to 50, µboxto 10 and k to 16, but the number of peers varies from
5, 000 to 25, 000. Fig.5 shows the global cost ratio of three methods compared to random placement. We observe that the global gain remains stable with various number of peers.
V. SUMMARY ANDCONCLUSION
Long videos encoded into multiple substreams and box-powered CDN are two major trends for the future of video services. An important but less studied problem is how to store these substreams in proxies such that the overall download
cost is minimized when the client has to retrieve a set of sub-streams. We have identified and formulated this problem. Two simple heuristics with different levels of network knowledge were proposed. They have been compared with the existing k-PUFLP and random placement algorithms. Both proposed heuristics demonstrates promising performance gains over the random placement and similar performances as the k-PUFLP. This paper provides a comprehensive study of the impact of content allocation on cross-domain traffic, through simulations using real-world sittings. The simulations first show the impor-tance of intra-AS placement. To reduce cross-domain traffic, the number of distinct substreams should be maximized. Although this conclusion is quite straightforward, a realistic comparison with random placement is made to clearly prove this claim. Then, a more relevant inter-AS placement case, meaning few boxes are present in the same AS, is studied. We have demonstrated that a significant gain over a random allocation can be achieved. The traffic reduction is mainly due to less peering traffic; transit traffic is only slightly decreased. Finally, we have reviewed the scalability of content placement. We have shown that heuristics always advantages over random allocation with an increasing number of peers in the system.
These results demonstrates that clever content allocation can clearly reduce cross-domain traffic. Some insights are given to design efficient placement algorithm. We have proven that box location and AS path is the most important input, and client location and AS relationship do not help to reduce cross domain traffic.
REFERENCES
[1] N. Laoutaris, P. Rodriguez, and L. Massouli´e, “Echos: edge capacity hosting overlays of nano data centers,” Computer Communication Re-view, vol. 38, no. 1, pp. 51–54, 2008.
[2] M. Allen, B. Zhao, and R. Wolski, “Deploying Video-on-Demand Ser-vices on Cable Networks,” in IEEE Int. Conf. on Distributed Computing Systems (ICDCS), 2007.
[3] Y. Boufkhad, F. Mathieu, F. de Montgolfier, D. Perino, and L. Viennot, “Achievable catalog size in peer-to-peer video-on-demand systems,” in Int. Workshop on Peer-To-Peer Systems (IPTPS), 2008.
[4] A. Nafaa, S. Murphy, and L. Murphy, “Analysis of a Large-Scale VOD Architecture for Broadband Operators: A P2P-Based Solution,” IEEE Communications Magazine, December 2008.
[5] K. Suh, C. Diot, J. Kurose, L. Massouli´e, C. Neumann, D. F. Towsley, and M. Varvello, “Push-to-peer video-on-demand system: Design and evaluation,” IEEE Journal on Selected Areas in Communications, vol. 25, no. 9, pp. 1706–1716, 2007.
[6] O. Campana, R. Contiero, and G. Mian, “An H. 264/AVC Video Coder Based on a Multiple Description Scalar Quantizer,” IEEE Transactions on Circuits and Systems for Video Technology, vol. 18, no. 2, pp. 268– 272, 2008.
[7] S. Dykes, K. Robbins, and C. Jeffery, “An empirical evaluation of client-side server selection algorithms,” in IEEE INFOCOM, 2000.
[8] S. Ratnasamy, M. Handley, R. M. Karp, and S. Shenker, “Topologically-aware overlay construction and server selection,” in IEEE INFOCOM, 2002.
[9] J. D. Guyton and M. F. Schwartz, “Locating nearby copies of replicated internet servers,” SIGCOMM Comput. Commun. Rev., vol. 25, no. 4, pp. 288–298, 1995.
[10] J. Almeida, D. Eager, M. Vernon, and S. Wright, “Minimizing delivery cost in scalable streaming content distribution systems,” IEEE Transac-tions on Multimedia, vol. 6, no. 2, pp. 356–365, 2004.
[11] J. Apostolopoulos, T. Wong, W. tian Tan, and S. Wee, “On multiple description streaming with content delivery networks,” in IEEE INFO-COM, 2002.
0 0.2 0.4 0.6 0.8 1 0 10 20 30 40 50 60
Traffic Ratio to Random
number of substreams Topology-aware Relationship-aware k-PUFLP
(a) Aggregated Cost
0 0.2 0.4 0.6 0.8 1 0 10 20 30 40 50 60
Traffic Ratio to Random
number of substreams Topology-aware Relationship-aware k-PUFLP (b) Transit Cost 0 0.2 0.4 0.6 0.8 1 0 10 20 30 40 50 60
Traffic Ratio to Random
number of substreams Topology-aware Relationship-aware k-PUFLP
(c) Peering Cost
Fig. 3. Cost Variation with 10,000 peers, 3000 boxes, µbox= 5
2.5 3 3.5 4 4.5 5 0 10 20 30 40 50 60
Average Links per Connection
number of substreams Random Topology-aware Relationship-aware k-PUFLP
(a) Aggregated Cost
2.2 2.25 2.3 2.35 2.4 2.45 2.5 2.55 0 10 20 30 40 50 60
Transit Links per Connection
number of substreams Random Topology-aware Relationship-aware k-PUFLP (b) Transit Cost 0.4 0.6 0.8 1 1.2 1.4 1.6 1.8 2 2.2 2.4 2.6 0 10 20 30 40 50 60
Peering Links per Connection
number of substreams Random Topology-aware Relationship-aware k-PUFLP (c) Peering Cost
Fig. 4. Cross-AS connection cost with 10,000 peers, 5000 boxes, µbox= 5
0 0.2 0.4 0.6 0.8 1 5000 10000 15000 20000 25000
Traffic Ratio to Random
number of peers Topology-aware Relationship-aware k-PUFLP
(a) Aggregated Cost
0 0.2 0.4 0.6 0.8 1 5000 10000 15000 20000 25000
Traffic Ratio to Random
number of peers Topology-aware Relationship-aware k-PUFLP (b) Transit Cost 0 0.2 0.4 0.6 0.8 1 5000 10000 15000 20000 25000
Traffic Ratio to Random
number of peers Topology-aware Relationship-aware k-PUFLP
(c) Peering Cost
Fig. 5. Comparison with Random Placement (20% boxes, µ = 50, µbox= 10, k = 16)
[12] Y. Shen, Z. Liu, S. Panwar, K. Ross, and Y. Wang, “Streaming layered encoded video using peers,” in IEEE Int. Conf. on Multimedia and Expo (ICME), 2005.
[13] X. Xu, Y. Wang, S. Panwar, and K. Ross, “A peer-to-peer video-on-demand system using multiple description coding and server diversity,” in Int. Conf. on Image Processing (ICIP), 2004.
[14] T. T. Do, K. A. Hua, and M. A. Tantaoui, “Robust video-on-demand streaming in peer-to-peer environments,” Comput. Commun., vol. 31, no. 3, pp. 506–519, 2008.
[15] L. Guo, S. Chen, and X. Zhang, “Design and evaluation of a scalable and reliable p2p assisted proxy for on-demand streaming media delivery,” IEEE Transactions on Knowledge and Data Engineering, vol. 18, no. 5, pp. 669–682, May 2006.
[16] W.-P. Yiu, X. Jin, and S.-H. Chan, “Vmesh: Distributed segment storage for peer-to-peer interactive video streaming,” IEEE Journal on Selected Areas in Communications, vol. 25, no. 9, pp. 1717–1731, Dec. 2007. [17] A. Klose and A. Drexl, “Facility location models for distribution system
design,” European Journal of Operational Research, vol. 162, no. 1, pp. 4–29, 2005.
[18] B. Li and R. Li, “Approximation algorithm for k-PUFLPN,” Computer
Engineering and Applications (in Chinese), vol. 44, no. 1, pp. 97–99, 2008.
[19] L. Gao and J. Rexford, “Stable internet routing without global coordi-nation,” IEEE/ACM Transactions on Networking (TON), vol. 9, no. 6, pp. 681–692, 2001.
[20] [Online]. Available: www.caida.org
[21] B. Yang and H. Garcia-Molina, “Designing a super-peer network,” in Int. Conf. on Data Engineering (ICDE), 2003.
[22] M. Cha, H. Kwak, P. Rodriguez, Y. Ahn, and S. Moon, “I tube, you tube, everybody tubes: analyzing the world’s largest user generated content video system,” in Proc. of ACM SIGCOMM conference on Internet