OATAO is an open access repository that collects the work of Toulouse
researchers and makes it freely available over the web where possible
Any correspondence concerning this service should be sent
to the repository administrator:
[email protected]
This is an author’s version published in:
http://oatao.univ-toulouse.fr/25139
To cite this version:
Chervin, Justine
and Perio, Pierre and Martins-Froment, Nathalie
and
Pharkeovilay, Chiobouaphong and Reybier, Karine and Nepveu, Françoise and
Fabre, Nicolas and Talou, Thierry
and Bonzon-Ponnet, Valérie and Marti,
Guillaume Dereplication of natural products from complex extracts by
regression analysis and molecular networking: case study of redox-active
compounds from Viola alba subsp. dehnhardtii. (2017) Metabolomics, 13 (8).
ISSN 1573-3890
DOI 10.1007/s11306-017-1227-6
Dereplication of natural products from complex extracts
by regression analysis and molecular networking: case study
of redox-active compounds from Viola alba subsp. dehnhardtii
Justine Chervin1,2,4 · Pierre Perio1 · Nathalie Martins-Froment3 ·Chiobouaphong Pharkeovilay1 · Karine Reybier1 · Françoise Nepveu1 ·
Nicolas Fabre1 · Thierry Talou2 · Valérie Bonzon-Ponnet4 · Guillaume Marti1
(LC–HRMS) profiles. In parallel, redox active properties were evaluated by the capacity of the molecules to reduce 2,2-diphenyl-1-picrylhydrazyl (DPPH·) and superoxide
(O2·−) radicals using UV–Vis and electron spin resonance
spectroscopies (ESR), respectively. A spectral similarity network (molecular networking) was used to highlight clus-ters involved in the observed redox activities.
Results Dereplication on Viola alba subsp. dehnhardtii
highlighted a reproducible pool of redox active molecules. Polyphenols, particularly O-glycosylated coumarins and
C-glycosylated flavonoids, were identified and de novo
dereplicated through molecular networking. Confirmatory analyses were undertaken by thin layer chromatography (TLC)–DPPH–MS assays and nuclear magnetic resonance (NMR) spectra of the most active compounds.
Conclusion Our dereplication strategy allowed the
screening of leaf extracts to highlight new biologically active metabolites in few steps with a limited amount of crude material and reduced time-consuming manipulations.
Abstract
Introduction In natural product research, bioassay-guided
fractionation was previously widely employed but is now judged to be inadequate in terms of time and cost, particu-larly if only known compounds are ultimately isolated. The development of metabolomics, along with improvements in analytical tools, allows comprehensive metabolite profiling. This enables dereplication to target unknown active com-pounds early in the purification workflow.
Objectives Starting from an ethanolic extract of violet
leaves, this study aims to predict redox active compounds within a complex matrix through an untargeted metabo-lomics approach and correlation analysis.
Methods Rapid fractionation of crude extracts was
car-ried out followed by multivariate data analysis (MVA) of liquid chromatography–high resolution mass spectrometry
Electronic supplementary material The online version of this
article (doi:10.1007/s11306-017-1227-6) contains supplementary material, which is available to authorized users.
* Guillaume Marti [email protected] Justine Chervin [email protected] Pierre Perio [email protected] Nathalie Martins-Froment [email protected] Chiobouaphong Pharkeovilay [email protected] Karine Reybier [email protected] Françoise Nepveu [email protected] Nicolas Fabre [email protected] Thierry Talou [email protected] Valérie Bonzon-Ponnet [email protected]
1 UMR 152 Pharmadev, Université de Toulouse, IRD, UPS,
Toulouse, France
2 Laboratoire de Chimie Agro-industrielle, Université de
Toulouse, INRA, INPT, Toulouse, France
3 Service commun de spectrométrie de masse, Université de
Toulouse, ICT, UPS, Toulouse, France
This approach could be applied to any kind of natural extract for the study of various biological activities.
Keywords Dereplication · Metabolomics · Molecular
networking · Natural products · Redox active properties · UHPLC–HRMS
1 Introduction
In natural product research, identification and characterisa-tion of bioactive compounds from crude extracts remains challenging. To identify active molecules, conventional treatments include extraction, bio-guided fractionation, isolation, and characterisation steps. However, these pro-cedures are time consuming as the composition of natural extracts can be complex. There is also a risk of redundant results, such as isolating known compounds or loss of bio-activity during manipulations (Ayouni et al. 2016). Holis-tic methods such as metabolomics can enhance the classi-cal reductionist workflow based on iterative bioassays and paralleled fractionation to reach active compounds. This approach, referred to as untargeted metabolite profiling, and subsequent statistical analysis was revealed as a valu-able tool in natural product research (Cox et al. 2014).
Ultra-high performance liquid chromatography–high resolution mass spectrometry (UHPLC–HRMS) has been used to study complex mixtures, taking advantage of sen-sitive detection and high chromatographic and mass reso-lutions. This approach consists of the pre-identification of known compounds in a single analytical run, which is of particular interest in the dereplication process (Wolfender et al. 2015). As a preliminary step, chemical compound databases are interrogated based on accurate mass of all detected features (m/z-retention time (RT) pairs), which produces molecular formula hits. However, several possi-bilities may be obtained, mainly due to isobaric matches. Therefore, additional filters are needed to rank database hits, such as cross-research with chemotaxonomic data or tandem mass spectrometry (MS/MS) fragmentation pat-terns. Indeed, development of in silico tools to mirror pre-dicted fragmentation behaviour with experimental data limits the number of matches for a given feature (Xiao et al. 2012; Kind and Fiehn 2016). Additionally, a mass spectral similarity network (e.g., molecular networking) was developed to help interpret LC–MS/MS spectra (Yang et al. 2013; Grapov et al. 2015), complementing this derep-lication strategy with the propagation of assigned peaks (Allard et al. 2016).
MS/MS-based dereplication or de novo identification strategies are necessary to target active compounds early in the purification process as untargeted metabolite profiling methods generate tens to thousands of variables, depending
of the analytical workflow (Wolfender et al. 2010). Multi-variate data analysis (MVA) is commonly used to exploit the variable space in order to rank the features most involved in sample separation. Orthogonal partial least square (OPLS) regression models enable the prediction of features involved in a given activity for each sample (Wor-ley and Powers 2013; Bylesjö et al. 2006).
Violets contain various natural products with diverse biological activities (Muhammad et al. 2012). These include anti-inflammatory, antimicrobial (Witkowska-Banaszczak et al. 2005) and, predominantly, antioxidant activity (Vukics et al. 2008). Previous work describes over 200 compounds in this genus, mainly flavonoids, terpe-noids and phenylpropaterpe-noids (Zhu et al. 2015). However, only 30 of the 500 species were studied. Thus, a potential supply of new biologically active compounds remains to be discovered, particularly non-volatile metabolites. Many interesting activities are related to the redox active func-tions of the molecules. Monitoring the ability to reduce free radicals by a single electron reaction is straightforward and automatable in vitro (López-Alarcón and Denicola 2013). This makes it possible to identify reducing agents (also known as antioxidants), which are useful in liquid or soft medium as preservatives. In vivo, the antioxidant character of a compound is not predominantly linked to its ability to scavenge free radicals due to kinetic constraints. The redox property of the molecule, in its reversibility, is involved. It is the oxidised form that paradoxically activates the Nrf2 (NF-E2-related factor 2) signalling pathway and allows the expression of antioxidant enzymes and proteins (Forman et al. 2014). Thus evaluating in vitro reductants is the first step in identifying new structures capable of having active oxidised forms in vivo. The aim of this work was to iden-tify metabolite clusters most probably involved in reduction reactions starting from a complex extract of leaves of violet of Toulouse (Viola alba subsp. Dehnhardtii, Violaceae).
2 Materials and methods
2.1 Plant material
In spring 2016, seven distinct flowerpots of violet of Tou-louse (Viola alba subsp. dehnhardtii) were collected from the Toulouse Municipal Greenhouses, France. Samples were washed before separation of flowers, aerial parts and roots. To stabilise the vegetable matter, each plant part was lyophilised and ground into powder.
2.2 Leaf extraction
Metabolites were extracted by adding 10 volumes of 80% ethanol (EtOH) to the powdered leaf (10.0 ± 0.2 g). The
solutions were then sonicated in a bath (Fisher Scientific) at room temperature for 30 min and filtered. This proce-dure was repeated once with fresh solvent. Each extract was evaporated under reduced pressure (Buchi rotavapor R-114) and 100 mg of the crude extracts were finally suspended in 1 mL of methanol prior to solid phase extraction (SPE) (1 g Sep-Pak® C
18 cartridge, Waters, Milford, MA, USA).
Rapid fractionation was achieved using five aqueous metha-nolic solutions of increasing organic solvent concentrations (F1: 95/5 H2O/MeOH; F2: 75/25; F3: 50/50; F4: 25/75; F5:
0/100). The five collected fractions of each extract were dried under reduced pressure. One part was put aside for redox properties analysis and the other part was dissolved to 1 mg/mL for UHPLC–HRMS analysis.
2.3 Redox properties assay
The reductive properties of the crude extracts and their respective fractions were firstly evaluated by the DPPH radical scavenging assay (Nguyen et al. 2013). Each sam-ple was analysed in triplicate and five concentrations were tested in order to graphically determine the half maxi-mal inhibitory concentration (IC50). Trolox (Fluka, purity
>98%) and rutoside (Sigma, purity >94%) were used as positive controls. Secondly, the capacity of the molecules to reduce the superoxide radical (O2·−) was analysed by
electron spin resonance (ESR) (Hubert et al. 2008). Ruto-side was employed as a positive control. The results were analysed with WinEPR software (v. 2.11b, Bruker): a base-line correction was firstly done before second order integra-tion of the signal.
2.4 UHPLC–HRMS profiling
All extracts were profiled using a UHPLC–DAD–LTQ Orbitrap XL instrument (Ultimate 3000, Thermo Fisher Scientific, Hemel Hempstead, UK). The UV detection was performed by a diode array detector (DAD) from 210 to 400 nm. Mass detection was performed using an electro-spray source in positive ionisation (PI) and negative ionisa-tion (NI) modes at 15,000 resolving power (full width at half maximum (FWHM) at 400 m/z). The mass scanning range was m/z 100–1500 Da. The capillary temperature was 300 °C and ISpray voltage was fixed at 4.2 kV (posi-tive mode) and 3.0 kV (nega(posi-tive mode). Mass measure-ment was externally calibrated before starting the experi-ment. Each full MS scan was followed by data dependant MS/MS on the three most intense peaks using stepped collision-induced dissociation (CID) (35% normalised col-lision energy, isolation width 2 Da, activation Q 0.250). The LC–MS system was run in binary gradient mode using a BEH C18 Acquity column (100 × 2.1 mm i.d., 1.7 µm, Waters, MA, USA) equipped with a guard column. Mobile
phase A (MPA) was 0.1% formic acid (FA) in water and mobile phase B (MPB) was 0.1% FA in acetonitrile. Gradi-ent conditions were: 0 min, 95% MPA; 0.5 min 95% MPA; 12 min, 5% MPA; 15 min, 5% MPA, 15.5 min, 95% MPA; 19 min, 95% MPA. The flow rate was 0.3 mL/min, column temperature 40 °C and injection volume was 2 µL.
2.5 Data processing
The UHPLC–HRMS raw data were converted to abf files (Reifycs Abf Converter) and processed with MS-DIAL ver-sion 2.54 (Tsugawa et al. 2015) for mass signal extraction between 100 and 1500 Da from 0 to 12.5 min. Respective MS1 and MS2 tolerance were set to 0.01 and 0.4 Da in cen-troid mode. The optimised detection threshold was set to 2 × 10⁴ for MS1 and 10 for MS2. Adducts and complexes
were identified to exclude them from the final peak list. Finally, the peaks were aligned on a quality control (QC) reference file with a retention time tolerance of 0.1 min and a mass tolerance of 0.025 Da. The resulting peak list was then exported to comma-separated value (CSV) format prior to MVA using SIMCA-P+ (version 14.0, Umerics, Umea, Sweden).
2.6 Statistical analysis
Comma-separated value files were directly imported into SIMCA-P+ (version 14.0, Umerics, Umea, Sweden). For MVA, all data were log transformed and pareto scaled. The OPLS regression analysis was done with DPPH IC50 values
as Y input. Coefficient scores were used to rank variables according to their reductive potential. For each model, a leave-one-subject-out cross-validation was performed to assess the model fit. The validity of the discriminant model was verified using permutation tests (Y-scrambling).
2.7 Identification of significant features
Molecular formulae of significant features were calcu-lated with MS-FINDER 2.10 (Tsugawa et al. 2016). Vari-ous parameters were used in order to reduce the number of potential candidates, such as the element selection exclu-sively including C, H, O; mass tolerance fixed to 10 ppm and the isotopic ratio tolerance set to 20%. Only natural product databases focused on plants were selected from Universal Natural Products Database (UNPD), KNAp-SAc, PlantCyc, Dictionary of Natural Products (DNP, CRC press, v25:2) and CheBI. The results were presented as a list of compounds sorted according to the score value of the match. This value encompassed uncertainty on accurate mass, the isotopic pattern score and the experimental MS/ MS fragmentation mirrored to in silico matches. Chemical classes were retained for identified features with a score
above 5 and only structures with a score above 7 were retained for thorough analysis.
2.8 Mass spectral similarity network
The text file format exported from MS-DIAL was cleaned-up by eliminating the identified adducts before importing into MetamapR (version 1.4.0) (Grapov et al. 2015). A mass spectral similarity network was created with a maxi-mum of ten connections between nodes, a cut off fi xed at 0.3 and a retention time filter at 1.5 m in. The calcu-lated edge list was then downloaded and processed with Cytoscape 2.8.3 (Shannon et al. 2003). An attribute file containing all processed information, in particular m/z val-ues, OPLS coefficients and ch emical classes of identified features was imported to improve network visualisation.
2.9 Validation of the model by TLC–DPPH–MS
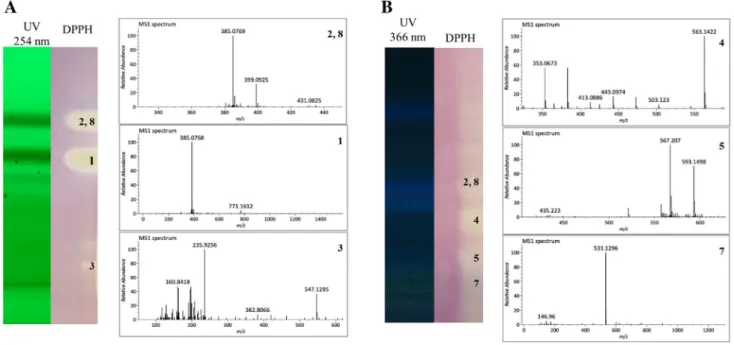
A TLC method was developed to confirm the statistical results. TLC separation was undertaken for fractions F2 and F3 with respective migration solvent composition: ethyl acetate, formic acid, acetic acid, water (50:5.5:5.5:13.5) and ethyl acetate, formic acid, water (60:6.5:6.5). 675 µL of a 10 mg/mL solution was deposed in band of 180 mm in a 20 cm TLC plate. The plate was then placed in an oven at 70 °C for 15 min and then observed under UV at 254 nm for F2 and 366 nm for F3. A small part of the plate was revealed with a purple DPPH solution at 600 mol/L. Then, yellow active spots were collected on the non-treated sur-face with the use of a TLC–MS intersur-face (Camag, Muttenz, Switzerland) and directly injected into the LTQ-Orbitrap instrument.
2.10 Purification of compounds of interest
Purification of active compounds was undertaken start-ing from 200 mg of F2. LC–UV separation was performed using a XBridge™ C18 prep column (4.6 × 150 mm i.d.,
5 µm, Waters, MA, USA) on an HPLC-DAD–QTOF-MS instrument (HPLC Alliance 2695- QTof Premier, Waters, MA, USA). Mobile phase A (MPA) was 0.1% formic acid (FA) in water and mobile phase B (MPB) was 0.1% FA in acetonitrile. The linear gradient program was as follows: 0 min, 95% MPA; 15 min 75% MPA; 16 min, 50% MPA; 18 min, 50% MPA, 18.5 min, 95% MPA; 23.5 min, 95% MPA. The flow rate was 20 mL/min and injection volume was 250 µL. For all analyses, detection was performed by UV at 325 and 254 nm and collection was automatically done by filling 30% of the tube. Samples were kept at ambi-ent temperature during the whole analysis.
All collected fractions were dried using a Speed-vac (SpeedVac plus, Thermo Savant™) and dissolved in
DMSO-d6 for NMR analysis (Bruker cryo 500 MHz, Ger-many) (see Supplementary Table S1).
3 Results
3.1 Radical scavenging properties in vitro
Redox properties of extracts were evaluated by studying their ability to scavenge 2,2-diphenyl-1-picrylhydrazyl (DPPH·) radical. The analyses were first carried out on
ethanolic extracts of flowers, leaves, and roots. The results showed that roots presented weak radical scavenging activ-ity, with an IC50 of 1525 ± 122 mg/L. Flowers and leaves
had greater activity, with IC50 values of 475 ± 15 and
467 ± 14 mg/L, respectively (see Supplementary Data S1). Leaves were chosen for further investigations as flowers are more fragile and less abundant.
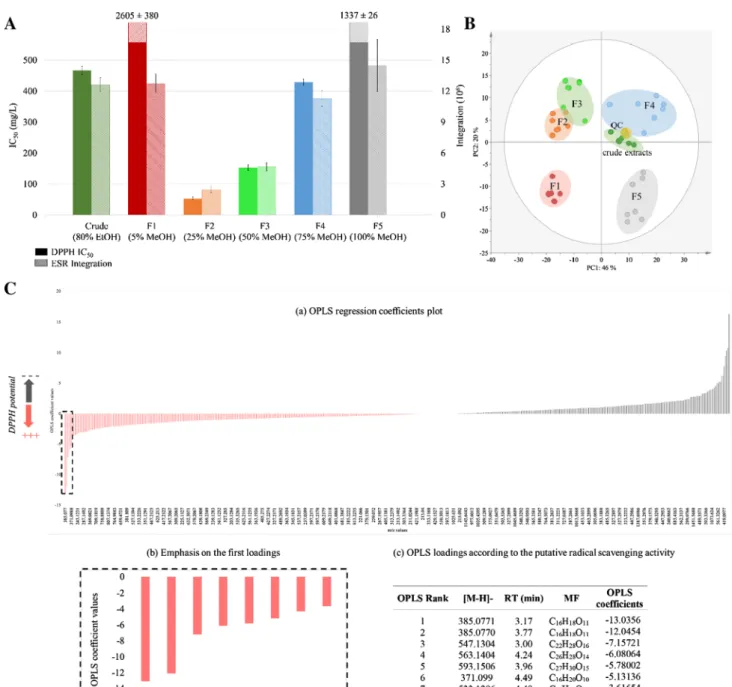
Radical scavenging activity was measured for the crude ethanolic leaf extracts of seven individual plants of violet of Toulouse and respective fractions (N = 42) of decreasing polarity (F1–F5) (Fig. 1A; plain bar plots). While the seven crude extracts displayed an IC50 value of 467 ± 14 mg/L,
high IC50 values were obtained for SPE fractions F1 and F5 (2605 ± 380 and 1337 ± 26 mg/L, respectively) demon-strating weak radical scavenging activity in vitro in these cases. Significant activities were measured for fractions F2, F3 and F4, with IC50 values of 53 ± 5, 153 ± 9 and 429 ± 10 mg/L, respectively. For comparison, the positive controls Trolox and rutoside possess IC50 values of
approx-imately 7 and 14 mg/L, respectively. Therefore, fractions F2 and F3 seemed promising for the discovery of antioxi-dant compounds in vitro as preservatives.
To confirm these results, ESR experiments were con-ducted to measure the capacity of extracts (final concen-tration of 50 mg/L) to trap superoxide radical (O2·−). The
corresponding values of the ESR signal double integrations are presented in Fig. 1A (striped bar plots). As for DPPH assay, F2 and F3 appeared to have the most redox poten-tial as demonstrated by the low intensity of the remaining signal.
3.2 UHPLC–HRMS-based metabolomics approach
UHPLC–HRMS profiles of all the 46 extracts (7 crude extracts, 35 SPE fractions, and 6 QC samples prepared by pooling an aliquot of all fractions) afforded 434 and 527 features (m/z-RT pairs) in NI and PI modes, respectively.
The C18-SPE procedure is clearly effective at resolving the extracts according to polarity, with polar fractions 1–3 eluting early (<6 min in our UHPLC conditions) and frac-tions 4 and 5, containing apolar compounds, eluting at later retention times (see Supplementary Data S2).
As a preliminary step, principal component analysis (PCA) was applied as an exploratory data analysis to provide an unsupervised overview of the LC–MS fin-gerprints. PCA clustered all independent biological rep-licates from the same fraction. Thus, one fraction was related to one position on the plot with slight variabil-ity highlighting a reproducible response. As expected,
PCA grouped crude extracts and QC near the plot cen-tre. By contrast, single fractions were well distributed (Fig. 1B). These results indicated that SPE fractiona-tion and LC–MS workflows highlighted variability in the data set, and were highly reproducible. Moreover, it demonstrated a stable chemical composition within aerial parts of the seven independent plants under study.
Fig. 1 MVA workflow: A comparison of radical scavenging
proper-ties of leaf crude extracts and respective fractions of violet of Tou-louse obtained by C18-SPE using DPPH assays (plain bar plots) and
ESR (striped bar plots). B PCA score plot of the ESI–NI dataset
(QC: quality controls, F1–F5 denote respective C18-SPE fractions). C
(a) Coefficient plot obtained by OPLS regression; (b) emphasis of the first loadings; (c) ranking of the first seven loadings estimated as radi-cal scavenger compounds according to the OPLS regression
After PCA, we applied OPLS regression analysis to obtain a classification of the loadings (i.e. m/z-RT pairs) regarding the DPPH IC50 value (input Y). The quality of
model prediction was good (R2Y = 0.977, Q2Y = 0.952) and a permutation test assessed its validity (see Supple-mentary Data S3). This supervised method allowed the ranking of potential redox-active compounds accord-ing to their regression coefficient values (Fig. 1C(a, b)): negative coefficients were correlated to potential redox-active compounds and positive coefficients to less-redox-active redox compounds. From the list containing the first hits (Fig. 1C(c)), we carried out the identification procedure based on their MS/MS spectra.
3.3 Identification of potential radical scavenger compounds based on in silico fragmentation
Using the OPLS regression analysis results, the top eight compounds were tentatively identified b y i nterrogat-ing local natural product databases integrated in MS-FINDER: PlantCyc, UNPD, KNApSAcK and ChEBI (Table 1, Hit NP databases). For each compound, the results afforded s everal c andidates a nd r anked t hem according to their similarity score, which was based on comparison between experimental MS/MS frag-ments and in silico spectra of candidates. Interestingly, for compounds 1, 2, 3, 6 and 8, the top three candidates ranked by MS-FINDER each contained a coumarin core, and for compounds 4, 5 and 7, each contained a flavonoid derivative. UV spectra of each peak (Table 1; UV λmax) supported our assumptions. The coumarin
nucleus displays two absorption bands near 270 and 310 nm. Substitutions on this nucleus tend to produce a bathochromic shift (Masrani et al. 1974). For the flavo-noids, two absorption bands of interest are around 250 to 295 and 310 to 370 nm, depending on the flavonoid class and the substitution pattern (Olsen et al. 2009). There-fore, the higher wavelength band gives differentiation between coumarins and flavonoids. Still, the candidates were numerous and not always relevant, e.g., compound
5 had hundreds of candidates and feruloyl derivatives
were proposed for compound 1. To refine t he r esults, we carried out a second identification s tep b y c reating a user-defined d atabase r estricting r esults o f U NPD t o compounds found in Viola genus (Table 1, Hit UNPD-Viola). Thus, fewer and more pertinent candidates could be proposed. In our case, this led to the identification of compounds 4, 5 and 7 as flavonoids, indicating that all the other significant features have never been described in Viola genus. Moreover, compounds 3 and 8 remained totally unknown as no hit matched with any database.
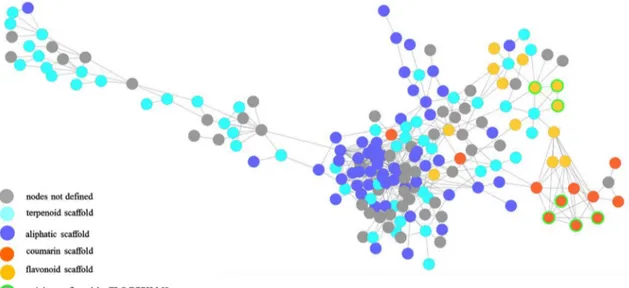
3.4 Extending the dereplication process via a mass spectral similarity network
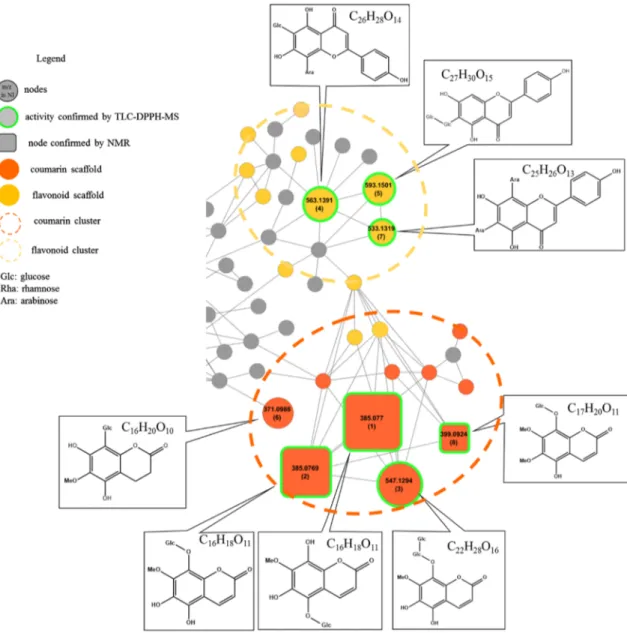
The mass spectral similarity network displayed two clusters of radical scavenger compounds, i.e., antioxidants (Fig. 2). Each cluster was closely related to one SPE fraction: according to our previous identification results, flavonoids were mainly found in F3 while coumarins were mainly found in F2.
The flavonoid cluster displayed three compounds with related structures active in reducing DPPH· (Fig. 3).
Com-pounds 4 and 5 presented a statistically significant radical scavenging potential according to their coefficient score (Table 1; OPLS coefficient). Interestingly, the molecu-lar formulae of the compounds from this cluster matched structures already identified in Violaceae. Experimen-tal MS/MS patterns mirrored to in silico fragmentation allowed the preliminary identification of schaftoside (4), isovitexin 6″-O-β-d-glucopyranoside (5) and 6,8-di-C-α-l-arabinopyranosylapigenin (7) (see Supplementary Data
S4). These structures were based on a user-defined Viola database, as hits were more pertinent and the final candi-date had the highest total score, generally above 7.
The other compounds of interest belonged to the cou-marin cluster (Fig. 3). Compounds 3 and 8 were connected with the identified glycosylated coumarins C16H18O11 (compound 2), confirmed by 1D and 2D NMR (see Sup-plementary Data S5). Thus, we applied a de novo derepli-cation based on the interpretation of mass loss to propose potential chemical structures. We interpreted a difference of 162 Da between 3 and 2 as a glucose substituent. We suggest a new 8-O-diglycosylated coumarin structure for 3, based on the MS/MS spectrum and the loss of a 324.12 Da, correlated to two linked glucose units (see Supplementary Data S4). Regarding 8, a difference of 14 Da was indicative of a di-methoxy-8-O-glycosylated coumarin.
Compound 6 was tentatively identified as an 8-C-glycol-sylated coumarin from comparison with in silico fragmen-tation data using MS-FINDER local databases.
3.5 Validation of the model
To validate our OPLS model, we used a TLC–DPPH–MS assay for fractions F2 (Fig. 4a) and F3 (Fig. 4b). Overall, the four coumarins (1, 2, 3 and 8) and the three flavonoids (4, 5 and 7) were identified and matched with the OPLS ranking.
We then tested purified compounds 1 and 2 for their respective scavenging activities against DPPH (plain bar plots) and superoxide radicals (striped bar plots) (Fig. 5). Trolox and rutoside were used as references for both assays. The difference in radical scavenging capacity of Trolox against DPPH and superoxide radicals can be easily
Table 1 Summar y of all der eplicated com pounds *R
anking based on OPL
S r
eg
ression coefficients, ser
ved as com
pound number
**Hits f
ound when inter
rog
ating natur
al pr
oduct dat
abases (UNPD, KnapSac
k, CheBI, and PlantCy
c) in MS-FINDER
***Hits f
ound when inter
rog
ating t
he user
-defined dat
abase (UNPD and DNP) com
posed of kno wn com pounds in Viola g enus a Confir med b y NMR b Top r ank ed hit de ter mined b y in silico MS/MS fr agment ation wit h MS-FINDER c Der eplicated wit h molecular ne tw or king Rank* RT (min) [M–H] −
Molecular formula
Er
ror
(mDa)
Hit NP data- bases** Hit UNPD Viola
*** Main MS/MS fragments UV λ max (nm) Po tential id a,b,c MSI le vel Chemical class Biological sour ce OPL S coef-ficient TL C-DPPH assa y Ref. 1 3.17 385.0771 C16 H18 O11 0.4349 2 0 206.9150 222.0869 370.1008 260 326 7-Me tho xy -5,6,8-dih ydr oxy coumar in-5-β-glucop yr anoside a,b 1 Coumar in Te traphis pellucida −13.03 De tected Jung e t al. ( 1995 ) 2 3.77 385.0770 C16 H18 O11 0.7349 2 0 207.9790 223.1457 370.1048 258 325 7-Me tho xy -5,6,8-trih ydr oxy coumar in-8-β-glucop yr anoside a,b 1 Coumar in Te traphis pellucida −12.04 De tected Jung e t al. ( 1995 ) 3 3.00 547.1304 C22 H28 O16 1.1584 0 0 208.0135 223.0087 385.1274 268 320 7,8-dime tho xy -5,6,8-trih ydr oxy coumar in-8-β glucop yr anosy l-g lucop yr a-noside c 2 Coumar in – −7.15 De tected – 4 4.24 563.1404 C26 H28 O14 0.5291 88 3 353.0987 383.2114 443.1452 473.0864 271 333 Sc haf toside b 2 Fla vonoid Numer ous plants −6.08 De tected Chen Xie e t al. ( 2003 ) 5 3.96 593.1501 C27 H30 O15 1.2938 154 2 353.0222 383.19O3 473.0770 503.1120 272 332 Iso vite xin 6 ″- O-β-d glucop yr anoside b 2 Fla vonoid Viola tr icolor −5.78 De tected Vukics e t al. ( 2008 ) 6 4.49 371.099 C16 H20 O10 0.5704 11 8 120.976 231.124 248.972 265 320 8-C-Glucosy l-3,4-dih ydr o-5,7-dih ydr oxy -6-me tho xy -coumar in b 2 Coumar in Dicer at ella ellip tica −5.13 No t de tected Mar zouk e t al. ( 2012 ) 7 4.48 533.1296 C25 H26 O13 0.8644 25 1 353.1044 383.2066 443.1201 473.1409 271 331 6,8-Di- C-α-l -ar abinop yr anosy lapig enin b 2 Fla vonoid Viola y edoen-sis −3.61 De tected Xie e t al. ( 2003 ) 8 3.81 399.0922 C17 H20 O11 0.2850 3 0 207.0253 221.9839 237.0366 270 320 7,8-Dime tho xy -5,6,8-trih ydr oxy coumar in-8-β-glucop yr anoside a,c 1 Coumar in – −0.02 De tected –
explained by considering the rate constants of the scaveng-ing reactions: kTrolox/DPPH = 1.1 × 10⁴ M−1 s−1 (Friaa and
Brault 2006) and kTrolox∕O⋅−
2 = 0.1 M
−1s−1 (Cabelli and
Bielski 1986).
The radical scavenging properties of compound 1 (97% pure) were confirmed by comparison with the active con-trols, Trolox (DPPH IC50: 1 9 ± 2 mg/L vs. Trolox 7 mg/L), and rutoside (ESR double integration: 1 0.88 ± 0.01 vs. rutoside 1.78 ± 0.10).
For compound 2 (90% pure), the DPPH IC50 of
49 ± 1 mg/L and ESR double integration of 15 ± 1, suggests this compound is a less active radical scavenger than com-pound 1, meeting the statistical ranking.
4 Discussion
The objective of this work was to characterise redox active metabolites from the leaves of Viola alba subsp.
dehn-hardtii together with de novo dereplication of active
com-pounds and the establishment of a non-volatile metabolite fingerprint.
In order to decipher the redox potential in few steps, we correlated DPPH results to UHPLC–HRMS fingerprints by OPLS regression. This method allowed the ranking of detected features according to their potential radical scav-enging properties. In addition, a mass spectral similarity network allowed de novo dereplication of top ranked fea-tures, based on the acquisition of UHPLC–HRMS profiles in data dependent analysis mode. This provided accurate mass-to-charge ratio for molecular formula determination along with MS/MS fragments used for peak assignments.
NI mode MS and MS/MS spectra were mainly used as they were of better quality than PI spectra, thus improving in
silico identification using MS-FINDER. Processing with
MS-DIAL allowed the acquisition of a clean peak list with deconvoluted MS/MS data for each feature. This meant we could easily remove adducts and other ionisation arte-facts from files uploaded to MetamapR. This resulted in a cleaner molecular network compared with uploading raw data files. The mass spectral similarity network allowed the organisation of features in clusters and dereplication results highlighted mainly coumarins in SPE fraction F2 and mainly flavonoids in fraction F3. These scaffolds are known for having several biological activities, including redox activity (Procházková et al. 2011; Gacche and Jad-hav 2012). We identified a mixture of C-glycosylated fla-vonoids along with O-glycosylated coumarins. The enrich-ment of these molecules in the two fractions explains the improved antioxidant properties of the fractions over the crude extracts. Although some of the compounds, e.g., compounds 5 and 7, are well-known in Viola genus (Vukics et al. 2008; Xie et al. 2003), the other compounds we iden-tified have not previously been described in this genus.
The protective effect of phenolic coumarins against oxi-dative damage depends on the hydrogen-donating capacity of hydroxyl groups (Kostova 2006; Borges et al. 2005) and then on their oxidisability. Previous structure–activity rela-tionship studies have identified the importance of the num-ber and location of the phenolic hydroxyl groups (Kancheva et al. 2010). As compounds 1 and 2 have the same sub-stituents, energy minimisation calculations were carried out using the MM2 forcefield (Chemdraw 3D, Cambridge Soft, USA) to understand the difference between their radi-cal reducing capacity. These radi-calculations demonstrate that
the hydroxyl group in position 6 in compound 1 was the most readily oxidisable into OH·+ and thus responsible for
the strong antioxidant capacity measured for 1 compared with 2. Purification of coumarins C16H18O111 and 2 tested
in DPPH and ESR redox assays confirmed the workflow used in this study: as predicted by the model, compound 1 appeared as a reducer that is a good antioxidant compound in vitro.
Our statistical analysis was validated by TLC–DPPH–MS assays, with detection of seven DPPH-active compounds ranked in top positions of the analysis. A big advantage of our approach is the limited manipulation steps (crude extraction followed by a single SPE fractiona-tion) and low sample demand. For instance, 1 g of dried
plant material should be sufficient to conduct the entire workflow. The workflow could easily be implemented to any kind of extract with other biological activities. How-ever, ranking results of variables may not accurately reflect the biological activity. Ranked positions may vary depend-ing on scaldepend-ing and normalisation processes. The first 20 ranked variables should be considered for thorough analy-sis. Another drawback of this method concerns the correla-tion between biological assay results (Y) and the deteccorrela-tion method used to generate variables (X). In our case, we only took into account ionisable compounds in electrospray ioni-sation (ESI) mode for OPLS modelling. The ioniioni-sation pro-cess is compound dependent and does not reflect a quan-titative measure of each detected feature. We could reach
Fig. 3 Expansion on the redox-active compounds clusters. Putative
coumarin and flavonoids scaffold correspond to top ranked hits from MS-FINDER. Node size was emphased based on OPLS coefficient
value. Compound number is indicated in brackets in each node in cor-respondence to Table 1
more realistic models by using universal-type detectors such as Evaporating Light Scattering Detector (ELSD) or Charged Aerosol Detector (CAD). While 1H- or 13C-NMR
could be an interesting alternative, the lack of sensitivity of this method is not compatible with complex samples like crude natural extracts.
Finally, the framework of our dereplication strategy cap-italised on UHPLC–HRMS–MS/MS profiles, using agree-ment between modelled and experiagree-mental MS/MS frag-mentation patterns and mass spectral similarity network to propagate assignments of clustered features. As illustrated with the coumarin cluster, using the molecular network and propagating from a known compound allows identification of others belonging to the same class by interpreting the neutral mass loss.
5 Conclusion
A UHPLC–HRMS based metabolomic study combined with molecular networking tools allowed the dereplica-tion of redox-active metabolites present in the violet of Toulouse. These compounds were mainly flavonoid and coumarin derivatives. Our approach highlighted two main metabolite clusters displaying functional groups with redox-active properties. We identified seven compounds of interest, of which five were found through MS/MS fragmentation and comparison with references found in databases. Two unknown coumarins were de novo derep-licated through a molecular networking approach. Over-all, the workflow proposed here allowed early identifica-tion of redox active compounds within a complex mixture with limited effort and crude materials.
In this work, it was chosen to correlate redox-active properties with LC–MS profiles to identify compounds of interest but more generally, provided variability is brought to the data set, this method can be implemented in any study of other chemical and biological properties employing different types of assays.
Acknowledgements The authors would like to thank the Regional
Council Midi-Pyrénées for sponsoring this project (Project CLE 13053062) as well as the Toulouse Municipal Greenhouses for mak-ing the violet collection available to its collaborators.
Funding This study was funded by the Regional Council
Midi-Pyrénées (Project CLE 13053062).
Fig. 4 DPPH TLC–MS dereplication of redox active compounds of F2 (a) and F3 (b)
Fig. 5 Capacity of purified compounds 1 and 2 to scavenge free
Author contributions GM proposed the study and designed the
experiments. JC performed the extraction of crude material, the radi-cal scavenging assays under the supervision of PP, processed the LC-HRMS profiles acquired by NMF and performed MVA and molecular networking analysis under the supervision of GM. JC analysed the results and wrote the manuscript which was reviewed by all the col-laborators of the work.
Compliance with ethical standards
Conflict of interest The authors declare that they have no conflict
of interest.
Research involving human participants and/or animals No
human participants or animals were involved in this study.
Informed consent No human participants were involved in this
study.
References
Allard, P.-M., Péresse, T., Bisson, J., Gindro, K., Marcourt, L., Pham, V. C., et al. (2016). Integration of molecular networking and
in-silico MS/MS fragmentation for natural products
dereplica-tion. Analytical Chemistry, 88(6), 3317–3323. doi:10.1021/acs. analchem.5b04804.
Ayouni, K., Berboucha-Rahmani, M., Kim, H. K., Atmani, D., Ver-poorte, R., & Choi, Y. H. (2016). Metabolomic tool to iden-tify antioxidant compounds of Fraxinus angustifolia leaf and stem bark extracts. Industrial Crops and Products, 88, 65–77. doi:10.1016/j.indcrop.2016.01.001.
Borges, F., Roleira, F., Milhazes, N., Santana, L., & Uriarte, E. (2005). Simple coumarins and analogues in medicinal chemistry: Occurrence, synthesis and biological activity. Current Medicinal
Chemistry, 12(8), 887–916.
Bylesjö, M., Rantalainen, M., Cloarec, O., Nicholson, J. K., Holmes, E., & Trygg, J. (2006). OPLS discriminant analysis: Combining the strengths of PLS-DA and SIMCA classification. Journal of
Chemometrics, 20(8-10), 341–351.
Cabelli, D. E., & Bielski, B. H. (1986). Studies of the reactivity of trolox with Mn3+/Fe3+ complexes by pulse radiolysis. Journal of
Free Radicals in Biology & Medicine, 2(1), 71–75.
Cox, D. G., Oh, J., Keasling, A., Colson, K. L., & Hamann, M. T. (2014). The utility of metabolomics in natural product and bio-marker characterization. Biochimica et Biophysica Acta
(BBA)-General Subjects, 1840(12), 3460–3474.
Forman, H. J., Davies, K. J., & Ursini, F. (2014). How do nutritional antioxidants really work: Nucleophilic tone and para-hormesis versus free radical scavenging in vivo. Free Radical Biology and
Medicine, 66, 24–35.
Friaa, O., & Brault, D. (2006). Kinetics of the reaction between the antioxidant Trolox® and the free radical DPPH in semi-aqueous
solution. Organic & Biomolecular Chemistry, 4(12), 2417–2423. Gacche, R. N., & Jadhav, S. G. (2012). Antioxidant activities and
cytotoxicity of selected coumarin derivatives: Preliminary results of a structure–activity relationship study using computa-tional tools. Journal of Experimental & Clinical Medicine, 4(3), 165–169.
Grapov, D., Wanichthanarak, K., & Fiehn, O. (2015). MetaMapR: Pathway independent metabolomic network analysis incorpo-rating unknowns. Bioinformatics. doi:10.1093/bioinformatics/ btv194.
Hubert, J., Berger, M., Nepveu, F., Paul, F., & Daydé, J. (2008). Effects of fermentation on the phytochemical composition and antioxidant properties of soy germ. Food Chemistry, 109(4), 709–721.
Jung, M., Geiger, H., & Zinsmeister, H. D. (1995). Tri-and tetrahy-droxycoumarin derivatives from Tetraphis pellucida.
Phyto-chemistry, 39(2), 379–381.
Kancheva, V. D., Saso, L., Boranova, P. V., Khan, A., Saroj, M. K., Pandey, M. K., et al. (2010). Structure–activity relationship of dihydroxy-4-methylcoumarins as powerful antioxidants: Cor-relation between experimental & theoretical data and synergis-tic effect. Biochimie, 92(9), 1089–1100.
Kind, T., & Fiehn, O. (2016). Strategies for dereplication of natural compounds using high-resolution tandem mass spectrometry.
Phytochemistry Letters. doi:10.1016/j.phytol.2016.11.006. Kostova, I. (2006). Synthetic and natural coumarins as antioxidants.
Mini Reviews in Medicinal Chemistry, 6(4), 365–374.
López-Alarcón, C., & Denicola, A. (2013). Evaluating the antioxi-dant capacity of natural products: A review on chemical and cellular-based assays. Analytica Chimica Acta, 763, 1–10. Marzouk, M. M., Elkhateeb, A., Ibrahim, L. F., Hussein, S. R., &
Kawashty, S. A. (2012). Two Cytotoxic Coumarin Glycosides from the aerial parts of Diceratella elliptica (DC.) Jonsell growing in Egypt. Records of Natural Products, 6(3), 237. Masrani, K., Rama, H., & Bafna, S. (1974). Ultraviolet absorption
spectra: Some substituted coumarins. Journal of Chemical
Technology and Biotechnology, 24(6), 331–341.
Muhammad, N., Saeed, M., Aleem, A., & Khan, H. (2012). Eth-nomedicinal, phytochemical and pharmacological profile of genus Viola. Phytopharmacol, 3(1), 214–226.
Nguyen, H. Y. T., Vo, B. H. T., Nguyen, L. T. H., Bernad, J., Alaed-dine, M., Coste, A., et al. (2013). Extracts of Crinum latifolium inhibit the cell viability of mouse lymph oma cell line EL4 and induce activation of anti-tumour activity of macrophages in vitro. Journal of Ethnopharmacology, 149(1), 75–83. Olsen, H., Aaby, K., & Borge, G. I. A. (2009). Characterization
and quantification of flavonoids and hydroxycinnamic acids in curly kale (Brassica oleracea L. convar. acephala var. sabel-lica) by HPLC DADESI-MS. Journal of Agricultural and Food
Chemistry, 57(7), 2816–2825.
Procházková, D., Boušová, I., & Wilhelmová, N. (2011). Anti-oxidant and proAnti-oxidant properties of flavonoids. Fitoterapia,
82(4), 513–523.
Shannon, P., Markiel, A., Ozier, O., Baliga, N. S., Wang, J. T., Ramage, D., et al. (2003). Cytoscape: a software environment for integrated models of biomolecular interaction networks.
Genome Research, 13(11), 2498–2504.
Tsugawa, H., Cajka, T., Kind, T., Ma, Y., Higgins, B., Ikeda, K., et al. (2015). MS-DIAL: Data-independent MS/MS deconvolu-tion for comprehensive metabolome analysis. Nature Methods. doi:10.1038/nmeth.3393.
Tsugawa, H., Kind, T., Nakabayashi, R., Yukihira, D., Tanaka, W., Cajka, T., et al. (2016). Hydrogen rearrangement rules: Computational MS/MS fragmentation and structure eluci-dation using MS-FINDER software. Analytical Chemistry. doi:10.1021/acs.analchem.6b00770.
Vukics, V., Kery, A., Bonn, G. K., & Guttman, A. (2008). Major fla-vonoid components of heartsease (Viola tricolor L.) and their antioxidant activities. Analytical and Bioanalytical Chemistry,
390(7), 1917–1925.
Vukics, V., Ringer, T., Kery, A., Bonn, G. K., & Guttman, A. (2008). Analysis of heartsease (Viola tricolor L.) flavonoid glycosides by micro-liquid chromatography coupled to mul-tistage mass spectrometry. Journal of Chromatography A,
Witkowska-Banaszczak, E., Bylka, W., Matławska, I., Goślińska, O., & Muszyński, Z. (2005). Antimicrobial activity of Viola tricolor herb. Fitoterapia, 76(5), 458–461.
Wolfender, J. L., Marti, G., & Ferreira Queiroz, E. (2010). Advances in techniques for profiling crude extracts and for the rapid iden-tificationof natural products: Dereplication, quality control and metabolomics. Current Organic Chemistry, 14, 1808–1832. Wolfender, J.-L., Marti, G., Thomas, A., & Bertrand, S. (2015).
Cur-rent approaches and challenges for the metabolite profiling of complex natural extracts. Journal of Chromatography A, 1382, 136–164. doi:10.1016/j.chroma.2014.10.091.
Worley, B., & Powers, R. (2013). Multivariate analysis in metabo-lomics. Current Metabolomics, 1(1), 92–107.
Xiao, J. F., Zhou, B., & Ressom, H. W. (2012). Metabolite identifica-tion and quantitaidentifica-tion in LC-MS/MS-based metabolomics. TrAC
Trends in Analytical Chemistry, 32, 1–14.
Xie, C., Veitch, N. C., Houghton, P. J., & Simmonds, M. S. (2003). Flavone C-glycosides from Viola yedoensis Makino. Chemical
and Pharmaceutical Bulletin, 51(10), 1204–1207.
Yang, J. Y., Sanchez, L. M., Rath, C. M., Liu, X., Boudreau, P. D., Bruns, N., et al. (2013). Molecular networking as a dereplication strategy. Journal of Natural Products, 76(9), 1686–1699. Zhu, H., Qin, S., Zhang, N., Yang, D., Han, H., Wei, K., & Li, M.
(2015). Chemical constituents and biological activities of plants from the genus Viola. Chemistry & Biodiversity, 12(12), 1777–1808.
1 of 20
2 of 20
3 of 20
S3 Permutation plot of OPLS correlation model between DPPH activity and LC-HRMS dataset.
S4 Comparison of experimental and in silico MS/MS spectra of compounds of interest.
a) 7-Methoxy-5,6,8-trihydroxycoumarin-5-β-glucopyranoside(compounds 1 and 2)
4 of 20
c) Schaftoside (compound 4)
d) Isovitexin 6''-O-beta-D-glucopyranoside (compound 5)
5 of 20
f) 6,8-Di-C-α-L-arabinopyranosylapigenin (compound 7)
S5 NMR data of purified compounds
Proton NMR spectra of the four compounds contained common characteristic signals, revealing a coumarin core. The pair of doublets near δH 6 and δH 8 ppm with a coupling constant of 9.6 Hz are characteristic of the protons H3 and H4 of a coumarin (Wu et al. 1989).
The 1H NMR spectrum of 1 showed one methoxy group at δH 3.78 (s, 3H) which correlated with the 13C NMR signal at δC 60.65 ; a O-β-linked glucose with an anomeric proton at δH 4.72 (d, J = 7.56 Hz, 1H) and the other characteristic features of a glucose at δH 3.29 (dd, 7.59 and 8.97 Hz, 1H); δH 3.23 (m, 1H); δH 3.16 (dd, 7.97 and 10.09 Hz, 1H); δH 3.05 (ddd, 2.07, 5.42 and 9.36 Hz, 1H) and the characteristic AB system for CH2-6’ at δH 3.41 (dd, 5.46 and 11.67 Hz, 1H) and δH 3.59 (dd, 2.11 and 11.88 Hz, 1H). These chemical shifts correlated to δC 105.03, 73.98, 76.39, 69.77, 77.21 and 60.82 in the HSQC spectrum, respectively. HMBC and NOESY allowed the determination of the substitutions with no visible correlation between the glucose and the methoxy group. Hence 1 was confirmed to be a dihydroxy-methoxy-5-O-glycosylated coumarin.
The 1H NMR spectrum of 2 revealed similar signals to 1 assigned to a methoxy at δH 3.68 (s, 3H) and δC 60.25 as well as a glucose substituent with an anomeric proton at δH 4.63 (d, 7.75 Hz, 1H) ppm. No aromatic proton was observed suggesting the presence of 2 hydroxy groups on the coumarin core. The difference of chemical shift for C8 between 1 and
2 confirmed a dihydroxy-methoxy-8-O-glycosylated coumarin for 2.
The 1H NMR spectrum of compound 8 revealed the presence of two methoxy groups with signals at δH3.79 (s, 3H) and δH3.81 (s, 3H) ppm and a O-linked glucose moiety characterised by the signal of an anomeric proton at δH4.8 (d, J = 7.67 Hz, 1H) ppm. Unfortunately, we were unable to assign the other glucose signals due to poor resolution in the 3 to 4 ppm region. Thus, 1 was identified to be a hydroxy-dimethoxy-O-glycosylated coumarin.
6 of 20
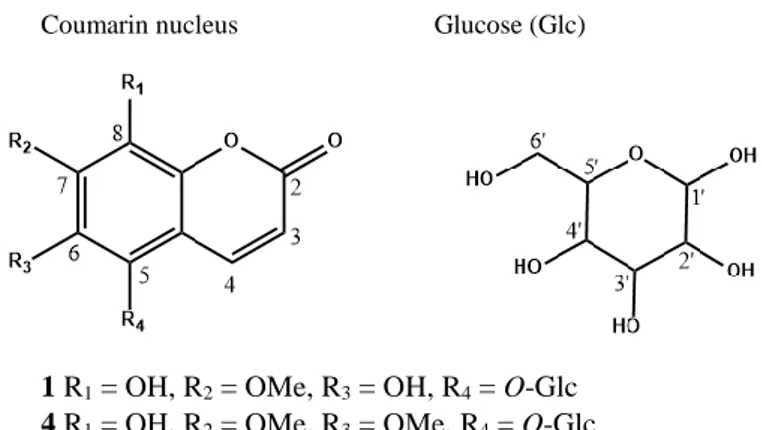
Coumarin nucleus Glucose (Glc)
1 R1 = OH, R2 = OMe, R3 = OH, R4 = O-Glc
4 R1 = OH, R2 = OMe, R3 = OMe, R4 = O-Glc
5 R1 = O-Glc, R2 = OMe, R3 = OH, R4 = OH
Table S1 Assigned 1H and 13C chemical shifts in ppm (500 MHz, DMSO-d6) and multiplicity with coupling constants in
Hz (in parentheses) for compounds 1, 2 and 8.
Compound 1 2 8 Position DEPT δH δC δH δC δH δC Aglycone 2 CO - 160.53 - 160.44 - 159.91 3 CH 6.10 d (9.63) 110.01 6.01 d (9.53) 108.34 6.20 d (9.72) 111.22 4 CH 8.16 d (9.63) 141.02 7.98 d (9.58) 139.84 8.17 d (9.69) 140.77 5 C - 138.29 - 143.60 - - 6 CH3 3.78 s 60.65 3.70 s 60.25 3.79 s 56.42 7 C/CH3 - 138.19 - 132.40 3.81 s 56.05 8 C - 130.44 - 125.89 - - 9 C - 139.63 144.15 - - 10 C - 110.01 100.25 - - Glucose 1’ CH 4.72 d (7.56) 105.03 4.63 d (7.75) 105.74 4.8 d (7.67) 104.39 2’ CH 3.29 dd (7.59, 8.97) 73.98 3.31 m 73.89 - 3’ CH 3.23 m 76.39 3.24 m 76.29 - 4’ CH 3.16 dd (7.97, 10.09) 69.77 3.18 m 69.64 - 5’ CH 3.05 ddd (2.07, 5.42, 9.36) 77.21 3.05 m 77.21 - 6’ a CH 3.41 dd (5.46, 11.67) 60.82 3.49 dd (4.94, 11.67) 61.23 - 6’ b CH 3.59 dd (2.11, 11.88) 60.82 3.63 dd (1.8, 11.68) 61.23 -