DOI 10.1007/s00382-014-2383-2
Evaluation of daily precipitation statistics and monsoon
onset/retreat over western Sahel in multiple data sets
Emilia Paula Diaconescu · Philippe Gachon ·John Scinocca · René Laprise
Received: 28 April 2014 / Accepted: 14 October 2014 / Published online: 29 October 2014 © The Author(s) 2014. This article is published with open access at Springerlink.com
number of its physics modules with the limited-area ver-sion of GEM forecast model. The evaluation is focused on various daily precipitation statistics (maximum number of consecutive wet days, number of moderate and very heavy precipitation events, precipitation frequency distribution) and on the monsoon onset and retreat over the Sahel region. We find that the CRCM5 has a good representation of daily precipitation statistics over the southern Sahel, with spa-tial distributions close to GPCP dataset. Some differences are observed in the northern part of the Sahel, where the model is characterised by a dry bias. CanRCM4 and the ERA-Interim and MERRA reanalysis products overesti-mate the number of wet days over Sahel with a shift in the frequency distribution toward smaller daily precipitation amounts than in observations. Both RCMs and reanalyses have difficulties in reproducing the local onset date over the Sahel region. Nevertheless, the large-scale features of the monsoon precipitation evolution over West Africa are well reproduced by the RCMs, whereas the northern limit of the rainy bands is less accurately reproduced. Both RCMs exhibit an overall good representation of the local retreat index over the Sahel region.
Keywords Daily-precipitation indices · CORDEX experiment · RCM evaluation · West African monsoon 1 Introduction
In the past several years, extreme weather and climate events such as extreme daily temperatures and rain-fall amounts, regional heatwaves, and hurricanes have received increased attention due to their significant impact on natural environments and human activities, and the fact that they are projected to occur with increased frequency Abstract The West Africa rainfall regime constitutes
a considerable challenge for Regional Climate Models (RCMs) due to the complexity of dynamical and physi-cal processes that characterise the West African Monsoon. In this paper, daily precipitation statistics are evaluated from the contributions to the AFRICA-CORDEX experi-ment from two ERA-Interim driven Canadian RCMs: CanRCM4, developed at the Canadian Centre for Climate Modelling and Analysis (CCCma) and CRCM5, developed at the University of Québec at Montréal. These modelled precipitation statistics are evaluated against three gridded observed datasets—the Global Precipitation Climatology Project (GPCP), the Tropical Rainfall Measuring Mission (TRMM), and the Africa Rainfall Climatology (ARC2)— and four reanalysis products (ECMWF ERA-Interim, NCEP/DOE Reanalysis II, NASA MERRA and NOAA-CIRES Twentieth Century Reanalysis). The two RCMs share the same dynamics from the Environment Canada GEM forecast model, but have two different physics’ pack-ages: CanRCM4 obtains its physics from CCCma’s global atmospheric model (CanAM4), while CRCM5 shares a E. P. Diaconescu (*) · P. Gachon
Canadian Centre for Climate Modelling and Analysis (CCCma), Environment Canada, Place Bonaventure, Portail Nord-Est, 800 rue de la Gauchetière Ouest, Bureau 7810, Montréal, QC H5A 1L9, Canada
e-mail: [email protected] P. Gachon · R. Laprise
Centre pour l’étude et la simulation du climat à l’échelle régionale (ESCER), Université du Québec à Montréal, Montréal, QC, Canada
J. Scinocca
Canadian Centre for Climate Modelling and Analysis (CCCma), Environment Canada, Victoria, BC, Canada
(IPCC SREX 2012). In order to facilitate the analysis of such extreme events, projects such as the STAtistical and Regional dynamical Downscaling of EXtremes for Euro-pean regions (STARDEX; Haylock and Goodess 2004) and the Expert Team on Climate Change Detection and Indices (ETCCDI; e.g. Klein Tank et al. 2009; Zhang et al. 2011; Sillmann et al. 2013a) have defined a set of climate indices that provide a good mixture of daily sta-tistics to assess changes in temperature and precipitation regimes in terms of duration, intensity and occurrence. For the daily-precipitation indices, three categories can be defined:
1. Mean and strong intensity indices that focus on fixed or relative thresholds, which describe features in the mean and highest precipitation amount per day, such as:
• The “simple daily intensity” index, SDII, defined as the mean precipitation amount on wet days, defined as days with precipitation ≥1 mm/day.
• The “precipitation due to heavy, very heavy and extreme precipitation days” indices, R90pTOT, R95pTOT and R99pTOT, which are defined as the percentage of total precipitation due to days with precipitation exceeding the 90th, 95th and 99th per-centiles of the climatological distribution for wet-day amounts.
2. Occurrence indices that refer to counts of days when the amount of daily precipitation exceeds a specified fix threshold, such as:
• The “number of wet days” index, R1mm, which is defined as the number of days with precipitation ≥1 mm/day.
• The “Xmm precipitation days” indices, RXmm, which are defined as the number of days with pre-cipitation ≥X mm/day, where X is usually a local value that delineates heavy (or very heavy) daily pre-cipitation (for example, in extratropical regions, the R10mm is used as heavy intensity index and R20mm is used as very heavy intensity index).
3. Duration indices that assess periods of persistence or maximum duration in wet/dry day sequences, such as: • The “consecutive wet days” index, CWD, defined as
the maximum number of consecutive days with pre-cipitation ≥1 mm/day,
• The “consecutive dry days” index, CDD, defined as the maximum number of consecutive days with <1 mm/day.
These daily-precipitation indices have been used widely to analyse extremes in observations (e.g., Frich et al. 2002; Alexander et al. 2006; Costa and Soares 2009; Donat et al.
2013), in historical simulations and climate-change projec-tions (e.g., Alexander and Arblaster 2009; DeAngelis et al.
2013; Sillmann et al. 2013a, b) and in Regional Climate Models (RCMs) simulations (e.g., Gao et al. 2002; Im et al.
2011; Sylla et al. 2012; Roy et al. 2012). The occurrence and duration indices are typically used in impact stud-ies where fixed thresholds are related to local extremes, while percentile indices are generally employed in climate-change detection studies because they permit to compare changes in the same parts of the precipitation distribution over large regions (Costa and Soares 2009). However, only relatively little work can be found in the literature related to daily precipitation extremes in RCMs over Sahel because of the limited availability of daily-precipitation observa-tions with suitable spatial resolution over this region. For example, Sylla et al. (2012) have analysed daily precipita-tion indices over the whole African continent, and found that the simulated statistics from the RegCM3 RCM are mostly within the relatively wide range (of uncertainties) of the three observed datasets used as reference.
Sahel is a semiarid region of Africa extending between 12°N and 20°N, from Senegal in the west toward Sudan in the east. The region is most vulnerable to changes in pre-cipitation frequency and intensity because its economy and food supply depend strongly on local non-irrigated agricul-ture, which in turn strongly depends on the rainy season. This area is characterised by large spatial–temporal rainfall variability (Sylla et al. 2010). The beginning and the end of the rainy season in West Africa is associated with the seasonal migration of the Inter-Tropical Convergence Zone (ITCZ). During May and June, the ITCZ remains quasi-sta-tionary around 5°N (corresponding to the first of two rainy seasons during each year for the Guinean Coast region), followed by an abrupt northward shift at the end of June and a stabilisation at around 10°N during July and whole month of August. During September, the ITCZ is retreating gradually toward the south, bringing the second rainy sea-son over Guinean region and the ending of the Sahel rainy season (Sultan et al. 2003, 2005).
A substantial number of studies can be found in lit-erature focusing on the mechanisms that can explain the geographical distribution of the African seasonal-mean rainfall and its inter-annual variability. For example the African Multidisciplinary Monsoon Analysis pro-ject (AMMA; Redelsperger et al. 2006) was designed to address the evaluation of climate and weather forecast models with respect to the West Africa Monsoon (WAM) system and the understanding of its physical mechanisms. Other projects have also focussed the WAM area such as the AMMA Model Intercomparison Project (AMMA-MIP;
Hourdin et al. 2010), the AMMA land-surface Model Intercomparison Project (ALMIP; Boone et al. 2009), the AMMA “Couplage de l’Atmosphère Tropicale et du Cycle Hydrologique” (AMMA-CATCH) project (Lebel et al. 2009). Other projects on African climate evaluation are the WAM Modelling and Evaluation (WAMME) pro-ject (Xue et al. 2010; Druyan et al. 2010), the Ensembles-based Predictions of Climate Change and their Impacts (ENSEMBLES) African project (Paeth et al. 2011) and the COordinated Regional climate Downscaling EXperiment over AFRICA (AFRICA-CORDEX; Giorgi et al. 2009;
http://wcrp-cordex.ipsl.jussieu.fr). Despite the large num-ber of studies, there is still a limited understanding of the interactions between local and remote processes, and the interactions across weather and climate time scales, which makes the WAM simulation a challenging task for both Global Climate Models (GCMs) and RCMs. The results show a wide spread in the models skill over the WAM region (see Chapter 9 of IPCC 2013). Some models fail to adequately simulate important dynamical features such as the upper-troposphere Tropical Easterly Jet (TEJ) and the mid-troposphere African Easterly Jet (AEJ), resulting in an improper latitudinal location of the rainfall band, leading to important precipitation biases in the Sahel region (e.g., Druyan et al. 2010; Nikulin et al. 2012; Hernández-Díaz et al. 2012; Roehrig et al. 2013; Rowell 2013). Sylla et al. (2010) showed that the intra-seasonal fluctuations in the position of the monsoon rain belt are strongly affected by the AEJ core, and its north–south displacement during the monsoon season, as a more equatorial position of the AEJ favours dry conditions over Sahel.
The start of the rainy season in Sahel determines the optimal planting time there, as the stage of germination and of growth of plants requires water availability (Sultan et al. 2005; Marteau et al. 2011; Vellinga et al. 2013). Very heavy rainfall events can cause floods, while the occur-rence or persistence of dry spells during the rainy season can cause severe droughts, having a huge impact on crops and therefore on the food supply. Sultan et al. (2005), citing Ingram et al. (2002), mention that the most important rain-fall parameters for agriculture in West Africa are the tim-ing of the onset, the end of the rainy season, as well as the rainfall distribution and water deficits within the rainy sea-son. It is therefore important to evaluate the performance of climate models in representing not only key aspects of the mean seasonal precipitation, as do in the majority of papers found in literature, but also in simulating the higher-order statistics of daily precipitation, such as the frequency distri-bution and the occurrence, duration and intensity of daily-precipitation amounts.
The primary objective of this study is to evaluate the daily-precipitation statistics and the monsoon onset/retreat as simulated by two Canadian RCMs, the CanRCM4 from
the Canadian Centre for Climate Modelling and Analysis (CCCma) and the CRCM5 from University of Québec at Montréal (UQAM). The simulations evaluated here came from the evaluation experiment of the AFRICA-COR-DEX project, which was designed to evaluate RCMs’ runs over the past two decades (1989–2008) over a predefined domain covering the whole African continent, using com-mon horizontal grid spacing, experimental protocol and output format. For this period, the two RCMs are driven by the European Centre for Medium-range Weather Fore-casting (ECMWF) ERA-Interim reanalyses (Uppala et al.
2008; Dee et al. 2011).
Our evaluation work is made prior to the application of the simulations in health and agriculture impact stud-ies within the FACE project (“Faire-face Aux Change-ments Ensemble”; see http://face.ete.inrs.ca/) from the International Research Initiative on Adaptation to Climate Change (IRIACC), in which both Environment Canada (EC) and UQAM collaborate with various institutions in Niger (ACMAD, AGRHYMET and CERMES). One of the FACE project’s goals is to support the adaptation of vulner-able populations in Niger to climate variability and change. Therefore, although the RCM simulations are realised over the whole African domain, the main focus here is over the WAM area, especially over the western Sahel (15°W–15°E and 12°N–20°N; see Fig. 1).
First, we address the RCM evaluation for daily precipi-tation indices highlighting also the challenge associated
Fig. 1 AFRICA-CORDEX domain, with the West-Africa (blue color) and West-Sahel (red color) sub-regions used in the analysis. The red dashed lines within the West-Sahel area marks the 14° and 17° latitudes used to separate Sahel into the southern, central and northern regions
with the evaluation in data-sparse regions where the only practical products are given by gridded observations from satellite estimates. We will also analyze the spatial–tempo-ral daily-precipitation frequency distribution. Second, we evaluate the RCMs performance in simulating the monsoon onset/retreat over West Africa.
The paper is organized as follows. The subsequent sec-tion (Sect. 2) presents the description of the two RCMs, the reanalyses and the sets of gridded observations used for models evaluation, along with the study area and the meth-ods. Section 3 shows the results about the rainfall seasonal mean climatology (Sect. 3.1), the daily-precipitation indi-ces and frequency distributions over Sahel (Sect. 3.2), and the monsoon onset/retreat (Sect. 3.3). A summary and con-clusions are provided in Sect. 4.
2 Data, study area and methods
Under the AFRICA-CORDEX evaluation project (Giorgi et al. 2009; Nikulin et al. 2012), modeling groups are invited to provide simulations at 0.44° and 0.22° horizon-tal meshes, integrated over the entire African continent, and covering the past two decades (1989–2008) driven by the ERA-Interim reanalysis products. Three RCM simulations are used here, i.e. two runs at 0.44° and one run at 0.22°, using the two recently developed Canadian RCMs pre-sented in the following sub-section.
2.1 Model characteristics
The CanRCM4 model, developed by the Canadian Centre for Climate Modelling and Analysis division of the Climate Research Branch of Environment Canada (CCCma/EC;
http://www.ec.gc.ca/ccmac-cccma/), and the CRCM5 (Hernández-Díaz et al. 2012), developed by the Centre pour l’Étude et la Simulation du Climat à l’Échelle Région-ale (ESCER Centre) at the UQAM (http://www.escer. uqam.ca/), are the two Canadian RCMs used in this study. These two models share the same dynamics from the Envi-ronment Canada GEM enviEnvi-ronmental multiscale forecast model (Côté et al. 1998a, b), but use different packages of physical parameterizations. Their main characteristics and physical parameterizations are presented in Table 1 and will be briefly described in the following.
CRCM5 shares several physics modules with the lim-ited-area numerical weather prediction model GEM (Yang et al. 2012; Mailhot et al. 2010). It uses however the inter-active Flake lakes module (Martynov et al. 2010, 2012) and the land surface scheme CLASS 3.5 (Verseghy 2000,
2008). The CRCM5 simulation analysed here was the object of a first analysis presented in Hernández-Díaz et al. (2012) over Africa, which focussed on the mean seasonal
climatology and diurnal and annual cycles. For this simu-lation, the CLASS scheme was using three layers with depths of 0.10, 0.25 and 3.75 m and the standard CLASS distributions of sand and clay fields as well as the bare soil albedo values were replaced by data from the ECOCLI-MAP database (Masson et al. 2003). The subgrid-scale processes parameterisations include the Kain and Fritsch (1990) deep-convection scheme, the Kuo-transient scheme for shallow convection (Kuo 1965; Bélair et al. 2005), the Correlated-K Distribution method for solar and terrestrial radiations (Li and Barker 2005), a subgrid-scale moun-tain gravity-wave drag (McFarlane 1987). The model also uses a low-level orographic blocking (Zadra et al. 2003), a turbulent kinetic energy closure in the planetary bound-ary layer and vertical diffusion (Benoit et al. 1989; Delage and Girard 1992; Delage 1997). Aerosols are not yet imple-mented in this version of the model and the model uses the Sundqvist scheme for large-scale condensation (Sundqvist et al. 1989). CRCM5 is a one-way nested model with a ten grid-point nesting zone, inspired by the work of Davies (1976) and adapted by Robert and Yakimiw (1986) and Yakimiw and Robert (1990). An option also exists for weakly nudging the large scales within the interior of the domain, but this option was not activated for the simula-tion analysed here. The simulasimula-tion was initialised on Janu-ary 1984 with climatology soil moisture and temperature. The atmospheric lateral boundary conditions came from the ECMWF gridded reanalyses ERA-40 for the spin-up period (1984–1988) and ERA-Interim for the main COR-DEX study period (1989–2008), while the sea surface tem-peratures (SSTs) are provided by AMIP2 (Fiorino 1997) for the spin-up period, and by ERA-Interim for the 1989–2008 period. More details concerning the current version of the model can be found in Hernández-Díaz et al. (2012) and Laprise et al. (2013).
The CanRCM4 constitutes a limited-area version of the fourth-generation Canadian Atmospheric global cli-mate Model, CanAM4 (von Salzen et al. 2013). CanRCM4 uses the same parameterizations as CanAM4, including CLASS 2.7 land-surface scheme with soil profile divided into three horizontal layers, of thicknesses 0.10, 0.25 and 3.75 m. The deep-convection scheme is based on the cumu-lus parameterization of Zhang and McFarlane (1995), while the effects of shallow convection are parameter-ized following von Salzen and McFarlane (2002), and von Salzen et al. (2005). The absorption by gases in the atmos-phere is parameterized using the Correlated-k Distribu-tion method (Li and Barker 2005) while the Monte Carlo Independent Column Approximation (McICA; Barker et al. 2008; Pincus et al. 2003) is used for radiative trans-fers. The model is also using an anisotropic orographic low-level drag (Scinocca and McFarlane 2000), and the surface exchanges of heat, moisture, and momentum (the
Table
1
CCCma CRCM4 and UQAM CRCM5 configuration for the
AFRICA-CORDEX simulations analysed in this paper
Model characteristics CRCM5 CanRCM4 Number of le vels 32 Le vels, top ≈ 1 hP a 56 Le vels, top ≈ 10 hP a Horizontal resolution 0.44°
One simulation at 0.44° and one simulation at 0.22°
Radiation scheme
Correlated-k Distrib
ution (CKD) method (Li and Bark
er
2005
)
Correlated-k Distrib
ution (CKD) method (Li and Bark
er
2005
) and the Monte
Carlo Independent Column
Approximation (McICA; Bark
er et al. 2008 ; Pincus et al. 2003 )
Boundary layer scheme
T
urb
ulent kinetic ener
gy (TKE) (Benoit et
al.
1989
; Delage and Girard
1992
; Delage
1997
), with v
ertical mixing suppressed at Richardson
number v
alues >7/60
Based on b
ulk Richardson number
, with moist non-local thermodynamic
mixing (Abdella and McF
arlane 1997 ; v on Salzen et al. 2013 ) Orographic gra vity w av e drag Upper -le
vel drag due to breaking of mountain w
av
es, based on the
local Froude number (McF
arlane
1987
)
Anisotropic orographic lo
w-le
vel drag (Scinocca and McF
arlane 2000 ) Aerosol scheme No aerosol implemented Prognostic b
ulk aerosol scheme (v
on Salzen et al. 2013 ) Grid-scale microph ysics Lar
ge-scale condensation from Sundqvist et
al. (
1989
)
Microph
ysical processes for dif
ferent types of inor
ganic and or ganic aerosol as described in v on Salzen and McF arlane ( 2002 ) Deep con vection Based on con vecti
ve inhibition and release of con
vecti
ve a
vailable
potential ener
gy as described in Kain and Fritsch (
1990
,
1993
)
Cumulus parameterization of Zhang and McF
arlane ( 1995 ) Shallo w con vection K uo-type closure (K uo 1965 ; Bélair et al. 2005 ) Parameterized follo wing v on Salzen and McF arlane ( 2002 ) and v on Salzen et al. ( 2005 ) Land-surf ace scheme CLASS 3.5 land-surf
ace scheme (with three layers of thicknesses
0.10, 0.25 and 3.75
m)
CLASS 2.7 land-surf
ace scheme (with three layers of thicknesses 0.10, 0.25
and 3.75
m)
Land use
ECOCLIMAP database (Masson et
al.
2003
)
Global land co
ver 2000 database (GLC2000) from Joint Research Centre
(Bartholomé and Bel
w
ard
2005
)
Soil initialization
Simulation started January 1988 with climatology soil moisture and temperature
Simulation started January 1984 with climatology soil moisture and tempera
-ture
Interior nudging of lar
ge scale
None
Applied to spatial scales lar
ger than 1,000
km, with a relaxation time of 24
h
Lateral Boundary conditions for CORDEX period of analysis
Horizontal winds, specific humidity
, temperature and geopotential
height from ERA-Interim re-analysis
All ph
ysical prognostic v
ariables from the parent global model CanAM4 that
w
as nudged to
w
boundary layer scheme) follow the treatment of Abdella and McFarlane (1997). The land-use data are from Global Land Cover 2000 database (European Commission, Joint Research Centre 2003, http://bioval.jrc.ec.europa.eu/ products/glc2000/glc2000.php; Bartholomé and Belward
2005). The model uses a prognostic bulk aerosol scheme (von Salzen et al. 2013) and microphysics processes for dif-ferent types of inorganic and organic aerosol as described in von Salzen and McFarlane (2002). The aerosols at model lateral boundaries and the other lateral boundary condi-tions are provided by an adaptive run of the global model (CanAM4) that assimilated reanalysis data through a sim-ple relaxational procedure that forces the horizontal wind, temperature and specific humidity from CanAM4 to follow that from the reanalysis, and it is also constraining all the other CanAM4 variables to be consistent with the reanaly-sis variables. The two CanRCM4 simulations analysed in this paper are nested using all physical prognostic variables from the parent global-model CanAM4 that was previously nudged toward ERA-Interim reanalysis. The SSTs came from the ERA-Interim reanalysis and the simulations were started on January 1988 with climatology soil moisture and temperature. As for the CRCM5, the CanRCM4 is a one-way nested model using a Davies (1976) nesting zone, with an optional interior nudging for the large scales. For the CanRCM4 simulations presented in this paper, the inte-rior nudging was turned on, with a relaxation time of 24 h applied to spatial scales larger than 1,000 km.
2.2 Satellites and reanalysis datasets
As mentioned previously, the main goal of this paper con-cerns the evaluation of daily precipitation from the three RCM simulations described above. This requires datasets with spatial resolutions similar to the RCM simulations, and covering a long period of time. Usually, these sets of observations are gridded products that are based on in situ gauge-station observations. A number of such datasets are today available for the African continent, but these data suf-fer from uncertainty due to limitations in density of avail-able stations and in the techniques of data blending (e.g. Sylla et al. 2012). One example of such set of gridded gauge-based daily precipitation observations is the CPC Unified Gauge-based Analysis of Global Daily Precipita-tion (Chen et al. 2008) that covers the entire globe at 0.5° spatial resolution, from 1979 to present. Unfortunately, the rain-gauge stations are sparse throughout the African continent, especially over the tropical Africa; for example the mean station-to-station distance over tropical Africa is around 500 km, while over USA is close to 30 km. Con-sequently, Chen et al. (2008) do not recommended this dataset for tropical-Africa analysis. As an alternative, we will use gridded daily precipitation from three satellite
estimates that integrate also observations from rain-gauge stations, namely:
• The dataset from Global Precipitation Climatology Pro-ject (GPCP-1DD v.1.2; Huffman et al. 2001) is made available from late 1996 to present at 1° horizontal resolution and is using several input data. In the band 40°N–40°S, the daily precipitation is built from the Threshold Matched Precipitation Index, a microwave-calibrated infrared technique. This technique uses 3-hourly infrared brightness temperature histograms (from GOES, Meteosat and GMS geostationary satel-lites) with locally determined brightness temperature thresholds and precipitation rates based on Special Sen-sor Microwave Imager (SSMI) and constrained by the GPCP V2.1 monthly satellite-gauge product that incor-porates gauge observations from Global Precipitation Climatology Center (GPCC). The gaps are filled with NOAA AVHRR polar-orbiting IR satellite using the GOES Precipitation Index.
• The TRMM 3B42 version 6 (Tropical Rainfall Meas-uring Mission; Huffman et al. 2007) dataset pro-vides 3 hourly precipitation data for the entire tropics (50°S–50°N) since 1998 at 0.25° horizontal resolution; the rainfall product is based on a combination of esti-mates from the passive microwave radiometer and pre-cipitation radar from the TRMM satellite and infrared observations from geostationary satellites (GOES, Meteosat and GMS), which are re-scaled upon monthly gauge precipitation observations such as the GPCC and Climate Anomaly Monitoring System (CAMS) prod-ucts.
• The recent Africa Rainfall Climatology version 2 (ARC2; Novella and Thiaw 2012) daily precipitation estimates from the Climate Prediction Center (CPC) provide daily precipitation data over Africa from 1983 to present at 0.1° horizontal resolution. The satellite estimates are based upon cloud top temperature (which is used for the GOES Precipitation Index) measured from the 3-hourly geostationary infrared (IR) data cen-tered over Africa primarily from the European Organi-sation for the Exploitation of Meteorological Satel-lites (EUMETSAT). These satellite estimates are next merged with quality controlled Global Telecommunica-tion System (GTS) gauge observaTelecommunica-tions, which reports 24-h rainfall accumulations over Africa, in order to pro-duce the final estimates.
Precipitation in these sets of data is an indirect product obtained using a combination of several measurements from multiple satellites combined into the final prod-uct using various complex algorithms. Consequently, the uncertainty in these observational products is greater than
in in situ gauge measurements. However, as mentioned previously, they represent the only practical solution for regions without a dense gauge-measurement network. Despite the fact that the satellite-estimated precipitation is re-scaled to match rain-gauge measurements in land points where such measurements are available, some differences exist into the various final products in the other points. Consequently, in this study, the RCM evaluation is done with respect to all three satellite-estimated products (GPCP, TRMM and ARC2) instead of only one. Using all of them in the evaluation process permits also to obtain a certain measure of the uncertainty in derived observations. How-ever, it must be point out that the three sets of data are not totally independent. They are using some common satellite measurements, and are also re-scaled to match rain-gauge measurements, which are not totally independent either because the different networks with in situ measurements are sharing a large part of the same measurements. Hence, the comparison of the GPCP, TRMM and ARC2 data gives a minimum level for the observation uncertainty. The RCM simulated data are considered good if they are falling into the range of observed values.
Along with these satellite-gauge-combined datasets and the three RCM simulations, this study will consider also daily precipitation from four reanalysis products:
• The ECMWF ERA-Interim reanalysis (Uppala et al.
2008; Dee et al. 2011), which provides precipitation rate at a spatial resolution of 0.75° × 0.75° covering the period 1979 to present.
• The NCEP/DOE Reanalysis II (Kanamitsu et al. 2002) that provides precipitation rate on a T62 Gaussian grid with 192 × 94 points covering the period 1979 to pre-sent (henceforth referred to simply as NCEP).
• The Twentieth Century Reanalysis (hereafter 20CR) is a global reanalysis dataset (Compo et al. 2011) with pre-cipitation rate on a global Gaussian T-62 grid and it is spanning the period 1870–2010.
• The NASA Modern Era Reanalysis for Research and Applications (MERRA; Rienecker et al. 2011) with pre-cipitation that spans 1979 through present day and a spa-tial resolution of 2°/3° longitude by 1°/2° latitude. From the four sets of reanalysis, MERRA has the closest hori-zontal resolution to the AFRICA-CORDEX simulations. Reanalysis products provide long-term atmospheric fields, created via data assimilation scheme and background forecast model integration over periods of 6–12 h covering the last decades, with model formulation and assimilation system kept unchanged (Bosilovich et al. 2008). Hence, they are dependent on the assimilation method and model physics, which lead to uncertainty in the output, espe-cially for precipitation field that is not a direct assimilated
observation. Then, this last field is highly related to fore-cast-model physical parameterizations. For example, MERRA assimilates directly from observations the surface pressure, temperature, specific humidity, cloud condensate and zonal and meridional wind, which are used in the fore-cast model to simulate surface convective and large-scale rain rate. On the other hand, for precipitation, for the recent period (1987/07 to present), the MERRA assimilation sys-tem uses rain rate estimates from the Special Sensor Micro-wave Imager and TRMM MicroMicro-wave Imager, which are not direct in situ measurements. ERA-Interim is using rain-affected radiances from satellites in the assimilation process rather than derived rain rates, while NCEP/DOE is using a correction method for the soil moisture at the topsoil layer based on the differences between the previous pentad aver-age NCEP model generated precipitation, and the CMAP pentad precipitation. 20CR is assimilating only synoptic surface pressure and is using monthly SST and sea-ice dis-tributions as boundary oceanic conditions. Because several studies consider reanalysis as an alternative solution for evaluation studies over regions where observational data are sparse, and when knowledge of the state of the atmos-phere on a similar uniform grid is required (e.g. Zhang et al. 2011), a comparison with satellite-based precipitation will bring valuable information.
2.3 Study area and space–time evaluation
Hence, the daily-precipitation statistics from the 0.22° and 0.44° grids of CanRCM4 and 0.44° grid of CRCM5 simulations and also from ERA-Interim, NCEP, 20CR and MERRA will be compared with that of GPCP, TRMM and ARC2, over West Africa (20°W–25°E; 0°N–25°N), with an emphasis on the West Sahel region (15°W–15°E; 12°N–20°N). Figure 1 presents the AFRICA-CORDEX domain of integration, and these two areas used in our anal-ysis (West Africa in blue, West Sahel in red).
The analysis focuses only on the common period across various products described in the previous section, which corresponds to 1998–2008 (11-year statistics). Daily pre-cipitation indices will be computed over the Sahel wet season, corresponding mainly to June, July, August and September (JJAS) months. Because the various datasets correspond to a broad range of horizontal resolution, the indices (see their definition in the following section) are computed initially on their original grid, and then interpo-lated on the AFRICA-CORDEX grid at 0.44° of resolution. 2.4 Precipitation indices and monsoon onset-retreat
definition
We selected four indices from the aforementioned occur-rence and duration categories that are suitable for the
purposes of this research because they are related to the rainfall distribution within the rainy season: R1mm, R10mm, R30mm and CWD.
A day is considered a wet day when daily precipitation ≥1 mm/day. Therefore, the R1mm index is the seasonal wet day’s occurrence index and it is computed as the number of wet days in the JJAS season. CWD index is the maximum length of wet spells, and it is given by the greatest number of consecutive wet days during the JJAS season. Threshold daily-precipitation values of 10 and 30 mm/day are used to delimit moderate intensity and heavy intensity precipitation days, i.e. R10mm and R30mm correspond to the number of days with daily precipitation ≥10 and 30 mm/day, respec-tively, during the JJAS season.
In order to determine the timing of the monsoon onset over the WAM area, different indicators have been devel-oped in literature (e.g. among others, Sijikumar et al.
2006; Fontaine and Louvet 2006; Vellinga et al. 2013). The vast majority of these indicators are based on large-scale precursors for which the band of maximum precipi-tation is shifted from its spring quasi-sprecipi-tationary position at 5°N to a northward position around 10°N. Therefore, the overall change in the monsoon system can be derived using different variables such as daily rainfall, outgoing terrestrial radiation or moist-static energy. Other indica-tors use local indices for agricultural applications, with information related to the effective start of the seasonal rainfall in specific area (e.g. Vellinga et al. 2013). In this paper, two indicators will be used, a large-scale index and a local index.
The large-scale precipitation onset index is usually com-puted from pentad (the 5-day mean) of precipitation as fol-lows. First are computed, for each year, the area-averaged amounts for each pentad of precipitation in a Northern box and a Southern box that encompass the Guinea and the Sahel maxima, which are normalised by the highest pen-tad of the year over each box (e.g. Sijikumar et al. 2006; Vellinga et al. 2013). Next, are computed the differences between the Northern and the Southern boxes. The result is a large-scale onset function that has values between −1 and 1. The onset date for each year is given by the pentad when the onset function turns positive, and remains positive for at least three pentads.
In this paper, the Southern box is defined between 0°N– 8°N, while the Northern box is defined between 8°N–16°N. Both boxes extend in longitude from 15°W to 15°E similar to the West Sahel domain presented in Fig. 1. This is dif-ferent from previous studies that were using smaller boxes (from 10°W to 10°E). Larger boxes are used here in order to facilitate the comparison with the local onset index that will be computed over the West Sahel domain. An 11-year average (1998–2008) is also applied on the large-scale onset pentads obtained for each year.
The local onset index is inspired and slightly modi-fied from the work of Liebmann and Marengo (2001) who focused on the rainy season in the Brazilian Amazon Basin. This index takes into account not only the occurrence of wet days during the time, but also the combined effect of duration and intensity of rainy sequences in order to define the onset. At each grid point, the daily rainfall accumulated anomalies (A) are computed for each year as the sum of daily-precipitation anomalies from 1st January up to the specific day:
where R(n) is the daily precipitation, with day from 1st January to 31 December, and R is given by:
(a) The local climatological mean (in our case the 11-year mean over the period 1998–2008) at points where the climatological mean is ≥1 mm/day (therefore a wet day).
(b) The 1 mm/day value (the threshold that separates dry days from wet days), in points where the local climato-logical mean is smaller than 1 mm/day.
Therefore, the anomalies are computed for each grid point with respect to a local threshold that is given by the 11-year mean (from 1998 to 2008) >1 mm/day, and by the value of 1 mm/day in points where the 11-year mean is smaller than 1 mm/day.
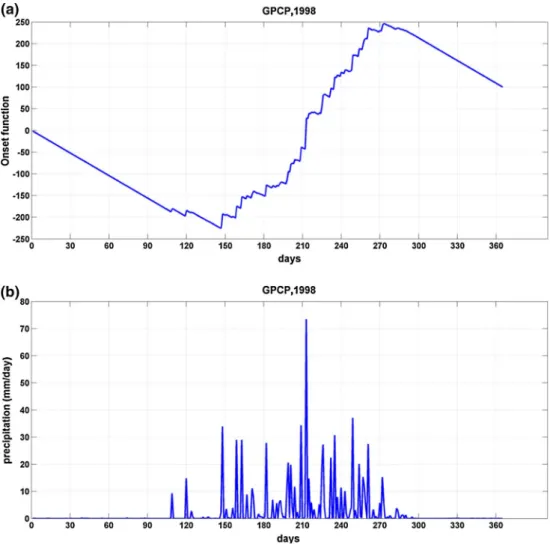
Figure 2 presents an example of the local onset func-tion and daily precipitafunc-tion amounts in GPCP dataset, for 1998, at the grid point closest to Niamey (2.2°E; 13.2°N). At that point, the local climatological mean (in our case the 11-year mean) exceeds 1 mm/day, hence the onset function increases/decreases when the local daily precipitation is greater/less than the local climatological mean. The figure shows that the first one hundred days of the year are dry days, and that the first events with precipitation exceeding the local climatological mean (the first two small increasing portions in Fig. 2a) are two isolated events followed by dry periods. These iso-lated events must not be considered as indicators for the onset. The day after the annual minimum of the func-tion is the first heavy-rain event, as this is followed by regular days with precipitation. The rainy season begins with this sequence of rainy events, as this corresponds to the persistence in rainfall occurrence, duration and intensity. The maximum of the function (in Fig. 2a) indi-cates the last important rainy event followed by a rapid installation of the dry spell. In order to avoid the false onsets, we consider the day after the annual minimum of the function as the day when the rainy season will (1) A(day) = day n=1 january (R(n) − R),
really install in the region (the local onset day). The day of annual maximum will mark the day when the rainy season is finished (the local retreat index). Therefore, the onset in GPCP dataset at Niamey in 1998 corresponds to the 147 day of the year (i.e. May 27th), while the mon-soon retreat is given by the 273 day of the year (i.e. Sep-tember 30th). The local onset/retreat will be computed for each grid point and the climatological value will be given by the 11-year average of the onset/retreat indices obtained for each year.
For regions where the local climatological mean is smaller than 1 mm/day, the daily rainfall accumulated anomalies are computed with respect to the 1 mm/day threshold, and hence the onset function will generally decrease, being characterised by dry days in the most part of the year. In these regions, the annual minimum corre-sponds to the last day of the year, while the annual maxi-mum corresponds to the first day of the year. Such points where an annual minimum occurs after the 1st of October will be marked as points without a real monsoon onset/ retreat in our analysis.
3 Results
3.1 Seasonal mean climatology
We first analyse the wet-season (JJAS) average precipita-tion over West-Africa region. Figure 3 presents the spatial distribution of the 11-year-average JJAS-mean precipita-tion for ARC2, TRMM, GPCP, 0.22° and 0.44° CanRCM4, 0.44° CRCM5, MERRA, 20CR, NCEP and ERA-Interim. The West-Sahel region is highlighted by a red rectangle. In general, the observation products (Fig. 3a–c) have similar spatial precipitation patterns with maximum values over the mountain regions of Cameroun and Guinea, and with a Northeast–Southwest gradient over Sahel. However, although their large-scale patterns are similar, they present significant differences at the local scale. The two RCMs and the reanalysis also capture the large-scale spatial pat-terns of mean precipitation, but while CRCM5, MERRA and ERA-Interim present a narrower band of precipitation, the CanRCM4 and 20CR extend the band of precipita-tion over Sahel. Both 0.44° RCM simulaprecipita-tions and the sets
Fig. 2 The 1998 time variation
(in calendar days) of a the local onset function and b daily pre-cipitation, corresponding to the GPCP dataset, at the grid point closest to Niamey
of reanalyses have more intense and extended maxima of precipitation over ocean along the West Africa coast, while the 0.22° CanRCM4 simulation is dryer along the coastal regions of Gulf of Guinea.
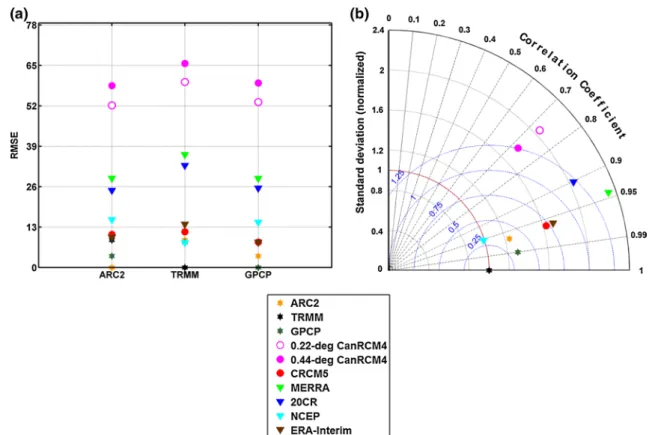
The range of spatial correlations and root-mean-squared errors (RMSE) between the precipitation fields over the Sahel region (15°W–15°E; 12°N–20°N) is illustrated in Fig. 4: Fig. 4a shows the Pearson correlation coefficient, while Fig. 4b shows the RMSE between each set of RCM
and reanalysis data and the three sets of observations (ARC2, TRMM and GPCP) used as different reference fields (X-axis). The Pearson correlation coefficient reveals the degree of large-scale similarity between the simulated and observed patterns of the fields, whereas the RMSE cri-terion highlights the small-scale differences among vari-ous products. All three sets of observational data represent quite similarly the suggested Northeast–Southwest gradient of precipitation, with the correlation coefficients mostly
Fig. 3 Averaged (1998–2008) seasonal-mean (JJAS) precipitation (in
mm/day) over West Africa for: a ARC2, b TRMM, c GPCP, d 0.22° CanRCM4, e 0.44° CanRCM4, f 0.44° CRCM5, g MERRA, h 20CR,
i NCEP and j ERA-Interim. All the fields were regridded on the 0.44°
AFRICA-CORDEX grid. The West-Sahel region is highlighted by a
>0.96. Similar values are obtained for the 20CR (between 0.92 and 0.96) and NCEP (between 0.9 and 0.95) reanaly-sis, while MERRA, ERA-Interim, CRCM5 and 0.44° Can-RCM4 present correlation coefficients that range between 0.96 and 0.79. In the case of 0.44° CanRCM4, a smaller gradient results in a lower correlation, as the simulated band of precipitation extends too far in the North accord-ing to observed data (see Fig. 3), while for MERRA, ERA-interim and CRM5 cases, a greater gradient caused by the dry bias from the North of Sahel has in general a lower impact on the correlation. The 0.22° CanRCM4 has some-what smaller correlation coefficients with values between
0.72 and 0.83 than the other simulations and reanalysis. This is caused by its higher values than in observations over a large part of the southern Sahel, which changes the pat-tern of precipitation compared to TRMM and GPCP from a Northeast–Southwest gradient to a North–South gradient.
Concerning the RMSE criteria (Fig. 4b), we can clearly distinguish the three sets of observations from reanalyses and models. The larger differences between observations are found with respect to GPCP fields (0.9 and 0.7 mm/day for ARC2 and TRMM, respectively) defining an interval of uncertainty relatively small for the seasonal mean. How-ever, as mentioned in Sect. 2.2, the three sets of observa-tions are not totally independent: they are rescaled to match almost the same gauge measurements. Consequently, this interval of uncertainty does not take into account uncer-tainty in gauge measurement, but rather the combined effect of resolution and integration of various satellite prod-ucts between datasets. The reanalysis and the models have RMSE varying between 1.3 and 2.0 mm/day, with MERRA presenting in general the better scores. The 0.22° RCM4 has lower scores than the 0.44° version over the West Sahel region, the increased resolution exacerbating slightly the wet bias over Sahel.
In summary, the three datasets of observations, available over the West Africa region, show similar large-scale pat-terns for the mean seasonal precipitation, with quite high correlation values for all pairs of data products. However, some differences are noted at the local scale, with RMSE over Sahel region being up to 0.9 mm/day. Even if this value seems to be small, this could affect the identifica-tion of wet and dry days towards the northern limit of the WAM area (see the following section). At the large scale, the two RCMs perform quite well in reproducing the main features of the WAM area. Nevertheless, at the local scale, both CanRCM4 simulations have a large band of precipita-tion that extend too far into Sahel region (i.e. too wet over this area), while CRCM5 simulates a too narrow band of precipitation, which is translated into a dry bias over Sahel. These results are in line with previous works using other RCMs (e.g. Sylla et al. 2012; Diallo et al. 2012; Nikulin et al. 2012).
3.2 Daily-precipitation indices and frequency distribution In this section, we analyze the RCMs and reanalyses skill in reproducing the daily-precipitation indices over West Africa according to the three gridded satellite-gauge obser-vations used as reference: GPCP, TRMM and ARC2. As these products are provided on different horizontal resolu-tion grids (i.e. 1° × 1° for GPCP, 0.25° × 0.25° for TRMM and 0.1° × 0.1° for ARC2), as for the three sets of reana-lyzes, all fields have been interpolated on a common grid (i.e. CanRCM4/CRCM5 rotated pole grid). All indices are
Fig. 4 a Spatial Pearson correlation coefficient and b
root-mean-squared differences in mm/day between the climatological seasonal (JJAS) mean of precipitation over West Sahel (red box in Fig. 3) from each RCM/reanalysis and the three sets of observations (ARC2, TRMM and GPCP)
computed over the JJAS season and correspond to average values over the 1998–2008 period.
3.2.1 The wet days occurrence index (R1mm)
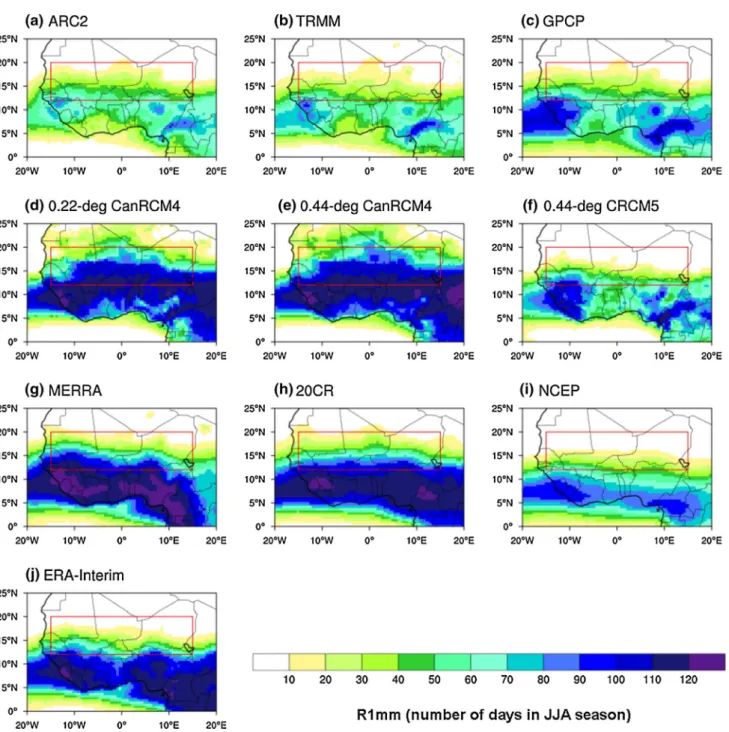
Figure 5 displays the comparison of 11-year average val-ues of wet day’s occurrence index (i.e. R1mm expressed in number of days) in JJAS season between the three sets
of gridded observations, the three RCMs and the four rea-nalysis products over West Africa. This shows that the three sets of gridded observations have similar large-scale patterns, the larger number of wet days being observed in regions with maximum seasonal precipitation (see Fig. 3). However the extension and amplitude of these maxima are quite different in the three sets of gridded observations. While GPCP display large areas with more than 90 wet
Fig. 5 Comparison of seasonal (JJAS) mean (computed over the
1998–2008 period) values of wet days occurrence (R1mm index in days) over West Africa between: a ARC2, b TRMM, c GPCP, d 0.22° CanRCM4, e 0.44° CanRCM4, f 0.44° CRCM5, g MERRA, h 20CR,
i NCEP and j ERA-Interim. All the fields were regridded on the 0.44°
AFRICA-CORDEX grid. The West-Sahel region is highlighted by a
days within the season, the TRMM and ARC2 have only small regions with such high values over the western Guin-ean plateau and the eastern Cameroon Mountain. Never-theless, over Sahel, the three sets show more similar fields characterised by a gradual decrease in the number of wet days from south–west to north–east. Figure 6a shows the RMSE (in number of days) between each field displayed in Fig. 5 and the three sets of gridded observations over West Sahel (the red rectangle in Fig. 5). The RMSE between observations over Sahel region is up to 10 days, the larger differences being with respect to TRMM data that presents a smaller number of wet days in the South Sahel than the other two sets of gridded observations.
The spread between the results of RCMs and reanaly-ses is much larger than between observations (Fig. 5). The overall picture shows that CanRCM4 simulations, MERRA, ERA-Interim and 20CR reanalyses exhibit large and quite homogeneous regions with a high number of wet days not present in the observed datasets, especially in the south of 15°N. On the other hand, CRCM5 and NCEP are closer to the GPCP field, presenting similar patterns with similar amplitudes. If only the Sahel region is considered, the CRCM5 field is close to the uncertainties or errors in observations presenting RMSE between 8 (with respect to
GPCP) and 11 days (with respect to TRMM), while the CanRCM4 simulations display a quite large number of wet days with RMSE between 52 and 66 days within the season (Fig. 6a). Quite large RMSE values are also present in the MERRA and 20CR fields. The differences between CRCM5 and GPCP are due to the narrower band of sea-sonal wet days in the model compared to observations, with a dry bias in the North Sahel for this RCM. On the contrary, the CanRCM4 simulations have a larger band of seasonal wet days that is extending over Sahel inducing an overestimation of mean seasonal precipitation in this region (Figs. 3, 6a). Overall, the two CanRCM4 simulations using two different resolutions are very similar in general, but some finer details depicted for the 0.22° simulations over the Gulf of Guinea region seem to be closer to observations than for the coarser 0.44° simulation, mainly due to the better representation of coastlines (or air-sea contrast) and topography within the higher resolution simulation.
A summary of differences or similarities between observed and simulated fields over Sahel region is pre-sented in Fig. 6b, which displays the Taylor (2001) diagram with respect to TRMM field. The spread present in the set of observations makes it difficult to choose one reference field for the Taylor diagram. In order not to underestimate
Fig. 6 Comparison of seasonal (JJAS) mean (computed over the
1998–2008 period) values of R1mm over West Sahel (red box area in Fig. 5) from both RCMs and reanalysis products concerning. a The
root-mean-squared differences (in number of days) with respect to the three sets of gridded observations (ARC2, TRMM and GPCP) and b Taylor diagrams with respect to TRMM
the uncertainties between observations, we choose TRMM as reference for the R1mm index evaluation, because the larger mean differences between the sets of observations over Sahel is with respect to this dataset. We have also plotted on the diagram the other two sets of observations in order to give some measure of the uncertainty in obser-vations. The Taylor diagram shows three statistical criteria with respect to one reference field: the black radial lines represent the spatial correlation coefficients between the simulated/reanalysis/observed and the reference field; the black dotted circles show the spatial standard deviation ratio between the simulated/reanalysis/observed and the reference field; and the blue dashed circles correspond to the RMSE once any overall bias has been removed, i.e. subtracting the spatial mean and dividing by the spatial standard deviation of the reference-field. The diagram con-firms that the differences between the sets of observations over Sahel are primary due to differences in the spatial variability, both sets of observations having a larger spatial standard deviation than the TRMM field. Concerning the RCMs and the reanalyses, the best scores are obtained for NCEP, which has a high correlation coefficient (0.95) and a similar spatial standard deviation with TRMM, and one of the lowest RMSE. CRCM5 and ERA-Interim also present similar patterns as reflected by a high correlation coeffi-cient (0.96). However, their spatial standard deviation over Sahel is overestimated with respect to observations because both are affected by a dry bias or lack of wet days in the North Sahel. The overestimation of wet days over Sahel in the two CanRCM4 simulations induces a smaller cor-relation coefficient (around 0.72), and also a larger spatial standard deviation than observed data. The MERRA and 20CR with too excessive gradient in wet days over Sahel have the largest spatial standard deviation, i.e. the strongest spatial overestimation among RCMs and reanalysis data-sets with respect to observed data.
3.2.2 The moderate intensity index of rainfall (R10mm)
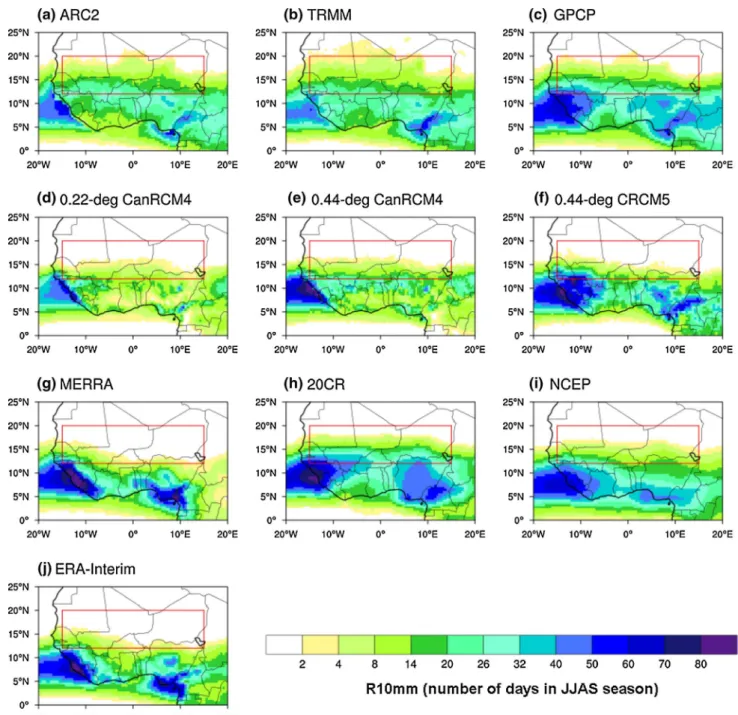
The R10mm index is analyzed in this section, which gives the number of days in the JJAS season with precipitation ≥10 mm/day as this threshold corresponds to moderate intensity values of rainfall over Sahel regions (see Figs. 8, 20 in Gachon et al. 2007). Its 11-year average (1998–2008) is displayed in Fig. 7 over the WAM area, while the corre-sponding RMSE over Sahel region is presented in Fig. 8a. The three sets of gridded observations present similar fea-tures as for the R1mm index: the two primary maxima are related to regions with high mean precipitation values and wet day’s occurrences, GPCP showing a much larger extend of these maxima than the TRMM and ARC2 data. Over Sahel, the number is decreasing from south-west to north-east where all three sets have very small R10mm
values (≤2). The larger differences between observations over Sahel are obtained with respect to GPCP data (RMSE over Sahel up to 4 and 5 days during the JJAS season), which exhibit higher values in the Southwest Sahel than ARC2 and TRMM. Because the larger mean differences between the sets of observations over Sahel are with respect to GPCP, we choose GPCP as reference for the R10mm Taylor diagram over Sahel, which is displayed in Fig. 8b. The Taylor diagram shows even a larger difference in the spatial variance of observations over Sahel in R10mm than in R1mm. However, the correlation coefficients between the three sets of observations have large values (larger than 0.95) showing a good overall agreement among them.
The CRCM5 R10mm field presents also similar charac-teristics to R1mm field with similar patterns with maxima extending as in GPCP, but with a little bit larger ampli-tude and a dry bias in the North Sahel due to the narrower band of moderate precipitation compared to observations (Fig. 7). This is reflected by a ratio of spatial standard deviation close to GPCP and a good correlation coefficient (above 0.85; Fig. 8b). Both CanRCM4 simulations present R10mm indices smaller than in observations over land and underestimate spatial variability, especially in the 0.22° simulation (Figs. 7, 8b). Given that CanRCM4 simula-tions overestimate wet days occurrence over all West Africa and Sahel, this suggests that the excessive occurrence of wet days in the CanRCM4 is linked with light precipita-tion events, smaller than 10 mm/day. However, both Can-RCM4 simulations present correlation coefficients with GPCP over Sahel >0.87, slightly better than for CRCM5 (see Fig. 8b).
The 20CR presents also better results for R10mm than for R1mm, with spatial correlation coefficient with GPCP of 0.97 (Fig. 8b) and RMSE over Sahel between 4 and 8 days (Fig. 8a). However, this reanalysis has higher values over South Sahel and smaller over the North Sahel, which are reflected into a higher spatial variance in the Taylor dia-gram. MERRA and ERA-Interim present the larger RMSE with respect to the three sets of observation due to the very small values in R10mm over almost all Sahel (see Fig. 7).
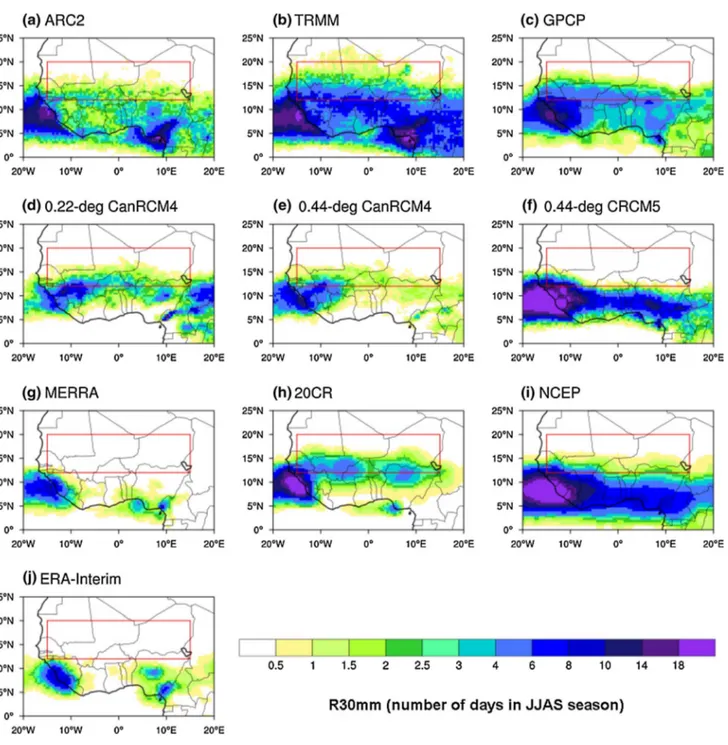
3.2.3 The high intensity index of rainfall (R30mm)
For Sahel regions, the R30mm index corresponds to heavy precipitation values but not necessarily to very high values as defined by ETCCDI (i.e. near or slightly below of above the 90th percentile of rain days; see Figs. 8, 22 in Gachon
et al. 2007). Figure 9 shows the comparison of climatologi-cal mean values for this index among observed, reanalysis and RCMs datasets, Fig. 10a presents the RMSE for each reanalysis and RCM dataset versus the three sets of gridded observations (ARC2, TRMM and GPCP), while Fig. 10b shows the Taylor diagram with respect to TRMM, which
reflects also the largest R30mm spatial gradient across the Sahel region among the three observed datasets.
As for R1mm and R10mm indices, some differences are observed between the three sets of observations (Fig. 9). The largest differences are between TRMM and ARC2 datasets, the former presenting large values reaching up to 8 days in the South Sahel, while ARC2 has values not higher than 4 days over this region. Figure 9 shows also that CRCM5 and NCEP present similar R30mm indices, with larger amplitude over ocean, large values over Guinea coast and very small values over Sahel, while MERRA and
ERA-Interim have overall very small R30mm values. The CanRCM4 simulations and 20CR reanalyses present dif-ferent patterns, with very small values on the Guinea coast and large values over ocean and South Sahel. Over South Sahel, the 0.22° CanRCM4 simulation is quite similar to the ARC2 values, while 20CR is closer to GPCP values. As consequence, as shown in Fig. 10a, b, their metrics over Sahel are in the interval of uncertainty in observations. The very small values of R30mm over Sahel in CRCM5, MERRA and ERA-Interim induce smaller spatial correla-tion values than for the other datasets (Fig. 10b). In this
respect, the CanRCM4 simulations provide higher corre-lation values and lower RMSE quite compatible to ARC2 values (i.e. with respect to TRMM).
3.2.4 The daily precipitation frequency distribution (south, central and north Sahel)
To complement the analysis of wet days occurrence, mod-erate and heavy daily rainfalls, the precipitation frequency distribution within the wet season (JJAS) is shown in this section. In Fig. 11, the amount of rainfall contribution per daily intensity fallen over the June–September months dur-ing the 11-year period is shown in ten intervals (or bins) of intensity: 0–0.1; 1–2; 2–4; 4–8; 8–16; 16–32; 32–64; 64–128; 128–256; 256–512 mm/day. Here we consider each day during the JJAS seasons (in the 1998–2008 time window) and each grid point in three Sahel sub-regions (the Southern Sahel between 12°N and 14°N, the Central Sahel between 14°N and 17°N, and the Northern Sahel between 17°N and 20°N). The figure shows the precipita-tion distribuprecipita-tion per season and per region (over Sudanese, Sahelian and sub-Saharan areas). Consequently the sum of all bins gives the total spatial–temporal average precipita-tion. Because the Y-axis presents the total precipitation in a precipitation intensity bin (instead of the more classical representation of percentage of precipitation per bins and
their relative contributions to the total precipitation amount per season; e.g. Diaconescu and Laprise 2013; Martynov et al. 2013; Šeparović et al. 2013), the comparison of dia-grams indicates also the bias magnitude or similarity for each precipitation intensity. Note that these distributions should actually be shown as histograms; however, in order to increase the clarity of the comparison between observed and reanalysis/RCMs products, we chose to present them as curves. Different panels show these two datasets (the reanalyses in the top panels and RCMs in the bottom pan-els) with the three sets of observations (ARC2, TRMM and GPCP) shown in all panels, grey area representing mini-mum and maximini-mum values of those three. Figure 11 shows that the largest proportion of the precipitation over the Sahel region is coming from events with intensity between 8 and 32 mm/day in ARC2 and in GPCP, and higher in TRMM between 16 and 64 mm/day. In general, the ARC2 and GPCP distributions are quite similar, especially for light and moderate precipitation (smaller than 16 mm/ day) over southern and central Sahel and high precipitation events (greater than 32 mm/day) over central and northern Sahel. In the intensity category between 16 and 32 mm/ day, the GPCP distribution has larger amplitude than the ARC2 distribution over southern Sahel, due to the higher R10mm index in GPCP than in ARC2 over this sub-region (see Fig. 7). The spread among observations increases for
heavy precipitation events especially over northern Sahel with TRMM distribution presenting a systematic higher occurrence of strong rainfall above 32 mm/day (as sug-gested also in Fig. 9). For the reanalysis datasets, 20CR and NCEP distributions over Southern and Central Sahel run almost parallel, presenting maxima corresponding to the bins of 8–32 mm/day as the ARC2 and GPCP data-sets. However, their amplitudes differ from observations as NCEP underestimates the total amount of precipitation in bins of 8–32 mm/days, while 20CR overestimates the
total amount of precipitation for light and moderate events. 20CR is shifted toward weaker precipitation over northern Sahel, while NCEP is presenting very small occurrence of light and moderate rainfalls (without any heavy precipita-tion event) because of the dry bias observed over this sub-region (see Figs. 5, 7, 9). Despite the fact that MERRA and ERA-Interim have finer horizontal resolutions than 20CR and NCEP reanalyses, they present distributions over Sahel shifted toward light-precipitation events, with maxima cor-responding to the bins of 4–8 mm/day over southern Sahel,
and 2–8 mm/day over central Sahel. This result is in agree-ment with the results obtained for R1mm, R10mm and R30mm, which showed that MERRA and ERA-Interim in general overestimate the number of wet days (R1mm) over southern and central Sahel, but underestimate the number of moderate (R10mm) and heavy (R30mm) rainfalls over all Sahel. The ERA-Interim dry bias over the northern Sahel is reflected also in very small amounts of total pre-cipitation for all the bins over this sub-region. This is not surprising, given the fact that precipitation in reanalyses is mainly model generated and therefore, highly related to forecast-model physical parameterizations.
The CanRCM4 and CRCM5 simulations show quite different precipitation distributions. CRCM5 presents a distribution similar to ARC2, over southern Sahel, with only smaller amplitude for moderate to high rainfalls (i.e. 16–32 mm/day). In general, the occurrence of all high-intensity bins over central Sahel is underestimated in this model, and quite negligible for the northern Sahel, due to its narrower band of precipitation that generally does not go north of 15°N (see Figs. 5, 7, 9). The two Can-RCM4 simulations have quite similar values for all cate-gories of precipitation intensity, with two maxima instead of one maximum as suggested by observed and other reanalysis/RCM products. For all three sub-regions, the
simulated total amount of precipitation is mostly coming from events with light precipitation (2–8 mm/day) or from extreme values (precipitation higher than 64 mm/day). In other words, CanRCM4 strongly overestimates the precipitation events with small amount, underestimates events coming from moderate to high intensity rainfall (16–32 mm/day) over all sub-regions, and slightly overes-timates very high values over southern and central Sahel. This is related to and compatible with results shown in Fig. 5 with a higher number of wet days (R1mm) and a lower number of days with precipitation ≥10 mm/ day than in observations over the major part of Sahel. Few differences in the simulated frequency distributions from the 0.22° and 0.44° simulations are also revealed. The higher resolution increases the amount of precipita-tion coming from extreme precipitaprecipita-tion over southern and central Sahel, and reduces that coming from smaller rainfall events (2–8 mm/day) over northern Sahel. How-ever, the occurrence of moderate precipitation events (i.e. 16–32 mm/day) stays quite similar between the two Can-RCM4 simulations, while the total amount from intensi-ties of 8–16 mm/days is even smaller in the higher resolu-tion run. Therefore, the increased resoluresolu-tion in CanRCM4 does not lead to major improvement in the simulated fre-quency distribution over Sahel.
3.2.5 The maximum length of wet spells (CWD)
To complement the evaluation of precipitation occurrence indices (i.e. R1mm, R10mm and R30mm), we analyze in this section the persistence or duration of wet spells, i.e. the CWD index, which represents the maximum number of consecutive wet days during the JJAS season.
Figure 12 shows the climatological mean values of CWD (over the 1998–2008 period), while in Fig. 13 we present the RMSE for this index (in number of days) over West Sahel between each reanalysis/RCM dataset and the three sets of gridded observations (ARC2, TRMM and GPCP). As for the R1mm, R10mm and R30mm indices, there are important differences between the three sets of observations.
Fig. 11 Spatial-temporal daily-precipitation frequency distribution
per region (Southern, Central and Northern Sahel, see Fig. 1) and per eleven JJAS seasons (1998–2008) from (first line) the MERRA, 20CR, NCEP and ERA-Interim reanalysis and from (second line) 22° CanRCM4, 44° CanRCM4 and CRCM5 simulations. The distribu-tions corresponding to the three sets of observadistribu-tions (ARC2, TRMM
and GPCP) are presented on all panels and the total area covered by them is shadowed in grey. The Y-axis represents the spatial–temporal mean amount of daily rainfall per bins or per range of intensity (in mm/day), i.e. the mean of all rainfall fallen over each respective area over the 4 months (June–September) and the 11-year period. The sum of all bins gives the total spatial–temporal average precipitation
These differences concern in general the amplitude and extension of maxima, which are more pronounced in GPCP than in TRMM and in ARC2. Nevertheless the three fields present more similar features over West Sahel region (the red square). In general, the CWD index is relatively weak over this region with values between 4 and 8 days in the most part of South Sahel and values no >4 days in Central and North Sahel. Similar values are presented in CRCM5 and NCEP datasets, which achieve weak RMSE with val-ues within the range of observational data (Fig. 13). A dif-ferent feature is depicted from 20CR dataset, which has
CWD values between 50 and 80 days to the South border of Sahel domain, and up to 20 days in the Central Sahel. The MERRA, ERA-Interim and the two CanRCM4 simulations overestimate the persistence of wet days over the major part of southern Sahel, and over the 12°N–15°N humid band area. Note that this overestimation in 20CR, MERRA, ERA-Interim, 0.22° and 0.44° CanCM4 datasets coincides with excessive number of wet days (R1mm, see Fig. 5) and that for MERRA, ERA-Interim, 0.22° and 0.44° CanCM4 datasets, the most part of the total precipitation over Sahel is coming from days with light and moderate precipitation (see
Figs. 5, 7, 11). Therefore, the excess in number of wet days with smaller intensity than in observations explain the larger number of consecutive rainy days. This does not result in any significant bias in the mean seasonal precipitation, i.e. the total amount is not significantly affected (see Fig. 3).
In summary, overall CRCM5 presents a quite good daily-precipitation distribution, with a relatively well simu-lated number of wet days, and a CWD close to observa-tions for a large part of the west Sahel region. However, this RCM underestimates the precipitation frequency, espe-cially over central and northern Sahel, where a dry bias and a general narrower seasonal band of precipitation compared to observations is revealed. The two CanRCM4 simulations are generally characterised by an excessive number of wet days and CWD over West Sahel. This is due to a general propensity to simulate a large number of days with light and moderate precipitation, the most part of the amount of total precipitation over West Sahel resulting from such events, the rest resulting from a relatively small number of days with extreme precipitation (larger than 60 mm/day); all these events are too high with respect to observed data. 3.3 West African monsoon onset and retreat indices In this section we examine how observations, RCM simu-lations and reanalyses represent the timing of the mean
monsoon onset/retreat over Sahel using two precipitation indicators: a large-scale index indicated on the Hovmöller diagrams and a local index as defined in Sect. 2.4.
3.3.1 Hovmöller diagrams and the large‑scale onset index
Figure 14 shows the mean (1998–2008) daily-precipita-tion intra-annual variability (in mm/day) using Hovmöller (latitude vs. time, from 0°N to 24°N and for each day) dia-grams. The diagrams are computed from daily precipita-tion fields zonally averaged between 15°E and 15°W (the West Sahel region) and smoothed using a five-day running mean. The Fig. 14 indicates also, using vertical lines, the mean large-scale onset date (computed as the date when the mean precipitation in the 15°E–15°W; 8°N–16°N box turns greater than the mean precipitation in the 15°E–15°W; 0°N–8°N box; see Sect. 2.4) for RCMs and reanalyses (a vertical red line in the corresponding panel) and for the ARC2/TRMM/GPCP sets of observations (indicated by cyan/blue/green vertical lines and presented in all the panels in order to facilitate the comparison with model simulations and reanalyses onset dates). The period corresponding to the mean large-scale onset pentad for each dataset is also men-tioned in the title of the corresponding Hovmöller diagram.
The Hovmöller diagrams show that the three sets of observations have similar features with a first rainy sea-son (March to June) over the Guinea Gulf coastlines (near 4°N), a sudden shift in the maximum of precipitation from 5°N to around 12°N in June/July, and a relatively smooth retreat of the band of precipitation from 12°N toward south during September corresponding to the second maximum of the rainy season near the Guinea Gulf. However, some differences exist in the amplitudes of the maxima and/or in its position during the year. In general, ARC2 data pre-sent smaller amplitude over 10°N than TRMM and GPCP datasets, while GPCP data display the largest maximum at 10°N and the smallest maximum for the Guinea Gulf dur-ing the first part of the rainy season.
The two CanRCM4 simulations also display maxima of precipitation with an abrupt shift between the first and sec-ond maximum during the year. However, the band of pre-cipitation from March to July is too far extended toward the North compared to the three sets of observations. While all three sets of observations display precipitation larger than 2 mm/day over the South of the Sahel (near 12°N) with a progression by the end of May toward the North, the Can-RCM4 simulations show larger precipitation values over this area starting too early (i.e. by the end of March) with a more rapid northward migration than in observed data-sets. In spite of these differences, the simulated maxima of precipitation are in general well located in space and in time with respect to the three sets of observations. The CRCM5 simulation is characterised by a narrower band
of precipitation without a clear abrupt shift in precipita-tion. The band of precipitation larger than 2 mm/day passes through the 12°N latitude by the end of April, but does not progress much farther northward as in observed values.
NCEP reanalysis data also present a narrower band of precipitation without an evident abrupt shift between the two maxima positioned too far in the south with respect to observations. A more gradual or smoother progression from South to North characterises also MERRA and ERA-Interim precipitation compared to observed. The 20CR pre-sents a first rainy season over the Guinea Gulf coastlines, a relatively rapid shift in the maximum of precipitation toward the North, and a smooth retreat toward the South. However, the intensities and the positions of the two max-ima are different in this reanalysis compared to the three
sets of observations with a weaker and shorter first maxi-mum (in amplitude and in time) over the 4–8°N band, and an excessive second maxima over the 12°N area.
In general, the average onset pentad, indicated by the vertical lines, captures well the mean period of the northern shift observed in the latitudinal distribution of precipitation for each dataset. The mean value over the eleven-year period corresponds to the onset pentad 34 (15–19 June) in the ARC2 case, 35 (20–24 June) in the GPCP case and 37 (30 June–4 July) in the TRMM case. Therefore, the total period covered by the onset date in observations is from 15 June to 4 July. This means that a large uncertainty (i.e. around 3 weeks) is associated with the large-scale onset date in observations. In Table 2, we present the large-scale onset for each year, the 1998–2008 mean pentad, and their inter-annual standard
Fig. 14 Hovmöller diagrams for mean daily precipitation (in mm/
day), zonally averaged between 15°E and 15°W across the year (over the 1998–2008 period) using a 5-day running mean, for a ARC2, b TRMM, c GPCP, d 0.22° CanRCM4, e 0.44° CanRCM4, f CRCM5,
g MERRA, h 20CR, i NCEP and j ERA-Interim datasets. The mean
large-scale onset date (computed as the date when the mean precipita-tion in the 15°E–15°W; 8°N–16°N box turns greater than the mean
precipitation in the 15°E–15°W; 0°N–8°N box) for RCMs and rea-nalyses is indicated by a vertical red line in the corresponding panel, while the ARC2/TRMM/GPCP mean large-scale onset is indicated by
cyan/blue/green vertical lines presented in all the panels. The south border of the West Sahel region (i.e. 12°N) is highlighted by a hori‑