HAL Id: hal-02534009
https://hal.archives-ouvertes.fr/hal-02534009
Submitted on 17 Apr 2020
HAL is a multi-disciplinary open access
archive for the deposit and dissemination of
sci-entific research documents, whether they are
pub-lished or not. The documents may come from
teaching and research institutions in France or
abroad, or from public or private research centers.
L’archive ouverte pluridisciplinaire HAL, est
destinée au dépôt et à la diffusion de documents
scientifiques de niveau recherche, publiés ou non,
émanant des établissements d’enseignement et de
recherche français ou étrangers, des laboratoires
publics ou privés.
Simulation of microalgae growth in limiting light
conditions: Flow effect
Jeremy Pruvost, J. Legrand, P. Legentilhomme, A. Muller-Feuga
To cite this version:
Jeremy Pruvost, J. Legrand, P. Legentilhomme, A. Muller-Feuga. Simulation of microalgae growth
in limiting light conditions: Flow effect.
AIChE Journal, Wiley, 2002, 48 (5), pp.1109-1120.
BIO
ENGINEER1 NG, FOOD. AND NATURAL PRO DUCTS
Simulation
of
Microalgae Growth
in
Limiting
Light Conditions:
Flow Effect
J.
Pruvost,J.
Legrand, andP.
LegentilhommeGEPEA Laboratory, University of Nantes, CRm-IUT, F-44602 Saint-Nazaire Cedex, France
A. Muller-Feuga
PBA Laboratory, IFREMER, 44311 Nantes Cedex 3, France
Effect of hydrodynamical conditions
on a microalgae culture growth
wasinvestigated
in a photobioreactor with annular light chambers, with the focus on the relation be-
tween the cell displacement and the amount of light received by microorgankms, by
comparing two different flow conditions in light chambers: an axial flow generating a
poor radial mixing and a 3-0 swirling motion. To determine microorganism trajectories,
a
Lagrangian approach was retained, allowing light received to be considered from a
single microalga point
ofview. The light distribution was calculated using Beer
-Lam-
bert law, and a biological modeling
ofthe culture growth
wasproposed, with considera-
tion of light/dark cycle effects induced by cell displacement in the depth of the culture.
Finally, batch cultures of Porphyridium purpureum were simulated for both hydrody-
namical conditions in light chambers. The advantage of applying a three-dimensional
motion to generate cell renewal in front
ofthe light source, allowing microorganisms to
use light more efficiently) is clearly shown.
Introduction
Because of their taxonomic diversity, microalgae are found to synthesize various high-value organic compounds that can- not be produced by the usual microorganisms commonly em- ployed in bioreactors. Microalgae thus appear as a new natu- ral resource with potential industrial interest. But their pro- duction under controlled conditions implies a dedicated reac- tor design called photobioreactors, which mainly differ from classic bioreactors, that is, fermentors or enzymatic reactors, by the need for a light supply in addition to classic chemical growth substrates, because microalgae are photoautotrophic microorganisms (Richmond, 1986; Pulz and Scheibenbogen, 1998; Muller-Feuga et al., 1998a; Grima et al., 1999). But light cannot be considered as a classic substrate, because it involves two antagonist phenomena: a high amount of pho- tonic energy is requested to ensure microorganisms growth conditions, but the increase of the concentration in the pro- cess decreases the depth of light penetration in the culture, due to the cell self-shading. Light use by the culture is thus difficult to optimize and the microalgae concentration in the process remains limited, making it of too low economical in-
Correspondence concerning this article should be addressed to J. Legrand
terest for industrial applications (Grima et al., 1999; Janssen et al., 1999; Fernandez et al., 1997; Vonshak, 1997; Chen and Lee, 1997; Richmond, 1996). A research effort in engineering is needed to design optimized processes able to produce con- centrated microalgae cultures of high quality and of suffi- ciently high productivity.
A way to improve photobioreactor efficiency is to decrease the light limitation by increasing the intensity of the light supply. But microalgae, which grow naturally under the sea surface, are sensitive to high light intensity due to the so- called photolimitation phenomenon (Richmond, 1986; Grima et al., 1996). Because of the strong light gradient that appears in the culture, the amount of phototonic energy efficiently used is often very low: microalgae located near the light source are too highly illuminated, while those deeper in the culture and far from the light source do not receive enough light energy to ensure good photosynthetic conditions (Grima et al., 1996). Only an intermediate part of the culture is ide- ally illuminated. The solution of increasing the light supply is thus of limited value.
A more promising solution investigated in this study is to improve light availability by optimizing hydrodynamical con-
AIChE Journal May 2002 Vol. 48, No. 5 1109
ditions in the light chamber of the reactor. A three-dimen- sional (3-D) motion can be employed to promote a microal- gae displacement along the light gradient in the culture, al- lowing cell renewal in front of the light supply. There are some examples of photobioreactors where this kind of flow is involved, as in the work of Carlozzi and Torzillo (19961, who used a curved tubular geometry to generate secondary flow motion in bends (Dean-type vortices), while Miller et al. (1964) designed an annular photobioreactor with a rotating cylinder to induce Taylor-type vortices. However, only few studies have been done in order to accurately characterize the influence of hydrodynamics on microalgae light availabil- ity and photobioreactors efficiency, even though the benefi- cial effects of this parameter are already established. By studying the effects of flow rate, Richmond (1996) deduced the importance of generating a turbulent motion to improve the light access of flowing microalgae, and thus the produc- tivity of the photobioreactor. Other studies dealing with the influence of a turbulent motion are available (Chen and Lee, 1997; Carlozzi and Torzillo, 1996; Grima et al., 1999; Janssen et al., 1999; Grobbelaar, 1994; Thomas and Gibson, 19901, but it seems that the effects of a turbulent flow remain diffi- cult to characterize with accuracy in real culture conditions. An increase in the flow rate does not necessarily lead to an improved process efficiency, because some undesirable physi- ological responses of the microorganisms can arise. For ex- ample, microalgae are found to be especially sensitive to hy- drodynamic stress (Vandanjon et al., 1999; Jaouen et al., 1999; Baldyga and Pohorecki, 1998; Mitsuhashi et al., 1995; Car- lozzi and Torzillo, 1996; Gudin and Chaumont, 1991); also, an increase in mixing can lead to a negative effect on the culture growth. Thus, it is difficult to experimentally investi- gate the influence of a unique parameter such as hydrody- namics because of the complex biological behavior of mi- croalgae: a change in flow motion in the process does not only affect the light availability but can induce other uncon- trolled phenomena, like microorganism sensitivity to hydro- dynamical stress or mass-transfer modifications between cells and the surrounding medium (Grobbelaar, 1994; Merchuk et al., 1998).
The aim of this study is to focus on the interest of changing flow conditions in the process in order to improve the light availability, and thus its use by microalgae. Because mixing cannot be experimentally improved without generating addi- tional undesirable effects, the establishment of a photobiore- actor model is the way to decouple the influence of the dif- ferent parameters and to restrict our attention to the effect of three-dimensional flows on the improvement of light avail- ability for microalgae cultures. This approach should provide a first assessment of the theoretical benefit of applying a 3-D motion in such a photobioreactor, before attempting further optimization of the flow conditions to improve the light use in photobioreactors.
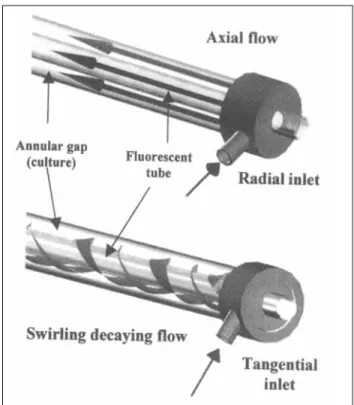
In the photobioreactor under study, light is provided in tubular geometries called light chambers that use fluorescent tubes to illuminate the surrounding culture (Figure 11, and the 3-D motion used here is an annular swirling decaying flow induced by a tangential inlet. Although other methods are available for generating 3-D motion in such geometries (guide vanes or direct rotation of the elements), a tangential inlet can be adapted to annular geometries using a rather simple
Figure 1. Annular light chamber.
design (Gupta et al., 1984; Legentilhomme and Legrand, 1990, 1991; Legentilhomme et al., 1993). Only the inlets of the pho- tobioreactor have to be modified to turn the axial flow into a 3-D swirling one. The tangential inlet and a sketch of the induced swirling flow are given in Figure 2.
The model developed in this work refers to some previous investigations that were specifically aimed at achieving the simulation of culture growth. Because these studies are de- scribed elsewhere, only general procedures will be summa- rized in the following sections, but complete descriptions can be found in corresponding articles (Pruvost et al., 2000, 2001, 2002). The present work focuses on the simulation procedure and especially on new aspects of the simulation, namely the determination of the light gradient as a function of the cul- ture concentration and the biological modeling of microalga Poiphyridium purpureum photosynthetic response. Finally, to characterize the influence of hydrodynamical conditions on
May 2002 Vol. 48, NO. 5
1110
Figure 2. Axial and swirling flows.
microalgae growth, batch cultures of P. puqureum will be
simulated in a light chamber using a swirling decaying flow. The same study is also performed in a photobioreactor light chamber characterized by an axial flow induced by a radial inlet, which is commonly used in photobioreactors of annular geometries (Figure 2). Such a flow involving the poor dis- placement of the microalgae along the light gradient, where the results in both hydrodynamical conditions are compared, will show the benefit of a 3-D displacement of microalgae in order to improve the light use.
Modeling of the Growth of Porphyridiurn purpureurn
Photobioreactor description
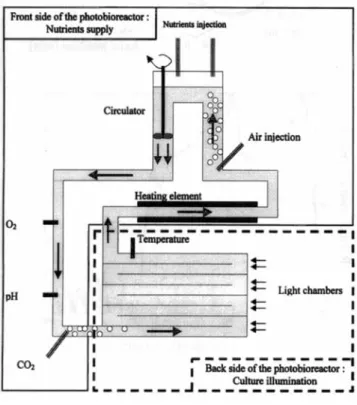
This study is applied to a photobioreactor patented by the French Research Institute for Exploitation of the Sea (IFREMER) (Muller-Feuga et al., 2000). The process was de- signed to make microalgae culture possible under fully con- trolled and axenic conditions, which are necessary for the production of high-value molecules. Further details on this process can be found in Muller-Feuga et al., 1998a,b). The photobioreactor is presented in Figure 3. Artificial light is provided in a series of eight annular geometries, so-called light chambers, each of which contains a central fluorescent tube that illuminates the surrounding culture flowing the an- nular gap. A circulation loop is used in the photobioreactor, where the culture crosses each of the eight light chambers at the rear of the photobioreactor in succession and then moves to the dark front side, where nutrients and substrates are provided. The light chambers are 1.5 m long, and the diame- ters of internal and external cylinders are 40 mm and 100 mm, respectively, which corresponds to an annular gap width of 30 mm.
Figure 3. Photobioreactor.
AIChE Journal
Previous investigations of hydrodynamical characteristics were carried out in an experimental setup that reproduces one of the photobioreactor light chambers. Measurements of the hydrodynamical characteristics were made using the par- ticle image velocimentry (PIV) technique for the flow rate,
Q
= 1,190 L - h - ' . Both the axial and swirling flows were in- duced by alternating inlet conditions, which are, respectively, radial, with a diameter of 65 mm, and tangential, with a di- ameter of 45 mm. The measurement of hydrodynamical val- ues using PIV is described in Pruvost et al. (2000).Photobioreactor modeling: the Lagrangian approach Attempts at modeling photobioreactors mainly investigate the influence of parameters such as pH or nutrient concen- tration, which can be assumed to be homogeneously distribu- tion (Frohlich et al., 1983; Yokota et al., 1994). But the same assumption cannot be applied to light because of the light attenuation. If the light influence is approximated, the model efficiency remains limited, as shown by Grima et al. (19961, who pointed out that difficulties arise for photobioreactors scaleup. This is mainly due to the biological photosynthetic response of microalgae, which is very sensitive to the condi- tions of light reception. The culture in the light chamber has a depth for which the light received by the microalgae is opti- mal, with photoinhibition for positions nearer the light source, and too little illumination deep inside the culture (Merchuk et al., 1998). An accurate representation of microorganism growth is not obtained when a mean illumination intensity is considered because of the difference in physiological behav- ior in the same culture due to the light gradient. Thus, both microalgae motion and light distribution in a model must be considered.
The experimental investigation using PIV has shown the complex behavior of the swirling flow field due to the three- dimensional motion involved and the free decay of the swirl intensity along the axial coordinate, making hydrodynamical conditions not fully developed and asymmetric (Pruvost et al., 2000). A Lagrangian approach allows the calculation of accu- rate microorganism trajectories in the light chambers, start- ing from the entrance of each light chamber and then deter- mining the successive positions followed by a microalga. The light received by a microalga can be deduced, giving an accu- rate relation between hydrodynamics and the received en- ergy. A method was developed for calculating the trajectories (Pruvost et al., 2002), using the results of the PIV flow-field measurements (Pruvost et al., 2000).
For microorganisms having the same density as the fluid, effects of mass or buoyancy forces on trajectories were ne- glected. Correction of pathlines that arises when particles are of greater size than the smallest flow eddies also were not considered (Ormancey and Martinon, 1984), cells size being ca. some tens of micrometers, with the smallest eddy size given by the Kolmogorov scale ca. a hundred micrometers in duct flows (Bradshaw, 1971). It was thus assumed that microalgae follow the same trajectories as elementary fluid particles, and the method described in Pruvost et al. (2002) was applied without correction.
Because of the spatial dependency of the swirl motion, the Lagrangian approach requires knowledge of the flow-field characteristics on the entire geometry, which were recon-
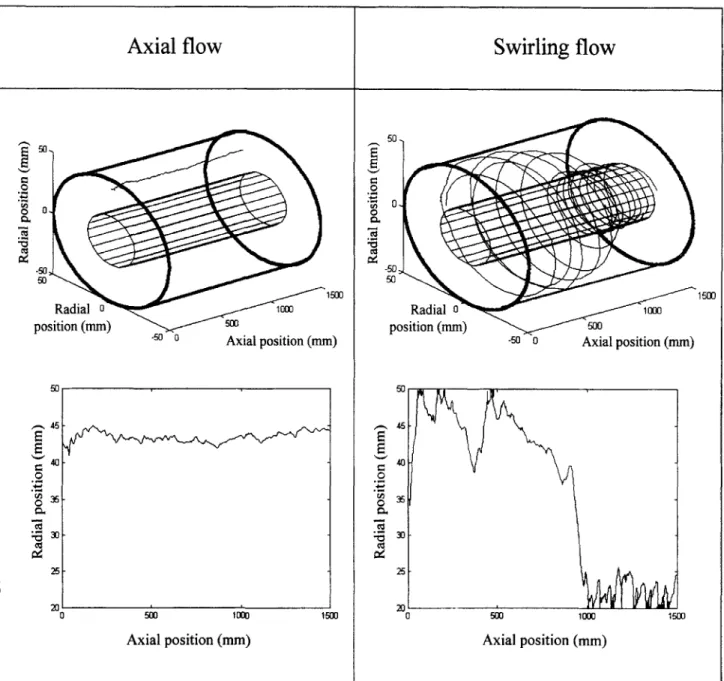
structed from PIV data with an interpolation method based on a neural-network technique with radial basis function. Un- like the classic numerical interpolating scheme, the neural- network technique considers the nonlinear evolution of data (Powell, 1987) as it occurs in a 3-D flow field. An efficient reconstruction of the evolution of hydrodynamical quantities can be obtained using only a small number of the original values. Pruvost et al. (2001) have used this method with PIV measurements to determine the swirling decaying flow char- acteristics in the entire geometry. A mathematical represen- tation of the mean velocity and turbulent intensity for the three components of the velocity field was finally obtained, allowing the fluid trajectories to be calculated. Two examples of trajectories are given in Figure 4, one for the swirling mo- tion and the second for the axial one. Significant differences between the two trajectories appear, regarding the displace-
ment along the radial coordinate (i.e., along the light gradi- ent) in particular. A cell renewal can be expected in swirling flows, whereas the axial flow involves the main displacement parallel to the light-chamber axis.
Modeling of the light received by microalgae
If light is considered the only limiting parameter, microal- gae growth depends on the amount of photonic energy re- ceived for the photosynthesis process. To determine this en- ergy, the light distribution in the culture has to be calculated first. Many studies are available in the literature for photo- chemical reactors, and specific references can be found in Cassano et al. (1995) or in our previous study (Pruvost e t al., 1999). Common methods developed for photoreactors are ap- plicable in the photobioreactor case (Yokota et al., 1994;
Axial
flow
position (mm) w m -50 0 Axial position (mm) I 20 05
m 1mOAxial
position(mm)
ISwirling flow
position (mm) -50 0 Axial position (mm) Axial position (mm)Figure 4. Examples of trajectories obtained using the Lagrangain calculation method.
Grima et al., 1906; Fernandez et al., 1997). The complexity of
determining the light distribution is directly linked to the ge- ometry of the reactor and the position of light source sup- plies. In the case of the photobioreactor under study, this problem remains simple because of the cylindrical symmetry involved in the use of fluorescent tubes axially centered in the annular light chambers. For the given culture concentra- tion and position in the geometry, the light distribution in the culture is a function of both the light-emitting source and the absorbing medium. For photobioreactor applications, the light attenuation in the culture is commonly represented by the so-called Beer-Lambert law (Muller-Feuga et al., 1998b; Grima et al., 1996, 1999; Frohlich et al., 1983; Pulz and Scheibenbogen, 1998; Cornet et al., 1995; Lee, 1999). How- ever, this approach can remain too simple for microalgae cul- ture because light absorption is considered without scattering effects. The influence of scattering effects depends on the optical properties and sizes of the cells and of the microalga species cultivated. If those scattering effects cannot be ne- glected, other models are available (Cornet et al., 1998; Cas- sano et al., 1995). but the benefit of using the Beer-Lambert law, which represents light attenuation with a rather simple equation, is lost. Indeed, a complete formulation with accu- rate representation of the scattering effects can involve a nu- merical resolution, with finite difference method, for in- stance, making light distribution time-consuming and difficult to obtain (Cornet et al., 1998; Cassano et al., 1995). Interme- diate solutions can be found in the literature. For example, by assuming that scattering occurs in microalgae culture only along the axis of light propagation, Cornet et al. (1995) pro- posed a simplified solution of the radiative transfer equation. But for such an approach, the scattering properties of mi- croalgae have to be known, and these are difficult to measure experimentally. For this reason, and because the aim of this study is to investigate the influence of hydrodynamical condi- tions on cell light accessibility and on culture growth, the Beer-Lambert law was used only in the first assumption. The
M
c
Emitting wavelength (nm)
(a)
simple representation of light attenuation allows rapid calcu- lation of the light received by cells, which is important for the proposed Lagrangian simulation of culture growth that in- duces the photonic energy distribution to be redetermined for each new evolution of the culture concentration. Finally, as shown later, the exponential decrease of light intensity with the increase in culture concentration obtained by using the Beer-Lambert law will be experimentally observed in real culture conditions, allowing an accurate representation of the light distribution.
Because of the cylindrical geometry, the light attenuation in the Beer-Lambert law can be assumed to only occur in the radial direction. For polychromatic light sources like fluo- rescent tubes, the light spectrum is divided into wavelength intervals, and the Beer-Lambert law is then expressed by
where r is the radial position in the geometry, R , is the ra- dius of the internal cylinder of the annular light chamber, C is the culture concentration expressed in dry weight, I ( r , A A) and I,(AA) are, respectively, the light intensity received at a position r and emitted by the light source for a given wave- length interval A h , and is the absorption coefficient for the wavelength interval AA.
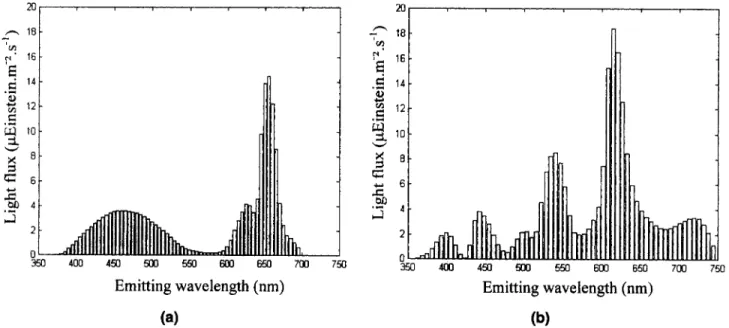
Two types of fluorescent-tube light sources are used in the studied photobioreactor: daylight tubes and Grolux tubes from Sylvania. They are both the same length (1.5 m), but their light spectra differ; these were chosen for their comple- mentary stimulation of microalgae photosynthesis pigments. The light spectra of both sources are given in Figure 5 : the light-emitting power of Grolux- and daylight Satin-type tubes being, respectively, 175 pEinstein -m-2.s-1 and 236 pEin- stein * m-* * s-
'.
are a function of the absorbing medium. Values of were determined for the P. pur-
Absorption coefficients 20 -n 18 16 v!
E
.fj
14o!
c"
12y
10r 8
z
-9 4
.c( W = 6 4 2 0 3 3 400 4 9 g)o 550 6m 650 700Emitting wavelength (nm)
(b) 0Figure 5. Emitting spectra of both light sources discretized on emitting wavelength intervals: (a) Grolux-type tube; (b) satin-type tube.
May 2002 Vol. 48, No. 5 1113
3
?
,
<
350 400 450 500 553 600 650 700 750Wavelength
(nm)
Figure 6. Absorption coefficients obtained on emitting wavelength intervals.
pureurn culture by using a spectrophometer to measure the
absorption spectra of some microalgae aliquots of different dry-weight concentrations. These values were next deduced from the following equation:
DO,
,
= E, ,Cl, (2)where DO,, is the optical density measured for the wave- length interval A A , and I, is the length of the spectropho- tometer measurement cell ( I , = 1 cm).
By measuring the experimental absorption spectra for dif- ferent dry-weight culture concentrations, the values of el, plotted in Figure 6 were obtained by linear fitting with an error of less than 10% on the experimental results. The depth of light penetration in the culture can be deduced for each wavelength interval, A A, for a given dry-weight concentration C. Figure 7 shows an example of the light-emitting spectrum evolution obtained for C = 0.5 g.L-'. The global value of the light intensity Z(r) that is received by a microalga located
Experimental values 0 3
'2
0 m L I ?Culture concentration
(g.1-I)
Figure 8. Beer-Lambert law results vs. experimental measurements.
at a given position r is calculated as follows:
The light-attenuation model is experimentally verified by determining the amount of light not absorbed by the culture.
A quantum LICOR meter, located on the light chamber's
outer cylinder and measuring in the photosynthetically active radiation (PAR) domain, was used to determine the transmit- ted amount of light for some culture dry-weight concentra- tions, and theoretical values of the light intensity were achieved by simply setting r = R , in Eq. 3, where R , is the radius of the external cylinder of the annular geometry. Cal- culated and experimental data are compared in Figure 8. It appears that the Beer-Lambert law overestimates the cul- ture's real light absorption. This was already observed by Fer- nandez et al. (1997) for modeling light attenuation by the
" E l 5 &
s
l o2
.-
.- iri A 5 v 0 50 800Radial position (mm) 20 300 Wavelength (nm)
(a)
(b)
Figure 7. Emitting spectra attention in the culture for C = 0.5 g.L-': (a) Grolux-type tube: (b) satin-type tube.
May 2002 Vol. 48, NO. 5 AIChE Journal
2o 0 2 0 4 0 6 0 8 1 1 2 1 4 1 6 1 8 2
Culture concentration (g.1-l)
Figure 9. lsovalues of light flux (in pEinstein-m
-*.s-')
obtained for the Grolux-type tube in the cul- ture as a function of culture dry-weight con- centration and radial position.
Beer-Lambert law in the case of microalgae cultures. Devia- tion from the Beer-Lambert law is explained by the assump- tions used for its establishment, such as negligible scattering effects due to reflecting particles, and a constant direction of the light beams while crossing the absorbing medium. As ex-
plained before, these conditions cannot be fulfilled in mi- croalgae culture because of the scattering effects and an im- portant light-diffusion, which depends on the optical proper- ties of the culture (Fernandez et al., 1997; Cassano et al., 1995; Cornet et al., 1998). Nevertheless, the Beer-Lambert law's principle that there is an exponential decrease in light intensity remains applicable: only absorption coefficients are overestimated. If Eq. 3 is modified to accurately repre- sent the real light absorption, a good approximate represen- tation of the light attenuation can be obained as follows:
(4)
I(,.,,-)
= '~),,(AA). 1 0 - ' c o r v ~ - 1 ~ ~ C ( r - R 2 )A A
where I,,,, is a correction term that is determined from the experimental values found in Figure 8.
Results calculated using t,,,, = 0.45 are presented in Fig- ure 8. Good agreement between the experimental data and the modified Beer-Lambert law is observed. Thus Eq. 4 will be used to determine the light intensity in the
P.
purpureum culture as a function of radial position and the dry-weight concentration of the culture. Results are presented in Figure 9 for the Grolux-type fluorescent tubes.Biological modeling of the growth of Porphyridium purpureum
The growth of the culture can be obtained by using a bio- logical growth model that gives the growth rate, p, as a func- tion of the light intensity received, I. Some authors (Grima et al., 1996, 1999; Muller-Feuga, 1998; Pulz and Scheinbenbo- gen, 1998) have proposed different expressions of the p(Z)
function. A representative description and comparison can be found in Muller-Feuga (1998, who proposed a model that
May 2002 AlChE Journal x 18, 1 Figure 10. 500 1000 1500
Light flux
(pEinstein.m'2.s'')
Culture-specific growth rate p(1) using the Muller-Feuga (1 998) equation fitted with data from Dermoun et al. (1992) for P. purpureum
at 25°C.
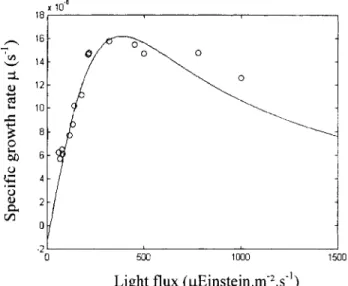
was established for P. purpureum. The model expresses the main aspects of the photosynthetic response of the microal- gae to light, namely, the photoinhibition of the cells to high values of I, and the weight loss that occurs below a certain I value called the compensation light energy, I,. The mathemati- cal expression of this model is
where t is time, p =
Z/Z3
is the normalized light intensity, pe =ZJZ,
is the normalized light intensity compensation, I, is the light intensity received at saturation, and ps is the spe- cific growth rate at saturation. The three required parame- ters, I,, I,, and ps, were deduced from the experimental re- sults of Dermoun et al. (1992), obtained for P. purpureum at 25°C. The used light intensity range was substituted into Eq.5 (i.e., I less than 236 pEinstein.m-2.s-1), giving I , = 15 pEinstein-m-*-s-', I, = 385 pEinstein.m-2-s-', and pS = 16X 10V6.sV'. The corresponding results of the growth rate are presented in Figure 10.
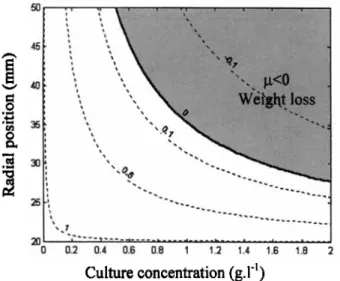
By using Eq. 4 to determine the light intensity Z(r, C ) , the specific growth rate p(I) can be deduced as a function of the culture's dry-weight concentration, and Eq. 5 can be used to deduce the radial position. Results are shown in Figure 11 for the Grolux-type, and it can be seen that for high culture concentrations, regions with negative growth rate are located deep in the culture. However, using Eqs. 4 and 5 to deter- mine the growth rate of the culture, /&), is not sufficient to represent the real microalgae photosynthetic growth, because the biological response as represented by Eq. 5 can be ap-
plied only to a low culture concentration, for which there is no self-shading of cells to allow each microalga to receive constant illumination. It is well known that microalgae in photobioreactors are subject to light intensity variations due to the light gradient related to cell self-shading and to mi-
cell remains in that region was shorter than 6 s, and the pre- vious illumination period was greater than 27 s. The effect of light/dark cycles on growth rate is shown in Figure 12.
0 c E
5
&
!G 8 a m.-
8
B
.%...
L
...
I T > 2 7 s T = 6 s:
.
Time-<
s
...
Figure 11.Culture
concentration
(g.1-l)
lsovalues of the culture specific growth rate (in
s-’)
for the Grolux-type tube as a func- tion of culture dry-weight concentration and radial position.croalgae displacement. The model was modified to take these effects of light variations on microalgae growth into account. Photosynthesis appears as a complcx dynamic mechanism that results in various physiological responses to adapt and protect microalgae, for instance, from light variations (Vonshak, 1997). In particular, this is the so-called light/dark cycle effects, as observed in many studies (Grobbelaar, 1994; Grobbclaar et al., 1996; Lee and Lee, 2001; Pulz and Scheibenbogen, 1998; Merchuk et al., 1998; Janssen e t al., 1999). Merchuk e t al. (1998) have emphasized a particular biological behavior by P. purpureurn. By investigating the in- fluence of dark and light periods on culture growth, these authors found that this species has the capacity to remain for a while in dark Lones without loss of productivity. They ex- plained that phenomenon by a particular mechanism of the photosynthetic apparatus, which appears to be regulated by a protein named D1 (Aro et al., 1993). If a cell stays in a too highly illuminated rcgion, D1 proteins are destroyed, which breaks the photosynthetic mechanism chain and leads t o ccs- sation of cell growth. Fortunately, these proteins are continu- ously synthesizcd by the microorganism, and after good illu- mination conditions are renewed, the photosynthetic system repairs itself. By allowing cells to flow in dark zones for a while, full destruction of the D1 protein is avoided and the photosynthetic apparatus remains effective (Merchuk e t al., 1998; Janssen et al., 1999). The presence of dark zones in photobioreactors is not necessarily negative, but corresponds to the culture’s biological need for its photosynthetic appara- tus to recover (Muller-Feuga e t al., 199%; Grima et al., 1996). Following these findings, the Muller-Feuga model was adapted to take into account high concentration conditions according to the values obtained by Merchuk et al. (1998) for
P.
pulpureurn, who stated that a dark period of 6 s following a light period longer than 27 s did not influence the photo- bioreactor productivity. Thus, it was assumed in the final bio- logical modeling that no negative growth rate p was achieved in the dark area of the culture if thc period during which the1116 May 2002
Simulation procedure
The culture growth simulation algorithm is based o n the Lagrangian trajectory calculation method. For batch-type cul- tures, Eq. 5 gives the increase in the culture’s dry-weight con- centration, C, which is determined for each time step, A t , of the Lagrangian trajectory calculation by
C( t
+
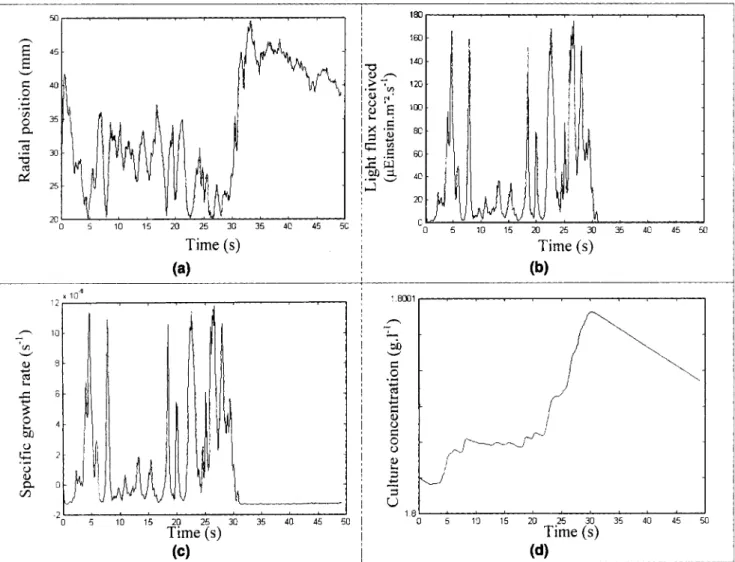
A t j = C( t jexp( p( t j A t j (6) where p ( t ) is determined using the previous biological mod- eling.Coupling between the trajectory calculation and thc biolog- ical model is shown in Figure 13, where a single light-cham- ber passage is presentcd for the swirl motion and for the Grolux fluorescent tube. In this example, the dry-weight con- centration of the culture at the entrance of the light chamber is set to a value at which a dark region occurs, namely, C = 1.8 g . L-’. For each successive position of the microorganism trajectory (Figure 13a), the light received by the cell is deter- mined using Eq. 4 (Figurc 13b) and the resulting growth rate deduced from the biological model described in the previous scction (Figure 13c). This results in an increase in the dry- weight concentration (Figure 13d). This is a step-by-step sim- ulation wherein flow field, light availability, and growth inter-
Light period Dark period Light period
0 c
...
...
2f
&
5 al c 0, Time...
v w -
Positivegrowth rate growth rate growth rate
Biological modeling without Lightmark cycles consideration
Light period Dark period Light period
~
A
-I
I
I
-growth rate g r o h rate growth rate
Biological modeling with Light/Dark cycles consideration
Figure 12. Light/dark cycles consideration in the bio-
logical modeling.
I
n
I
Time (s)
(a)
J 0 5 10 15 25 30 35 40 45 50&ne
(s)(c)
180, , , , , ITime
(s)
(b)
Figure 13. Example of progressive determination of the culture growth using the Lagrangian approach.
(a) Radial displacement of the microalga obtained with Lagrangian trajectory determination; (b) light received by the microalga calculated using Eq. 4 corresponding to the radial displacement; (c) photosynthetic response of the microalga obtained using the biological model; (d) evolution of the culture dry-weight concentration deduced from Eq. 6 and the biological model.
act: for each position of the microalga, the resulting increase in dry-weight concentration (Eq. 6) changes the light distribu- tion in the culture (Eq. 41, which modifies the biological
growth response p(Z), and thus the concentration evolution
(Eq. 6). For this example, it can be stated that the microalga
stays deep in the culture longer than 30 s, receiving too little photonic energy to sustain a sufficient photosynthetic growth activity, which leads to negative values of the growth rate, and thus a decrease in culture concentration.
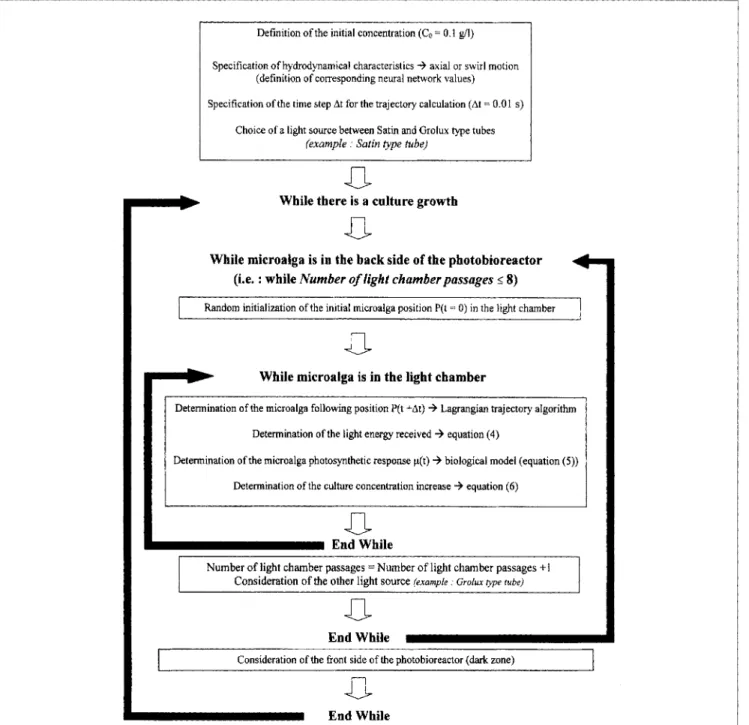
Complete batch culture simulations in the photobioreactor are achieved by adding loop circulation to the process and repeating the trajectory calculations, as described by the global algorithm given in Figure 14. The evolution of the cul- ture's dry-weight concentration is simulated by considering the successive passages in the eight light chambers, alternatively set with both types of light sources, followed next by the cul- ture's entry into the front side of the process, where n o light is supplied. This last part of the process is thus considered to be a dark region, which has a residence time of Td = Q/V,, where Q is the flow rate in the process and Vd = 22 L is the front-side volume. Simulation being achieved for Q = 1,190
L . h - ' , Td is thus a fixed period of 66 s. For each new light
chamber crossed, the radial and circumferential positions in the entrance of the annular geometry are randomly initial- ized before applying the Lagrangian calculation method of a microalga trajectory.
Batch-type cultures were simulated for both axial and swirl motions by determining the increase in dry-weight concentra- tion until a limited value of concentration was reached. The time step, At, needed for the Lagrangian calculation of suc- cessive microalga position was set at At = 0.01 s, which was found to give accurate results (Pruvost et al., 20021, and the value of the culture's dry-weight concentration was initialized to
c,
= 0.1 g * L - ' .Results
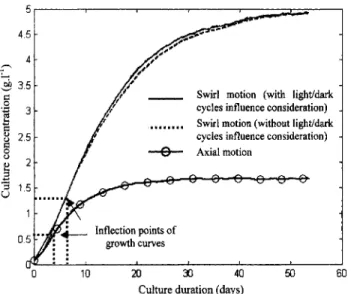
and DiscussionMicroalgae culture growth has been simulated (Figure 15) by considering both axial and swirling flows in the light cham- bers. Each curve is obtained by simulating around 100,000 passages in the light chambers. To demonstrate the influence of light/dark cycles in the biological model, an additional
simulation was made using the swirling motion, but without taking the light/dark cycles into account.
A typical batch culture evolution is represented o n the dif- ferent simulation curves: an initial exponential growth, fol- lowed by the effects of limited available light, which de- creases the growth rate until the culture’s dry-weight concen- tration is finally stabilized. The amount of available light de- creases with the increase in the culture’s dry-weight concen- tration, until the attenuation is too high to give sufficient light to microalgae to ensure their photosynthetic growth.
Light/dark cycles have a negligible effect on microalgae growth (Figure 15). Only a slight difference can be observed
between both curves. Due t o the ability of microalgae to re- main in dark zones without weight loss, considering the ef- fects of the light/dark cycles leads naturally to a better global culture growth rate, but only in a poor manner and for a restricted part of the growth curve: no influence is seen for low and high culture concentrations. For a small concentra- tion of organisms at the beginning of the culture’s growth, the light is not yet a limiting patameter, while the amount of light received by microalgae is greatly reduced for high concentra- tions. But the biological modeling assumes that an earlier pe- riod of illumination greater than 27 s is necessary to ensure no negative growth rate for the culture. This condition is not
Deftnition of the initial concentration (C, = 0.1 gil)
Specification of hydrodynamical characteristics
+
axial or swirl motion (definition of corresponding neural network values) Specification of the time step At for the trajectory calculation (At = 0.01 s)Choice of a light source between Satin and Grolux type tubes
(example : Satin type tube)
0
0
-
While there is a culture growthWhile microalga is in the back side of the photobioreactor (i.e. : while Number of light chamberpassages 5 8)
Random initialization ofthe initial microalga position P(t = 0) in the light chamber
-0-
-
While microalga is in the light chamberDetermination of the microalga following position P(t +At) 3 Lagrangian trajectory algorithm Determination of the light energy received
+
equation (4)Determination of the microalga photosynthetic response p(t) 3 biological model (equation ( 5 ) ) Determination of the culture concentration increase 3 equation (6)
End While
Number of light chamber passages =Number of light chamber passages + I
Consideration of the other light source (example. G r o l u type rube)
0-
End While
Consideration of the front side of the photobioreactor (dark zone)
0
End While
Figure 14. Global algorithm for batch culture simulations.
-
Swirl motion (with lighvdark cycles influence consideration) Swirl motion (without lightldark cycles influence consideration),
.
..
,..
, ,-8- Axial motion
Conclusion
Simulations of batch cultures of P. purpureurn were achieved in a photobioreactor with circular light chambers. Attention was focused on the effects of hydrodynamical con- ditions on the light availability and the growth of microalgae by comparing two kinds of flow: an axial one, which induces a poor mixing although it is commonly used in such geometries, and a swirling decaying flow, which generated a 3-D motion. A Lagrangian approach was used to follow microalga dis- placement in the light chamber to determine the amount of light received by the microorganisms. The Beer-Lambert law, modified to consider light diffusion and the scattering effects of the microalgae culture, was used to calculate light distribu- tion as a function of the culture’s dry-weight concentration. Finally, a biological model that included light/dark cycles
. .
. .
I I adapted for the P. purpureum microalgae was proposed and0 10 20 30 40 50 60
Culture duration (days) then related to the trajectory and light distribution calcula-
tions.
Figure 15. Batch cultures simulations with both axial and swirling motion in light chambers.
repeated in large culture concentrations, so considerations of light/dark cycles have no effect on the culture growth. Obvi- ously, modeling is dependent on time values chosen to repre- sent the influence of the D1 protein. But comparison of the curves obtained with and without light/dark cycles shows that this aspect has very little influence. On the contrary, results achieved with both hydrodynamical conditions are very dif- ferent. The flow effect on microalgae growth is mainly linked to the trajectories involved, which provide different condi- tions for cell renewal in the presence of the light supply.
By considering the results shown in Figure 15 for both hy- drodynamical conditions, the advantage of the swirling flow over the axial one is clearly observed. This demonstrates that hydrodynamical conditions have a fundamental influence on the culture growth. Three-dimensional flows, like the swirling one, cause trajectories that allow the culture to grow faster, while enhancing the value of the limiting dry-weight concen- tration. As shown in Figure 4 for axial flow, a microalga en- tering the light chamber in an initial position located deep in the culture remains at the same distance from the light source during its journey. Thus, if the culture is concentrated, the weight loss is important. This is not the case in swirling flow as the three-dimensional trajectory allows each microalga to receive light even in a concentrated culture. This explains why the difference between both flows increases with the dry- weight concentration: the light attenuation effects are greater for high concentrations. The axial flow does not allow the process to be used optimally, and one way to improve the performance is to impose hydrodynamical conditions that move in the direction of the light gradient. Cell renewal in front of the light source allows sufficient light to ensure good photosynthesis conditions, even when the light doesn’t pene- trate very deep into the culture. We can conclude that a 3-D flow delays the appearance of the light limitation, which is observed at the inflection points in Figure 15, characterizing the change in growth evolution. For the axial flow, light ap- pears as a limiting parameter for dry-weight concentrations greater than 0.6 g.L-’, while a value of 1.3 g.L-’ is ob- tained for the swirling flow.
Comparison between axial and swirling motions has shown the advantage of generating 3-D flow fields to decrease the effects of the limited light when the culture concentration increases. By investigating the swirl motion with and without including light/dark cycles, it appeared that this particular photosynthetic behavior of the microalgae doesn’t have much of an effect on the resulting growth. By allowing cell move- ment along the light gradient, the light absorbed by each mi- croalga is improved in the swirl flow, which lessens the ef- fects of light attenuation and leads to a higher limiting value for the dry-weight concentration.
The photobioreactor model focused on the effect of the change in flow conditions on available light for the culture. Under actual conditions, the culture is exposed to other lim- iting parameters, such as nutrients. But, because the influ- ence of each limiting parameter remains difficult to study in nature, simulations are essential for understanding the oper- ation of photobioreactors. For example, increasing the growth rate using 3-D flows alters the cells’ nutritional needs, which then could replace light as the limiting parameter. The mi- croalgae culture is thus the result of an overall set of interact- ing parameters, all of which are not completely identified. Simulation is thus complementary to experimental studies on microalgae culture and provides a better understanding of a selected parameter, which is essential for fully understanding the overall complex running of a photobioreactor and allows optimization of such a process.
Literature Cited
Aro, E. M., I. Virgin, and B. Anderson, “Photoinhibition of Photo- system 11. Inactivation, Protein Damage and Turnover,” Biochim. Biophys. Actu, 1143, 113 (1993).
Baldyga, J., and R. Pohorecki, “Influence of Turbulent Mechanical Stresses on Microorganisms,” ASME Appl. Mech. Reu., 51(1), 121
(1998).
Bradshaw, P., An Introduction to Turbulence and Its Measurement,
Pergamon Press, Oxford (1971).
Carlozzi, P., and G. Torzillo, “Productivity of Spinrlinu in a Strongly
Curved Outdoor Tubular Photobioreactor,” Appl. Microhiol.
Biotechnol., 45(1-2), 18 (1996).
Cassano, A,, C. Martin, R. Brandi, and 0. Alfano, “Photoreactor Analysis and Design: Fundamentals and Applications.” Ind. Eng. Chem. Res., 34, 2155 (1995).
Chen, K. W., and Y. K. Lee, “Growth of Chlorella Outdoors in a Changing Light Environment,” J. Appl. Phycol.. 9, 425 (1997).
Cornet, J. F., C. G. Dussap, and J. B. Gros, “A Simplified Monodi- mensional Approach for Modeling Coupling Between Radiant Light Transfer and Growth Kinetics in Photobioreactors,” Chem.
Eng. Sci., 50(9), 1489 (1995).
Cornet, J. F., C. G. Dussap, and J. B. Gros, “Kinetics and Energetics of Photosynthetic Micro-Organisms in Photobioreactors-Applica- rion to Spirulina Growth,” Adu. Biochem. Eng. Biotechnol., 59, 153 (1998).
Dermoun, D., D. Chaumont, J. M. Thebault, and A. Dauta, “Model- ing of Growth of Porphyridium cruentum in Connection with Two
Interdependent Factors: Light and Temperature,” Bioresour. Tech-
noL, 42, 113 (1992).
Fernandez, A. F. G., G. F. Camacho, S. J. A. Perez, F. J. M. Sevilla, and M. E. Grima, “A Model for Light Distribution and Average Solar Irradiance Inside Outdoor Tubular Photobioreactors for the Microalgal Mass Culture,” Biotechnol. Bioeng., 55(5), 701 (1997).
Frolich, B. T., I. A. Webster, M. M. Ataai, and M. L. Shuler, “Photo- bioreactors: Models for Interaction of Light Intensity, Reactor De- sign, and Algal Physiology,” Biotechnol. Bioeng. Symp., 13, 331 (1983).
Grima, M. E., A. F. G. Fernandez, G. F. Camacho, and Y. Chisti, “Photobioreactors: Light Regime, Mass Transfer, and Scaleup,” J.
Biotechnol., 70, 231 (1999).
Grima, M. E., F. J. M. Sevilla, J. A. S. Perez, and F. G. Camacho, “A Study on Simultaneous Photolimitation and Photoinhibition in Dense Microalgal Cultures Taking into Account Incident and Av- eraged Irradiances,” J. Biotechnol., 45, 59 (1996).
Grobbelaar, J. U., “Turbulence in Mass Algal Cultures and the Role of Lightmark Fluctuations,” J. Appl. Phycol., 6, 331 (1994). Grobbelaar, J. U., L. Nebdal, and V. Tichy, “Influence of High
Lightmark Fluctuations on Photosynthetic Characteristics of Mi- croalgae Photoacclimated to Different Light Intensities and Impli- cations for Mass Algal Cultivation,” J. Appl. Phycol., 8, 335 (1996). Gudin, C., and D. Chaumont, “Cell Fragility: The Key Problem of
Microalgae Mass Production in Closed Photobioreactors,” Biores.
Technol., 38(2-3), 145 (1991).
Gupta, A. K., D. C. Lilley, and N. Syred, Swirl Flows, Abacus Press, Cambridge (1984).
Janssen, M. G. J., T. C. Kuijpers, B. Veldhoen, M. B. Ternbach, J. Tramper, L. R. Mur, and R. H. Wijffels, “Specific Growth Rate of
Chlamydomonas reinhardtii and Chlorella sorokiniana Under
Medium Duration Light/Dark Cycles 13-87 s,” J. Biotechnol., 70,
323 (1999).
Jaouen, P., L. Vandanjon, and F. QuCmCneur, “The Shear Stress of Microalgal Cell Suspensions (Tetraselmis suecica) in Tangential Flow Filteration Systems: The Role of Pumps,” Biores. TechnoL. 68, 149 (1999).
Lee, C. G., “Calculation of Light Penetration Depth in Photobiore- actors,” Biotechnol. Bioprocess Eng., 4, 78 (1999).
Lee, K., and C. G. Lee, “Effect of Lightpark Cycles on Wastewater Treatments by Microalgae,” Biotechnol. Bioprocess Eng., 6, 194 (2001).
Legentilhomme, P., H. Aouabed, and J. Legrand, “Developing Mass Transfer in Swirling Decaying Flow Induced by Means of a Tan- gential Inlet,” Chem. Eng. J., 52, 137 (1993).
Legentilhomme, P., and J. Legrand, “Overall Mass Transfer in Swirling Decay Flow in Annular Electrochemical Cells,“ J. Appl.
Electrochem., 20, 216 (1990).
Legentilhomme, P., and J. Legrand, “The Effects of Inlet Conditions on Mass Transfer in Annular Swirling Decaying Flow,” Int. J. Heat
Mass Transfer, 34, 1281 (1991).
Merchuk, J. C., M. Ronen, S. Giris, and S. Arad, ”Lighwark Cycles in the Growth of the Red Microalga Porphyridium sp. ,” Biotechnol. Bioeng., 59(6), 705 (1 998).
Miller, R. L., A. G. Fredrickson, A. H. Brown. and H. M. Tsuchiya, “Hydromechanical Method to Increase Efficiency of Algal Photo- synthesis.” Ind. Eng. Chem. Proc. Des. Deu., 3, 134 (1964). Mitsuhachi, S., K. Hosaka, E. Tomonaga, H. Murarnatsu, and K.
Tanishita, “Effects of Shear Flow on Photosynthesis in a Dilute Suspension of Microalgae,” Appl. Microhiol. Biotechnol., 42, 744 (1995).
Muller-Feuga, A., “Growth as a Function of Rationing: A Model Applicable to Fish and Microalgae,” J. Exp. Mar. Bid. Ecol., 236, 1 (1998).
Muller-Feuga, A., R. Le Guides, A. HervC. and P. Durand, “Con- parison of Artificial Light Photobioreactors and Other Production Systems Using Porphyridium cruentum,” J. Appl. Phycol., 10, 83 (1998a).
Muller-Feuga, A., R. Baron, R. Le GuCdes. and E. Michel, “Theo- retical Assessment of Productivity in Photobioreactors by Radia- tive Transfer Approach,” Marine Micro-Organisms for Industry, Ifre- mer Editions, Brest. France, p. 194 (1998b).
Muller-Feuga. A,, J. Legrand. J. Pruvost, P. Legentilhomme, and R.
Le Guides, “ProcCdC pour AmCliorer le Transfert dans une Chambre de BiorCaction,” Ifremer and Nantes-University French Patent No. 00-08587 (2000).
Ormancey, A., and J. Martinon, “Prediction of Particle Dispersion in Turbulent Flows,” Phys. Chem. Hydrodynam., 5(3/4), 229 (1984). Powell, M. J. D., “Radial Basis Functions for Multivariate Interpola-
tion: A Review,” Algorithms forilpproximation. J. C. Mason and M.
G. Cox, eds., Clarendon Press, Oxford (1987).
Pruvost, J., J. Legrand. and P. Legentilhomme, “Transfert Pho- tonique dans un Photoriacteur B Ecoulement Tourbillonnaire,”
Can. J. Chem. Eng., 77, 869 (1999).
Pruvost, J., J. Legrand, P. Legentilhomme, and L. Doubliez, “Par- ticle Image Velocimetry Investigation of the Flow-Field of a 3D Turbulent Annular Swirling Decaying Flow Induced by Means of a Tangential Inlet,” Exp. Fluids, 29(3), 291 (2000).
Pruvost, J., J. Legrand, P. Legentilhomme, and A. Muller-Feuga, “Lagrangian Trajectory Model for Turbulent Swirling Flow in an Annular Cell. Comparison with Residence Time Distribution Mea- surements,” Chem. Eng. Sci., 57(7), 1205 (2002).
Pruvost, J., J. Legrand, and P. Legentilhomme, “Three-Dimensional Swirl Flow Velocity-Field Reconstruction Using a Neural Network with Radial Basis Functions,”J. Fluids Eng., 123, 920 (2001). Pulz, O., and K. Scheibenbogen, “Photobioreactors: Design and Per-
formance with Respect to Light Energy Input,’’ Advances in Bio-
chemical Engineering Biotechnology, 59, 123 (1998).
Richmond, A,, Handbook of Microalgal Mass Culture, CRC Press, Boca Raton, FL (1986).
Richmond, A,, “Efficient Utilization of High lrradiance for Produc- tion of Photoautotrophic Cell Mass: A Survey.”J. Appl. Phycol., 8, 381 (1996).
Thomas, W. H.. and C. H. Gibson, “Effects of Small Turbulence on Microalgae,”J. Appl. Phycol., 2, 71 (1990).
Vandanjon, L., N. Rossignol, P. Jaouen, J. M. Robert, and F. QuCmCneur, “Effects of Shear on Two Microalgae Species. Con-
tribution of Pumps and Valves in Tangential Flow Filtration Sys- tems,” Biotechnol. Bioeng., 63(1), 1 (1999).
Vonshak, A,, Spirulina platensis (Artrospira): Physiology, Cell-Biology
and Biotechnology. Taylor & Francis, London (1997).
Yokota, T., M. Hizume, T. Ohtake, and K. Takahashi, “A New Growth Kinetic Model for Photoautotrophic Microalgae Culture,”
J. Chem. Eng. Jpn., 27(3), 399 (1994).
Manuscript receiued Apr. IS, 2001, and reuision receiued Oct. 1. 2001.