Optical emission spectroscopy as a
process-monitoring tool in PECVD of amorphous carbon
coatings
[Tapez ici le sous-titre de la thèse ou du mémoire, s'il y a lieu]
Mémoire
Farid Anooshehpour
Maitrise en génie des matériaux et de la métallurgie
Maître ès sciences (M.Sc.)
Optical emission spectroscopy as a
process-monitoring tool in PECVD of amorphous carbon
coatings
[Tapez ici le sous-titre de la thèse ou du mémoire, s'il y a lieu]
Mémoire
Farid Anooshehpour
Sous la direction de:
Directeur de recherche: Diego Mantovani
Codirecteur de recherche: Gaétan Laroche
Résumé
Dans ce projet de recherche, le dépôt des couches minces de carbone amorphe (généralement connu sous le nom de DLC pour Diamond-Like Carbon en anglais) par un procédé de dépôt chimique en phase vapeur assisté par plasma (ou PECVD pour Plasma Enhanced Chemical Vapor deposition en anglais) a été étudié en utilisant la Spectroscopie d’Émission Optique (OES) et l’analyse partielle par régression des moindres carrés (PLSR). L’objectif de ce mémoire est d’établir un modèle statistique pour prévoir les propriétés des revêtements DLC selon les paramètres du procédé de déposition ou selon les données acquises par OES.
Deux séries d’analyse PLSR ont été réalisées. La première examine la corrélation entre les paramètres du procédé et les caractéristiques du plasma pour obtenir une meilleure compréhension du processus de dépôt. La deuxième série montre le potentiel de la technique d’OES comme outil de surveillance du procédé et de prédiction des propriétés de la couche déposée.
Les résultats montrent que la prédiction des propriétés des revêtements DLC qui était possible jusqu’à maintenant en se basant sur les paramètres du procédé (la pression, la puissance, et le mode du plasma), serait envisageable désormais grâce aux informations obtenues par OES du plasma (particulièrement les indices qui sont reliées aux concentrations des espèces dans le plasma). En effet, les données obtenues par OES peuvent être utilisées pour surveiller directement le processus de dépôt plutôt que faire une étude complète de l’effet des paramètres du processus, ceux-ci étant strictement reliés au réacteur plasma et étant variables d’un laboratoire à l’autre. La perspective de l’application d’un modèle PLSR intégrant les données de l’OES est aussi démontrée dans cette recherche afin d’élaborer et surveiller un dépôt avec une structure graduelle.
Abstract
The production of amorphous carbon coatings or as commonly known as diamond like carbon (DLC) coatings, using the plasma enhanced chemical vapor deposition (PECVD) method is studied through optical emission spectroscopy (OES) as a plasma diagnostic technique and the partial least square regression (PLSR) statistical method.
The objective is to establish a model to predict DLC properties independent of reactor-related parameters, in order to be used in any other similar deposition process. Therefore the model correlates the deposited coating properties to plasma parameters derived from OES.
The OES derived data carries a variety of information about plasma characteristics. The relative spectral line intensities of CH and atomic H to specific Ar lines were employed as a probe of their concentrations according to actinometry method. The full width at half maximum of atomic H was also employed. This method can be used as a probe of gas temperature via Doppler broadening effect. The DLC coatings were characterized using profilometry for thickness and stress measurements and Auger electron spectroscopy (AES) for structural analysis.
There were two series of PLSR analysis carried out: The first analysis studies the correlation between process parameters and plasma characteristics, as derived by OES, for a better understanding of the plasma deposition process. The second analysis shows how the OES can be used for prediction of coating properties and for process monitoring.
According to the results, the OES data (especially the parameters that are related to the concentration of atomic hydrogen and CH species) are able to represent some parts of process parameters (plasma power, mode and pressure) in a statistical model that is designed for predicting DLC coating properties. In other words, this means that this plasma diagnostic technique can be employed for in-situ monitoring of growing DLC coating properties, instead of using process parameters, which are related to the deposition reactor and may vary from one system to another. The perspective of using the OES data and the PLSR analysis in designing and monitoring a structurally gradient DLC coating is also discussed.
Table of contents
Résumé ... iii
Abstract ... iv
Table of contents ... v
List of tables ... vii
Figure list ... viii
Acknowledgement ... x
1 Introduction ... 1
1.1 DLC applications ... 1
1.2 Limitations of DLC coatings ... 3
2 Amorphous carbon coatings ... 5
2.1 Diamond-Like Carbon: a general term for a wide range of amorphous carbon coatings ... 5
2.1.1 Plasma enhanced chemical vapor deposition (PECVD) of DLC ... 8
2.1.2 DLC coating formation mechanism ... 8
2.1.3 Compressive stress in DLC coatings ... 11
2.2 Conclusion ... 13
3 Plasma and plasma diagnostic methods for carbon containing plasma ... 14
3.1 Optical Emission Spectroscopy (OES) ... 18
3.1.1 Emission line profile and gas temperature measurement ... 19
3.1.2 Actinometry measurements ... 21
3.2 Conclusion ... 22
4 Project ... 23
4.1 State of the problem ... 23
4.2 Hypothesis ... 26
4.3 Objectives ... 26
4.4 Materials and methods ... 28
4.4.1 Plasma reactor ... 28 4.4.2 Substrate ... 29 4.4.3 Pre-deposition process ... 29 Argon etching ... 29 Hydrogen etching ... 29 DLC deposition ... 29
4.4.5 DLC characterization methods ... 31
Profilometry ... 32
XPS-AES ... 32
4.4.6 Plasma diagnostics - optical emission spectroscopy ... 33
Spectral line profile - FWHM ... 33
Actinometry measurements ... 34
4.4.7 Statistical analysis ... 34
4.5 Results and discussion ... 36
4.5.1 DLC coating characterization ... 36
AES ... 36
Internal Compressive Stress ... 36
4.5.2 OES measurements ... 39
Spectral line profile (FWHM) ... 42
Actinometry ... 42
4.5.3 Effect of Experimental parameters on OES data ... 45
4.5.4 OES as a process-monitoring tool ... 49
4.5.5 Prediction of DLC properties using a PLSR model ... 55
4.5.6 Designing and monitoring a deposition process using the PLSR results ... 56
5 Conclusion ... 60
5.1 General conclusion ... 60
5.2 Specific conclusion ... 60
5.3 Suggestions for further study ... 62
References ... 64
Appendix ... 70
A. Auger Electron Spectroscopy (AES) ... 70
B. Partial Least Square Regression ... 72
Principal Component Analysis (PCA) ... 72
PLSR calculation ... 75
C. Electric probes ... 78
Langmuir probe ... 78
List of tables
Table 1- A comparison between Diamond and graphite properties 9,10. ... 6
Table 2- The range of properties for a DLC coating 10,14,15. ... 7
Table 3-Theoretical coordination and resulted number of constraints in a hydrogenated amorphous carbon structure ... 9 Table 4- Proposed mechanisms and models for hydrogenated amorphous carbon coating. 11 Table 5- General categories of plasma. ... 14 Table 6- The main group of plasma diagnostic methods and their capabilities for plasma
measurements. ... 16 Table 7- Frequently studied hydrocarbon plasma species by optical spectroscopy. ... 19 Table 8: Argon as an actinometer for density measurement of different plasma species. ... 22 Table 9- Different types of dopants have been used in various amorphous carbon coatings.
... 24 Table 10- Examples of multi-layer and gradient DLC coatings. ... 25 Table 11: The range of experimental parameters employed for DLC deposition. ... 30 Table 12- the combination of experimental parameters for the training set of experiments.
... 31 Table 13- The combination of experimental parameters for the prediction set of
experiments. ... 31 Table 14: DLC structure analyzing techniques ... 32 Table 15- Observed species, their wavelengths, transitions and upper state energy levels. 40 Table 16- Components and the R2 value of different PLSR models. ... 49
Figure list
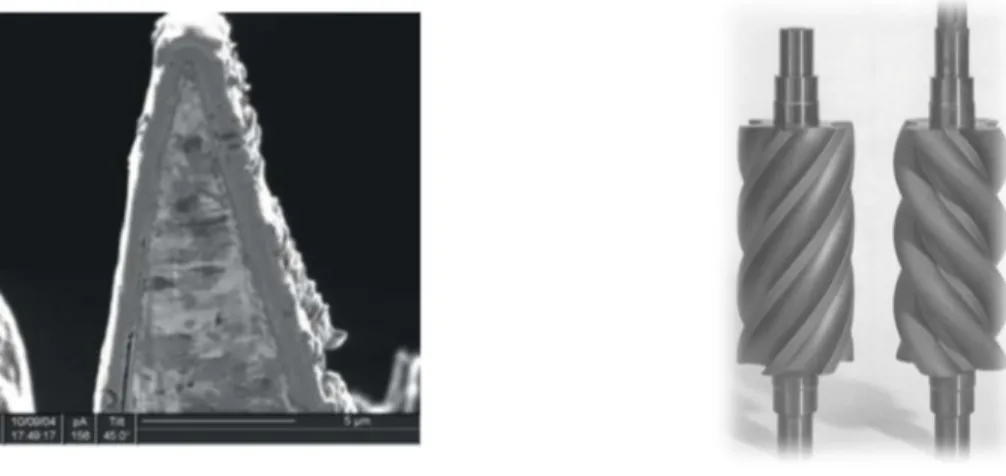
Figure 1- Examples of hard carbon coating applications. An SEM image of a DLC coated razor blade (left) and compressor screws with carbon and carbide multilayer coating (right) 1. ... 2
Figure 2- DLC as a transparent protective layer in hard disk drive (left) 3. A schematic
design of beer bottle inner surface carbon coating for longer shelf life 2. ... 2
Figure 3- DLC coating over knee articulation replacement 4. ... 3
Figure 4- The three main hybridization states in carbon atoms 8. ... 5
Figure 5- Ternary diagram of carbon and hydrogen depicts various type of amorphous carbon structure 2. ... 7
Figure 6- The fully constrained network (FCN) model for hydrogenated amorphous carbon structures. Proposed by Angus 11. Two curves are based on different assumptions on
clustering of sp2 carbon atoms. ... 10
Figure 7- stress-energy curve describes how ion energy affect internal the stress level in a coating 29. ... 12
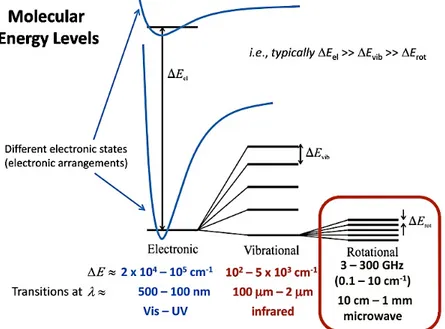
Figure 8- Electronic, vibrational, and rotational energy level in a typical molecule 61. ... 18
Figure 9- An optical microscopy image of a typical DLC coating delamination as a result of high internal compressive stress (coating is deposited by the author). ... 23 Figure 10- Schematic set up of the plasma reactor and the plasma diagnostic assembly. ... 28 Figure 11- Measured D-parameter values for different deposited DLC coatings ... 37 Figure 12- DLC coating internal compressive stress at different deposition conditions... 37 Figure 13- DLC deposition rate at different deposition conditions ... 38 Figure 14- A typical observed spectra from CH4 plasma. Detected lines are marked in the
graph. ... 39 Figure 15 – Spectral line variations at different deposition conditions. a) D: high power and low pressure, F: low power and high pressure. b) E: low pressure and pulse mode, H: high pressure and continuous mode. ... 41 Figure 16- FWHM of Hα line at different deposition conditions. ... 42 Figure 17- The intensity ratios as a probe of each species concentration in the plasma
medium for CH, Hα, and Hβ. The relative ratio of [CH]/[Hβ] is also presented. ... 43 Figure 18- Example of OES results of two different bias voltage levels for two groups of
observations; First, high power, high pressure, pulse mode, and high Vb for A
observation and low Vb for C observation (a and b, respectively). Second, high power,
low pressure, continuous mode, and high Vb for B observation and low Vb for D
observation (c and d, respectively). ... 46 Figure 19- Loading bi-plot shows the relation between experimental parameters (P, p, and M) and the OES derived data. ... 47 Figure 20- Regression coefficients of the PLSR model that show how the OES data change with experimental parameters. ... 48
Figure 21- VIP bar plot of model 2 and 4. The parameters with a VIP value higher than 1
are very important in the model. ... 51
Figure 22- The loading plot of model 4 describes the correlation between DLC properties (red parameters) and input data (blue parameters). ... 52
Figure 23- The regression coefficients for a) the D-parameter, b) the film stress, and c) the deposition rate of DLC coatings. ... 53
Figure 24- Predicted versus observed values for the DLC stress level, the D-parameter, and the deposition rate. ... 55
Figure 25- Designing a gradient DLC deposition using contour plots based on the bias voltage and the plasma power derived from model 2. Graph a) shows the starting window in which a medium stress and a medium D value are required. Graph b) shows the ending window in which a high stress and a low D value are required. Graph c) is the contour plot of the deposition rate including the starting and the ending window to select a deposition system with the desired deposition rate. ... 57
Figure 26- Monitoring a gradient DLC deposition using contour plots based on [H] and [CH] related parameters derived from model 4. Graph a) shows the starting window in which a medium stress and a medium D value are required. Graph b) shows the ending window in which a high stress and a low D value are required. Graph c) is the contour plot of the deposition rate with the starting and the ending window to select a deposition system with the desired deposition rate. ... 59
Figure 27- C KLL and the first derivative Auger spectra of graphite, diamond and SiC. ... 71
Figure 28- Finding the principal components in a cloud of data 117 ... 73
Figure 29- NIPLAS calculation for finding the PCAs ... 74
Figure 30- NIPLAS algorithm for determining components of PLSR model 117 ... 76
Figure 31: A typical I-V curve ... 79
Figure 32: Application of Druyvesteyn method to achieve EEDF from I-V curve in an Langmuir probe experiment 120 ... 81
Figure 33: Schematic design of a Faraday cup 48. ... 83
Figure 34- An example of I-V characteristic curve and its first derivative that explain ion energy distribution in plasma 35 ... 84
Figure 35- Different part of the Faraday’s cup. a and b are the orifices on the housing and the cup for letting ions into the cup (right). The housing drawing, as it was fabricated to be used in the plasma reactor (left). ... 85
Figure 36- Faraday’s cup results at different Ar plasma condition. ... 85
Figure 37-Faraday’s cup samples results for Ar plasma at different plasma conditions. I-V (top) and dI/dV-V graphs (bottom) are presented. The interrupted graph at medium bias voltage is marked in red. ... 86
Figure 38- Faraday’s cup samples results for CH4 plasma at different plasma conditions. I-V graph (top) and dI/dI-V graphs (bottom) are presented for each plasma condition. ... 87
Acknowledgement
This thesis is a result of a three years study in the Laboratory of Biomaterials and Bioengineering of the department of mining, metallurgical and materials engineering and the University-Hospital Research Center of Laval University. This study would not have been accomplished without all the support that I have received. Therefore, I would like to make use of this portion of my thesis to acknowledge all of those who have supported me. First of all, I would like to thank my director, professor Diego Mantovani, who gave me the opportunity to start doing this research at Laval University and supported me throughout these last years. His advice paved the way to achieve this MSc degree.
I would also like to thank all the advices, supports, and encouragement that I have received from professor Gaétan Laroche, my co-supervisor, who has always made himself available for discussion. I admire his great personality and I am proud of working under his supervision.
I have spent nearly the entire four years in direct contact with the research professionals of our group: Dr. Stéphane Turgeon and Dr. Pascale Chevallier. Beside their availability and scientific and technical support that deserve a lot of appreciation, I would also like to express my warmest gratitude for the welcoming environment that they established from the very first day. This kind gesture made it easy to surpass any kind of difficulty for the last three years.
Next, I would like to acknowledge my appreciation to Dr. Ranna Tolouei for her generous support and Maxime Cloutier for his scientific and technical help. I would also like to thank the rest of the members of the group. I am proud of having such good friends.
Finally, I must express my profound gratitude to my family, especially my wife Parnaz and my parents for their unfailing support and encouragement throughout the years of this study. I would also like to acknowledge my appreciation for the continuous support and encouragement that my brothers Farshad and Farzad have given me. This accomplishment would not have been possible without them.
Farid Anooshehpour April 2016
1 Introduction
Carbon is a nonmetallic element with four valence electrons available to form different covalent chemical bonds. It lets various configurations of carbon atoms in different structures to exist (known as carbon allotropes). Graphite and diamond are among the natural form of carbon. However, there are other more recently discovered forms of carbon such as: graphene, fullerene, carbon nanotube, amorphous carbon. Each has its own properties and its own specific application.
Diamond’s unique properties are derived from carbon-carbon strong chemical bonding. Here are some outstanding diamond properties:
- High hardness and wear resistance - Chemical inertness
- Low electrical conductivity - Optical transparency
Hence, for the past 40 years a variety of techniques have been employed to find an alternative production method for the natural diamond formation condition, which requires very high temperature and pressure. Diamond Like Carbon (DLC) is a general term given to a broad range of amorphous carbon materials that are produced by different techniques from pure PVD to different CVD processes. Several studies were implemented to employ this coating in different fields of application that are discussed in the next section.
1.1 DLC applications
DLC coatings were first employed for their mechanical properties as a hard wear resistant coating for protection and friction reduction purposes such as: in gears, bearings, extrusion die. (Figure 1) 1. However, they cannot be used in applications at very high temperatures 2.
DLC mechanical properties, along with optical transparency, made it a good candidate as a protective layer over hard disk drives (Figure 2) 3. Diamonds are transparent to the laser
The high density and compact atomic structure of DLC is also beneficial for CO2 loss
prevention and O2 penetration into beverages when it is applied over the inner surface of
polymeric beer bottles. This could help to prolong bottle shelf life and conserving the quality of beverages (Figure 2) 2.
Figure 1- Examples of hard carbon coating applications. An SEM image of a DLC coated razor blade (left) and compressor screws with carbon and carbide multilayer coating (right) 1.
Figure 2- DLC as a transparent protective layer in hard disk drive (left) 3. A schematic design of beer bottle
inner surface carbon coating for longer shelf life 2.
This type of coating has also been studied for biomedical applications either as a wear resistant coating as in synthetic articulations (because of high mechanical properties and proper biocompatibility) (Figure 3) 4 or as a durable antibacterial coating (because of its
high wear resistance and smooth surfaces that hinder the bacteria attachment and biofilm formation) 5–7.
Beside all of these unique properties and wide range of application, there are some limitations with amorphous carbon coatings, which are discussed in the section 1.2.
Figure 3- DLC coating over knee articulation replacement 4.
1.2 Limitations of DLC coatings
All the properties of DLC coatings come from their chemical structure, which contains a mixture of carbon atoms with sp2 or sp3 hybridization. A high sp3 content of a DLC
coating, which is responsible for the mechanical properties, provokes a high internal compressive stress at the same time. This restricts the coating thickness and its application in harsh mechanical conditions. This internal stress may result in low adhesion to the substrate, which results in coating delamination.
This study aims to evaluate application of optical emission spectroscopy technique as a plasma diagnostic method. This study also aims to demonstrate its potential as a monitoring tool for plasma enhanced chemical vapor deposition process of DLC coatings, in order to establish a proper model for developing a multi-layer or a functionally gradient DLC structure. These types of structures are shown to be effective in suppressing internal stresses.
The next chapter is a review about diamond-like carbon coatings, as presented in contemporary literature.
The third chapter discusses plasma diagnostic techniques, especially the optical emission spectroscopy and provides a literature review on its application for carbon containing plasma.
The chapter four is devoted to the project and describes its different parts, which are State of the problem, Materials and Methods, Results and Discussions.
Finally, chapter five is a summary of the study and the resulted conclusions along with suggestion for further studies. Supplementary information about different parts of this research is available in the appendices.
2 Amorphous carbon coatings
2.1 Diamond-Like Carbon: a general term for a wide range of
amorphous carbon coatings
The four valence electrons of carbon atoms can form three different modes of chemical hybridizations (sp1, sp2, sp3 as shown in Figure 4) that make the carbon to be naturally
found in either allotropic form of diamond, graphite or in an entirely amorphous structure. In a diamond structure, all four valence electrons are involved in well directionally defined sp3 orbitals. They form four strong bonds with their adjacent carbon atoms. In sp2
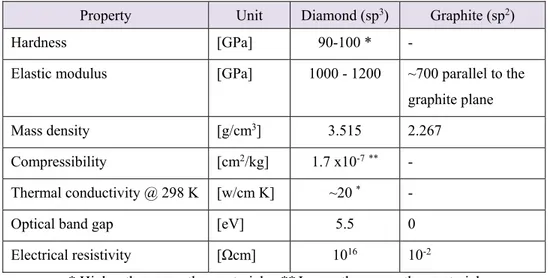
hybridization, one of the valence electrons forms a orbital perpendicular to the plane of the three bonds (as in graphite). In a sp hybridization, two of the valence electrons form two bonds along the X-axis, while the remaining two electrons form two orbitals in the Y-Z plane. Each of these hybridizations results in different structures and therefore different properties in the final carbon material. Table 1 presents how different carbon materials can have quite different properties.
Table 1- A comparison between Diamond and graphite properties 9,10.
Property Unit Diamond (sp3) Graphite (sp2)
Hardness [GPa] 90-100 * -
Elastic modulus [GPa] 1000 - 1200 ~700 parallel to the graphite plane Mass density [g/cm3] 3.515 2.267
Compressibility [cm2/kg] 1.7 x10⁻⁷** -
Thermal conductivity @ 298 K [w/cm K] ~20 * -
Optical band gap [eV] 5.5 0 Electrical resistivity [Ωcm] 1016 10-2
* Higher than any other material **Lower than any other material
Natural diamonds are formed under very harsh conditions (high pressure and high temperature, which are naturally provided in deep layers of the earth) that are difficult to resemble for a synthetic diamond material production. Instead, different CVD or PVD techniques have been employed to produce different diamond like materials.
Synthetic diamond-like coatings are a mixture of microcrystalline diamond and an amorphous carbon phase. They usually contain considerable fraction of sp3 hybridization.
This is the reason why it is called Diamond Like Carbon (DLC). However, in practice this term covers a wide range of amorphous carbon materials from graphite (100% sp2) to
amorphous carbon (a-C) to structures that are similar to diamond (tetrahedral amorphous carbon (ta-C) with 90% sp3). The hydrogen content of a coating (0-40%) also changes the
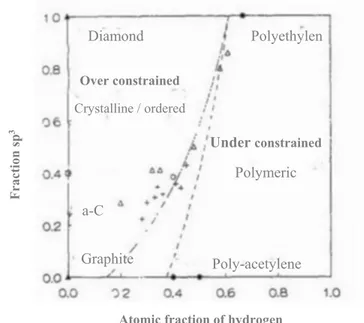
coating properties 10–12. The following ternary diagram (Figure 5), introduced by Jacob and
Moller 13 and developed by others, depicts how sp3/sp2 ratio and H-content determine the
final DLC structure. Table 2 shows how DLC properties may vary from that of diamond to graphite in a DLC coating family.
Figure 5- Ternary diagram of carbon and hydrogen depicts various type of amorphous carbon structure 2.
Table 2- The range of properties for a DLC coating 10,14,15.
Property Diamond ta-C ta-C:H a-C:H hard a-C:H soft Graphite
sp3 content % 100 40-80 - - - 0
Hydrogen content % 0 0 30 30-40 40-50 0 Hardness [GPa] 90-100 80 50 10-20 <10 - Elastic Modulus [GPa] 1000-1200 750 300 - - -
Density [g/cm3] 3.515 3.1 2.4 1.6-2.2 1.2-1.6 2.27
Optical gap [eV] 5.5 2.5 2-2.5 - - 0
Schmellenmeir first developed the DLC coatings in the 1950s by exciting a discharge in an acetylene medium. The term “Diamond like Carbon” first came after Aisenberg and Chabot
16. In the 1960s, Angus in America and Deryagin in the USSR made DLC coatings
throughout using thermal CVD of carbon-containing precursor gases. Then, during the 1970s, Deryagin reported a carbon coating that was produced using an electrical activating method. Then in the 1980s, low-pressure plasma enhanced CVD techniques were introduced17. The use of hydrocarbon plasma brings higher deposition rates comparing with
carbon ions from a carbon target. A variety of different techniques (ion beam deposition, cathodic arc deposition, plasma enhanced CVD, laser ablation, sputtering, etc.) have been
employed for DLC deposition. Filtered ion methods (Mass selection beam deposition (MSIBD) or filtered-arc) are also of interest since they provide carbon ion beams with narrow and controlled energy ranges 18.
2.1.1 Plasma enhanced chemical vapor deposition (PECVD) of DLC
Diamond is thermodynamically a meta-stable material. The sp3 hybridization requires a
non-equilibrium technique such as plasma deposition that facilitates the formation of coatings. This hybridization naturally needs very harsh conditions to be formed and because of this, these techniques are called plasma-enhanced deposition. Unlike the naturally formed materials, which are the thermodynamically stable state, the coatings made by plasma are in a meta-stable state. The stable form of a carbon atom at 298 K and 1 atm is in a sp2 hybridization. However, the large required activation energy barrier for sp3
to sp2 transformation makes the meta-stable sp3 C to remain stable in this condition. Aside
from its high deposition rate, deposition at a lower temperature is another advantage of PECVD compared to other CVD techniques that makes it possible to deposit over a wide range of substrate materials including those of lower melting points 19.
2.1.2 DLC coating formation mechanism
In general, H abstraction from the surface is the first step in surface mechanisms, which takes place when an atomic H hits the surface and remove a bonded H atom to form a H2
molecule. This H removal results in a free dangling bond on the surface that is a chemically active site for further reaction. The most probable consequent reaction would be bonding with another atomic H. The CHx (x=0-3) species displacement is much slower than the H
atoms because of their higher mass. However, once they arrive to the surface, they fix themselves by forming three or four bonds with their adjacent carbon atoms. The Increase of the number of bonds has a dual effect on a single atom 20:
- More stability due to more fixation sites and
- Less stability because of increased energy, which is a result of bond stretching and bond angular distortion forces (network constraints).
The balance between these two competing forces is achieved when the average coordination number reaches the allowable degree of freedom. To describe the
thermodynamically stable structure of carbon coatings, Döhler introduced how the number of constraints (Ncon) can be found from the coordination number (m) in a random network:
- Ncon= m2/2 for m ≤ 2
- Ncon= 5m/2 - 3 for m > 2
So in an amorphous carbon structure one can calculate theoretical constraints number as presented in Table 3 21.
Table 3-Theoretical coordination and resulted number of constraints in a hydrogenated amorphous carbon structure
xi Atom Coordination number (m) constraints (NNumber of
con)
xH H 1 0.5
xsp2 sp2 bonded C 3 4.5
xsp3 sp3 bonded C 4 7
Assuming an average coordination number of 3 for an amorphous network, Döhler achieved a condition for a complete constraint network (Eq. (1)).
∑ 3 (1)
According to Eq. (1) and data on Table 3, one can conclude
0.5xH + 4.5 xsp2+ 7 xsp3 = 3, (2)
knowing that
xH+ xsp2+ xsp3=1 (3)
At the end, the range of composition over which a fully constraint network (FCN) of amorphous carbon structure can exist can be calculated using this equation:
8 3
8 13
(4)
This equation determines the sp3/sp2 ratio at which the number of bonds is equal to the
number of degrees of freedom. Lower sp3/sp2 ratio results in under-constraint soft
polymeric (floppy) structure while the greater ratio brings about over-constraint under stress network. Angus developed a graph for the FCN model and evaluated it with the result
of other researchers (Figure 6) 11. The over-constrained and under-constrained regions and
some crystalline and polymeric examples are marked on the graph below.
Figure 6- The fully constrained network (FCN) model for hydrogenated amorphous carbon structures. Proposed by Angus 11. Two curves are based on different assumptions on clustering of sp2 carbon atoms.
Different mechanisms have been proposed on DLC coatings growth. Keudell explained the growth as a two-step adsorption process. At the beginning, CHx species are adsorbed
physically to the substrate surface. Then, subsequent impinging ions provide required energy to pass the activation barrier for a chemical bonding to the surface 22. However, it is
agreed that excessive energy of the bombarding atoms leads to gradual suppression of sp3
bonding.
According to Lifshitz, DLC deposition process is not a surface process. Instead, it is a shallow implantation (sub-plantation) process in which incident atoms enter subsurface sites. Lifshitz believes that subplantation process evolves in the following steps 23:
- Penetration of carbon species into sub-surface layers - Local stress induction due to penetrating atoms - Evolution of a pure carbon layer during sputtering - Coating growth on successive bombardment
Diamond Graphite a-C Polyethylen Poly-acetylene Over constrained Crystalline / ordered Under constrained Polymeric Fract ion sp 3
Robertson made a link between sp3 hybridization of carbon and local intensity of carbon
atoms. He suggests that high energetic ion flux causes deep penetration and a metastable increase in local density that is a favorable condition for sp3 hybridization 12.
Table 4 shows the evolution process for the mechanisms proposed for DLC growth:
Table 4- Proposed mechanisms and models for hydrogenated amorphous carbon coating.
Who When What
Spencer et al. 24
1976 sp
3 sites arise from preferential sputtering of sp2 sites by impinging high
energetic ions
Döhle20 1980 Fully constrained network (FCN)
Weissmantel25
1982
sp3 sites arise from the thermal shock-wave of the ion cascade
DLC resulted from the transient high pressure-high temperature spikes caused by impact of energetic ions
Windishmann 1987 Ion-peening compressive stress Lifshitz et al.26
1989
Sub-plantation (Low energy implantation), in which ions enter subsurface sites. sp2 carbon atoms are displaced into sites where they became sp3
coordinated McKenzie et
al.27 1991
sp3 bonding stabilized by compressive stress (from ion bombardment and
ion-peening), which moves a-C into the stability domain of diamond
Robertson12 1994 Formation of meta-stable sp3 hybridization as a result of local density increase
2.1.3 Compressive stress in DLC coatings
Deposition of DLC coatings with a high sp3 fraction encounters some obstacles such as
development of high compressive internal stress during coating deposition. A compressive stress of 10 GPa is reported in a coating with 90% sp3. Lifshitz addressed some technical
issues about DLC coatings. Among them, he mentioned the problem of internal compressive stress that limits the coating thickness18.
Atomic or ion peening is introduced as the source of internal compressive stress, which happens when a coating is deposited under bombardment of high energetic atoms or ions. In this condition, ions enter the spaces in the coating that are not large enough for them. Therefore, This results in the development of compressive stress in macroscopic scale
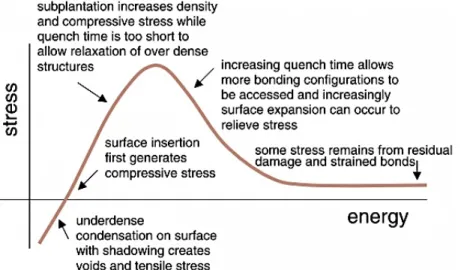
during the film growth 28. Bilek and McKenzi presented the following graph (Figure 7) to
describe the effect of ion energy on internal stress level 29. The graph shows how the film
stress is related to the energy of incident ions. A thermal spike appears upon the incidence of energetic ions. The quench time of these spherical thermal spikes is proportional to the square of their radius 30. The compressive stress firs appear when the ions get enough
energy to penetrate into the surface. It increases gradually with respect to the ion energy and reaches a maximum. Until this point, the quench time is too short for relaxation. Afterward, the larger spikes provide longer quench time that let the structure to relax itself by consuming excess energy.
Figure 7- stress-energy curve describes how ion energy affect internal the stress level in a coating 29.
Therefore, ion energy plays an important role in the structure and properties of DLC coatings. The source of ion energy in a PECVD deposition process is the ion acceleration by applying a bias voltage. This parameter, along with other process parameters, has been studied in this research.
2.2 Conclusion
The term DLC refers to a wide range of amorphous carbon structures with a wide range of properties. Therefore, it is important to determine what type of DLC is produced as a result of a deposition process. Proposed mechanisms for DLC deposition help to better understand the growth phenomena in each type of DLC deposition processes. The PECVD process, which usually uses hydrocarbon gases as precursor, results in a hydrogenated amorphous carbon (a-C:H) as the dominant DLC structure. The ion energy has a key role in this deposition process and determines the final coating structure.
3 Plasma and plasma diagnostic methods for carbon containing
plasma
Receiving enough energy, the materials state changes from a solid into a liquid and then into a gas. If one continues to supply energy into a gas medium, the collisions between atoms and molecules and free electrons, result in dissociation, ionization or excitation of them. Consequently, a mixture of negatively charged electrons, positively charged ions, radicals and neutral species will be produced. This is the plasma state. This is the reason why plasma is usually called the “fourth state of matter” after solid, liquid and gas. The required energy for the formation of a plasma medium could be provided from different sources of energy (flames, discharge, electromagnetic waves, lasers, etc.).
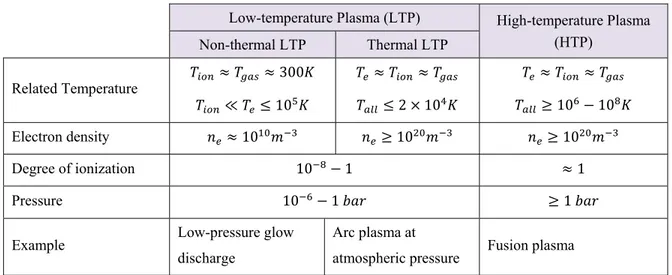
Table 5- General categories of plasma.
Low-temperature Plasma (LTP) High-temperature Plasma (HTP) Non-thermal LTP Thermal LTP Related Temperature 300 ≪ 10 2 10 10 10 Electron density 10 10 10 Degree of ionization 10 1 1 Pressure 10 1 1
Example Low-pressure glow discharge
Arc plasma at
atmospheric pressure Fusion plasma
As stated in Table 5, plasma mediums are categorized in two different groups of high and low temperatures, based on the energy level of electrons and ions inside plasma.
The low temperature non-thermal plasma is a non-equilibrium medium in which electron temperature is much more than ion/gas temperature. These energetic electrons are responsible for the dissociation of large molecules.
Different sources have been employed for plasma generation. Among them, the microwave and the radio frequency discharge plasma are frequently used in laboratories and industrial application for the purpose of materials surface treatments. They generate a chemically active atmosphere while the medium temperature is kept low. In this way, plasma is widely employed to boost a CVD process and it is called plasma enhanced chemical vapor deposition (PECVD).
To explanation a plasma medium (in terms of chemistry and kinetics) one needs to determine as accurately as possible, as many parameters as possible, with the help of as many independent diagnostic techniques as possible. The main parameters that are usually studied in plasma characterization are 31,32:
Chemistry of plasma.
Employed precursors and their degree of ionization (DI) inside plasma. Temperature and density of plasma components.
Electron density (ne), ion density (ni), and their related energy distribution function.
Magnetic and electric field strength.
Based on different physical approaches, a variety of techniques have been employed to study plasma states. Aside from macroscopic properties of plasma (color, pressure, etc.), several plasma diagnostic methods have been used to study carbon containing plasma such as: electrostatic probes 33–35, optical emission spectroscopy, optical absorption spectroscopy 36–39, and mass spectroscopy 40–42 ( Table 6). Each of these plasma characterization methods
has pros and cons. For instance, the Langmuir probe is a practical method for electron energy distribution analyses inside a plasma medium. However, it is an intrinsic characterization method, which means that it somewhat perturbs the plasma environment. Another example is the OES method. The OES extrinsically probes the plasma and provides information about identity, temperatures (electronic, vibrational, and/or rotational) and density of the excited species. Although being advantageous at first sight, The OES requires to make some hypotheses related to the energy distribution of the plasma species as well as the mechanisms of excitation43,44.
Table 6- The main group of plasma diagnostic methods and their capabilities for plasma measurements. Diagnostic group Technique Purpose of study Ref. Electric probe
Langmuir probe
Electron temperature (Te)
Electron density (ne)
Electron energy distribution (EED) Ion density (ni)
33,34,45–47
Faraday cup Ion average energy level Ion energy distribution (IED)
35,48–50 Optical spectroscopy Emission spectroscopy Optical emission spectroscopy LIF1
Optically active species characterization Electron Temperature (Te) Plasma Temperature Rotational/vibrational Temperature Species concentration 36,37,42,51–55 Absorption spectroscopy Infrared (Diode laser, FTIR2) TDLAS3 BAS4
Characterization of molecular species (except homo-nuclear di-atomic molecules)
Optically active species characterization Rotational/vibrational Temperature 37–39,56–58 Mass spectroscopy QMS5 TIMS6 PIMS7 Ion characterization Ion energy measurement
17,40–42,59,60
1 Laser induced fluorescence spectroscopy 2 Fourier Transform Infrared
3 Tunable infrared diode laser absorption spectroscopy 4 Broadband Absorption Spectroscopy
5 Quadrupole Mass Spectroscopy
6 Threshold Ionization Mass Spectrometry 7 Photo-Ionization Mass Spectrometry
This study was first based on the use of electrical probe and optical emission spectroscopy (OES) as plasma diagnostic methods. But after some preliminary experience it was finally decided to focus on the OES technique. Section 3.1 is dedicated to the OES techniques. However, the concept of plasma diagnostic using electrical probes and the details of its application in this study are presented in Appendix C.
3.1 Optical Emission Spectroscopy (OES)
Optical emission spectroscopy (OES) is a non-intrusive and easy to use technique to study plasma properties. OES is used to analyze the light emitted from plasma. This light is a result of plasma species transition from an excited state into a lower energy state or ground state. In a single atom, there are some discrete well-known electronic energy levels. However, in a molecule there are sub-electronic states, which are vibrational and rotational energy levels (Figure 8) that make the emitted photons to deviate from their original energy levels. This is the reason why one observes a series of spectral lines for an electronic transition of a molecule while there is just a single emission line for each specific transition of an atom. The vibrational and rotational states arise from the relative movement of atoms nuclei with respect to each other. Every electronic transition may be accompanied by vibrational or rotational transitions that change the energy of the emitted photons into higher or lower energy levels (blue shift and red shift, respectively).
Figure 8- Electronic, vibrational, and rotational energy level in a typical molecule 61.
There are various OES studies of different types of plasma. OES studies have been widely used in the carbon containing plasma, either to study the plasma itself or to correlate plasma
characteristics to the final product properties 36,55,62–64. The following plasma characteristics
are among the most frequently studied ones: - Characterization of optically active species. - Electron temperature measurements.
- Rotational temperature derived from molecular hydrogen and C2 species.
- Gas temperature based on the Doppler broadening of spectral lines.
- Concentration of different species based on their emission line intensity using an actinometry method.
Among them, the last two concepts were employed in this project and will be discussed in detail in the following sections.
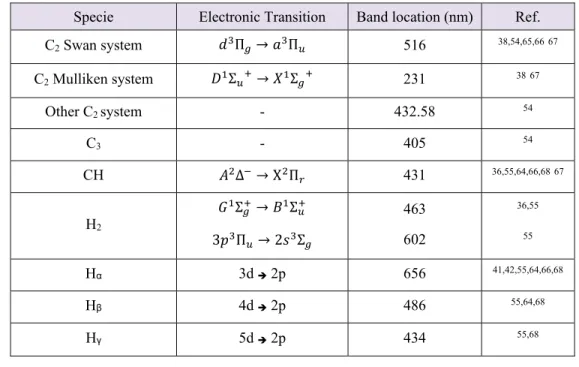
Table 7 summarizes reported optically active plasma species related to plasma-assisted carbon coating deposition or carbon nanotube formation, which have been observed by the OES method.
Table 7- Frequently studied hydrocarbon plasma species by optical spectroscopy. Specie Electronic Transition Band location (nm) Ref. C2 Swan system Π → Π 516 38,54,65,6667 C2 Mulliken system Σ → Σ 231 3867 Other C2 system - 432.58 54 C3 - 405 54 CH Δ → Χ Π 431 36,55,64,66,6867 H2 Σ → Σ 3 Π → 2 Σ 463 602 36,55 55 Hα 3d 2p 656 41,42,55,64,66,68 Hβ 4d 2p 486 55,64,68 Hγ 5d 2p 434 55,68 .
3.1.1 Emission line profile and gas temperature measurement
Therefore, electron energy level and gas temperature (Tg) are the controlling parameters for
a plasma medium. The concentration of plasma species can be strongly affected by either of these two factors 69. This is the reason why these two parameters are usually studied in a
plasma diagnostic analysis.
Knowing the nature of discrete energy levels in atomic structures, the emission spectrum of a species should include some narrow lines that appear at pre-defined wavelengths. Instead, in practice, there are some wide bands. The full width at half maximum (FWHM) of a line (∆ ), which is a result of the photon frequency shift and broadening mechanisms, is a characteristic of a plasma medium. The following phenomena are the main broadening mechanisms in plasma spectroscopy that result in the broadening of emission lines 43:
1- Natural broadening. It arises from the uncertainty in the energy of the states involved in the transition. It is not significant in atomic spectroscopy.
2- Doppler broadening. It is the most prominent broadening mechanism for atomic spectra in the UV-visible range. It arises from the thermal motion of atoms with a velocity of V in different directions, which affect the received frequency by the spectrometer.
3- Collisional broadening. Electron energy level in an atom or ions can be distorted as a result of frequent collisions with other particles, which results in the broadening of the related spectral line. Collisional or pressure broadening is not significant in low-pressure plasma spectroscopy.
A combination of all of the above mechanisms can also be involved. The natural broadening and collisional broadening mechanisms are negligible in spectroscopy of atomic species in low-pressure plasma, which is the case in the most PECVD processes of DLC coatings. Therefore, the Doppler broadening mechanism can be used for temperature estimation using Eq. (5). This temperature for such a PECVD process is supposed to be in the range of some thousands of Kelvins 70,72.
∆
2 2 2 7.16 10 (5)
Where ∆ is the FWHM around the center wavelength of resulted from the Doppler effect. m represents atomic mass, c represents light velocity and T is the gas temperature.
The Doppler broadening mechanism is significant for hydrogen atoms when compared to other plasma particles, since they are the lightest species 70,71. Broadening of the H2 line has
also been used to estimate translational gas temperature 72.
3.1.2 Actinometry measurements
The concept of the actinometry was first introduced by Coburn in 1980 73. It is a technique
used to estimate relative densities of a ground state species in reactive plasma using OES measurements. The intensity of each spectral line in an OES result is proportional to the excited state population of that species. This is usually less than 10-4 of its population in the
ground state that is responsible for the deposition process 70. The actinometry method helps
to measure the total concentration of each species based on the concentration of an inert gas, which is known as actinometer.
In actinometry, a small amount of an inert gas (usually argon), which has similar excitation energy levels to that of the probed species, is used as a reference. The relative intensity of the probed species over the intensity of the actinometer is related to the relative concentration of these two species in their ground states. One can then estimate the total population of the desired species, knowing the concentration of the actinometer. The selection of an actinometer gas must be based on the following assumptions:
- The actinometer should not affect the plasma (usually actinometer concentration is around 1% of the total gas mixture).
- Both the probed species and the actinometer should be excited from the ground state via a single electron impact excitation.
- Both species should have a similar energy threshold for excitation.
- The predominant de-excitation process should be a radiative relaxation transition, which occurs in low-pressure plasma.
Eq. (6) relates H atom concentration to measured spectral intensity ratio of hydrogen and that of Ar 72,74:
∗
This technique has been employed for carbon containing plasma processes by several authors 72,74. It has been shown that one of the transitions of Ar atoms (4p) (4p 4s at 750
nm) has the same excitation threshold as H (n=3) excited state, when excited from its ground state 36,74. The same Ar line also has been used for CH concentration measurements
(Table 8).
Table 8: Argon as an actinometer for density measurement of different plasma species. Plasma species Proper Actinometer Ref CH (A2Δ to X2Π) at 431.4 nm Ar @750.4 nm with energy threshold of 13.5 eV. While CH
excitation energy threshold is 12.2
36
H : H (n=4 to n=2) at 486 nm Ar @750.4 nm with energy threshold of 13.5 eV. While H(n=4) excitation energy threshold is 12.75
36
: H (n=3 to n=2) at 656 nm
Ar (4 → 4 ) lines:
2 → 1 , 750.3 , excitation energy level: 13.48 eV 2 → 1 , 811.5 , excitation energy level: 13.05 eV
74
3.2 Conclusion
The above-mentioned techniques help to extract different types of data from OES results to characterize the plasma medium. The concept of estimating a gas temperature from the shape of its spectral line was introduced in this section. Then, the basics of actinometry as a measurement tool for plasma species concentration was discussed. These plasma diagnostics help to understand plasma nature and can be employed to find a correlation between plasma parameters and resulted DLC coating properties.
4 Project
4.1 State of the problem
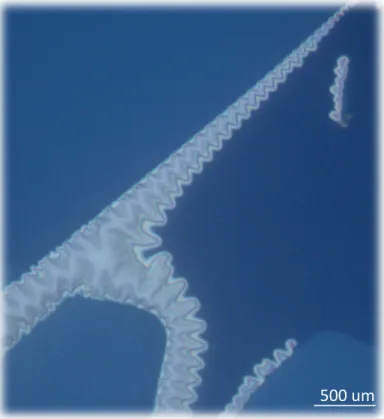
Referring back to the DLC structure and its formation mechanism as described in chapter 1, the level of internal compressive stress increases as the structure of the amorphous carbon coating gets closer to that of diamond. This compressive stress is responsible for high hardness and Young modulus of the coating on one hand, but on the other hand, it also decreases the coating adhesion to the substrate. A stress level of 5-10 GPa has been reported depending on the type of DLC 14. Figure 9 depicts an example of a DLC coating
over a silicon substrate that is partially delaminated to relax its internal compressive stress.
Figure 9- An optical microscopy image of a typical DLC coating delamination as a result of high internal compressive stress (coating is deposited by the author).
Different approaches have been studied to overcome this limitation such as: Annealing 75,76,
doping with different types of metallic elements 77–79 and multi-layer or structurally
gradient DLC 80–82. These approaches can be divided into two main groups 83:
- Doping the carbon coating to suppress the internal stress by changing the uniformity of the over-constraint DLC structure. Table 9 presents the main group of dopants and previous research in this regard.
- A multi-layer or a gradient structure. Some previous research is presented in Table 10.
Table 9- Different types of dopants have been used in various amorphous carbon coatings.
Dopant elements Role Ref.
Inert to carbon metals
Ag Cu
Island formation of dopants due to low chemical affinity with carbon atoms. The nanometer sized segregates can reduce the strength and the directionality of carbon bonds that are responsible for film stress and hardness
6,77–79 Carbide forming metals Ti W Ni Ta
Increase DLC coating adhesion by increasing the integration to its metallic substrate
Table 10- Examples of multi-layer and gradient DLC coatings.
Dopant elements Role Ref.
Multi-layer coatings &
Gradient coatings
A multi-layer structure, in thick coating, restricts crack propagation and thus increases the coating toughness.
a-C:H / a-Si1−xCx:H
80,87
To change the sp3/sp2 ratio through the coating thickness. 81,82
Metal carbide as buffer layer:
- To induce chemical or mechanical bonding between the substrate and the coating
- To provide a transitional modulus and thermal expansion coefficient between that of the DLC and that of the substrate
88
Zr-ZrC/ZrC-DLC 89
The gradient structure is known for the gradual change of structure and therefore the properties through the thickness. One can tailor a DLC coating according to the desired application. For example, one can obtain a higher hardness at the outermost surfaces whilst keeping stronger adhesion to the substrate. The benefit of a gradient structure is that it bears no interface compared to a multi-layer structure. An interface is a thermodynamically high-energy region in a coating structure that may potentially be a weak point.
To design a gradient coating, it is necessary to know the correlation between the structure of nanocoating and the plasma process parameters. Several researchers have studied the effects of process parameters such as: plasma power and pressure. on the properties of DLC coatings 90,91. However, the relationship between such parameters and plasma
characteristics, which directly affect the structure, differs from one reactor to another depending on the configuration of each reactor. Consequently, reproducing identical coatings in different plasma setups require to be done by using a trial and error procedure. One avenue to overcome this problem consists of correlating some plasma characteristics with the DLC coating properties.
Several plasma diagnostic methods have been used to study carbon containing plasma; like electrostatic probes 33–35, optical emission and absorption spectroscopy 36–39, and mass
spectroscopy 40–42. Each studies a specific aspect of plasma and has its own advantages and
disadvantages. The Langmuir probe technique is a practical method of evaluating electron energy distribution inside plasma. The OES technique studies plasma emissions. While both techniques are easy to apply, the first is however an intrusive one that may affect plasma characteristics 43. There are numerous studies on optical spectroscopy of carbon
containing plasmas used either for carbon nanotube production or amorphous carbon coating deposition 36,55,62–64. The knowledge gained from these publications allows the use
of OES as a tool to control the process of DLC coatings through PECVD.
4.2 Hypothesis
The idea is to employ the OES as a plasma online monitoring tool and to establish a correlation between the deposited DLC coating properties and both the independent experimental parameters (plasma power, pressure, precursor gases, etc.) and the data from the OES, which comes from plasma medium. There are some studies on finding correlation between coating properties and experimental parameters 90,91. However, the majority of
these studies considers plasma medium as a black box and has not dealt with plasma characteristics in their models. Therefore, to establish a deposition condition that could be used in any laboratory with any PECVD reactor, one needs to replace experimental parameters with plasma parameters in our model. These plasma parameters can be acquired from different plasma diagnostic techniques. Such a correlation helps to predict future DLC properties based on plasma characteristics independent of process parameters, which are the reactor dependent parameters. This model can then be employed in any other reactor of similar coating processes to design a coating deposition or as a process control tool.
4.3 Objectives
The general objective of the present study is to compare both the PECVD process parameters and OES data as a predictive tool to monitor the DLC structure and its mechanical properties. This will be done by correlating either of the plasma process parameters or the OES data with the DLC structural and mechanical properties through a partial least square analysis.
The second object is to evaluate the possibility of replacing experimental parameters (process parameters) with the related OES derived variables, knowing that a part of the process parameters effects on the plasma medium will be reflected through the OES results. Finally, it is desired to design and to monitor a gradient deposition process using this developed model.
4.4 Materials and methods
4.4.1 Plasma reactor
Amorphous carbon coatings were deposited using an inductively coupled radio frequency PECVD reactor (FLR1200, Plasmionique Inc., Varennes, QC, Canada) over silicon wafers. Figure 10 depicts a schematic setup of the plasma reactor. Methane was used as the source of carbon and hydrogen. A separate LF power supply was employed to induce ion acceleration toward substrates by applying a self-rectified negative bias voltage to the sample holder (as the cathode) with respect to the chamber wall (as the counter electrode). A UV-Vis spectrometer equipped with a 300 lines per mm grating (HR4000CG-UV-NIR, Ocean Optics Inc. Dunedin, FL, USA) was used to record the UV-Visible spectra between 200 and 1100 nm with a spectral resolution of 0.5 nm. The entrance aperture was set to 5 micrometers.
4.4.2 Substrate
Silicon wafer has been widely used as a substrate for DLC deposition mainly because the fact that both Si and diamond have similar atomic structure that facilitate DLC deposition. Here the Si wafer was employed as the substrate (thickness: 500 μm, orientation (100) ±0.5 degree, polished). It is clear that in case of using another type of substrate, it is also necessary to study the substrate effect on final DLC properties.
4.4.3 Pre-deposition process
Silicon substrates were wiped and rinsed with acetone for contamination removal. Then, they were fixed over the substrate holder (using conductive carbon tape) in such a way that ensures proper electrical conductivity between the substrate and samples during plasma processes.
Argon etching
Ar plasma etching (at 100 W, 20 sccm, 50 mTorr, -100 V for 15 min) is then used to remove contaminations in a molecular level from the substrate surface.
Hydrogen etching
Bombarding the substrate by hydrogen atoms helps to activate the surface by removing hydrogen atoms from the surface and leaving some dangling bonds. Now these bonds are ready for further chemical reactions. Hydrogen etching (at 100 W, 10 sccm, 50 mTorr, -150 V for 15 min) was carried out prior to deposition.
DLC deposition
Methane and ethane are frequently used in PECVD of DLC, as a source of carbon and hydrogen. In current study, a constant flow of 7 sccm of CH4 provided the required carbon source to build-up the diamond-like coating during 30 minutes of deposition. Following experimental parameters will be manipulated during DLC depositions:
1. Plasma RF power (P), which is the energy source for gas dissociations, ionization and plasma formation.
2. Plasma power mode (M)- either continuous or pulse mode at 100Hz and duty cycle of 50%.
3. Pressure (p)- the total pressure of the plasma chamber is measured using a Baratron-MKS system and controlled automatically by changing the speed of the turbo molecular pump and the state of the outlet valve.
4. Bias voltage (Vb), which is applied to the substrate holder and is responsible for the
ions acceleration toward the substrate.
Determination of deposition parameters
A series of DLC coatings were deposited based on the above-mentioned four experimental parameters at two different levels (high / low), as described in Table 11. This range of values has been determined after carrying out several preliminary tests and it allows the deposition of DLC coatings with a variety of structural and mechanical properties.
Table 11: The range of experimental parameters employed for DLC deposition. Plasma Power Plasma mode Pressure Bias voltage
Unit [W] - [mTorr] [V]
Label P M P Vb
Low (-) 100 0 for Continuous 10 -50 High (+) 300 1 for Pulse mode
(at 100 Hz) 30 -200
4.4.4 Design of experiments
A fractional factorial design method was employed to determine the combination of experimental parameters for each deposition condition and to reduce the number of experiments 92. Therefore, eight observations (Table 12) with three replicates were
performed (training set). This allowed to build-up the training set of experiments that will be used to develop the statistical model.
A supplementary set of coatings was also deposited for evaluation of the model prediction power (prediction set) (Table 13). The combinations of experimental parameters for the prediction set were chosen among those that do not exist in the training set.
Table 12- the combination of experimental parameters for the training set of experiments. ID Power P Bias V Vb Mode M Pressure p* 1 A + + + + 2 B + + - - 3 C + - + + 4 D + - - - 5 E - + + - 6 F - + - + 7 G - - + - 8 H - - - +
* Pressure is the confounded factor with interaction generated by p=PxM.
Table 13- The combination of experimental parameters for the prediction set of experiments.
ID Power Bias V Mode Pressure
1A P1 - - + +
2C P2 - + + +
3E P3 + - + -
4D P4 - + - -
4.4.5 DLC characterization methods
In prior literature, different characterization techniques have been employed to analyze DLC coating properties and most of them are concentrated on phase determination (sp3
fraction) or evaluation of diamond like properties (Mechanical, optical gap, electrical, etc.)
93.
In this study two main approaches are considered for DLC coating characterization: - Mechanical and physical property characterization.
Profilometry
The thickness of the coating was measured using a stylus profilometer (DektakXT, Bruker, USA) with a force of 3 mg applied on a 12.5 m stylus via a step-height technique.
The internal compressive stress was calculated by measuring the surface curvature before and after the deposition using the same surface profilometer and Stoney’s method 94.
XPS-AES
Various structural analysis methods differ in depth resolution or lateral resolution. The result for a homogenous bulky material would be the same for all of these methods, but not for a DLC coating, which is usually non-uniform. The ternary phase diagram of DLC shows that there are two key parameters that determine final coating structure:
- The sp3 fraction.
- The hydrogen content.
Therefore, the majority of the structural studies are focused on these two parameters 14,18.
Table 14 shows some techniques that are most frequently used to study a DLC structure
14,18.
Table 14: DLC structure analyzing techniques
Type of analysis Technique Studied parameter
Surface analysis
Auger electron spectroscopy (AES) sp3 fraction
X-ray photoelectron spectroscopy (XPS) Low and high energy ion energy loss spectroscopy (EELS)
sp3 fraction
Radial (bulk) analysis
Transmission electron microscopy (TEM) Neutron scattering analysis (ERD, NRA, RBS, NMR, etc.)
H-content, H- distribution, sp3 fraction
Raman spectroscopy (Visible, UV) sp2 phase analysis,
The structure of DLC in the present study, was studied by X-ray excited Auger electron spectroscopy (XAES) 95,96. The D-parameter, which is the distance between the highest
peak and the lowest valley in the first derivative of the C KLL Auger peak, is related to the sp3/sp2 ratio and its values change from about 24 eV for graphite to 14 eV for a perfect
diamond structure 95,97,98. The XAES analysis was carried out from the Auger signal
acquired using a PHI 5600-ci XPS spectrometer with an Al-standard anode in the pseudo-bonding energy range of 1200-1250 eV (Physical Electronics USA, Chanhassen, MN).
4.4.6 Plasma diagnostics - optical emission spectroscopy
The light was collected by a collimator and transferred to a spectrometer (Ocean Optics Inc. model: HR4000CG-UV-NIR, 300 lines per nm grating, entrance aperture: 5um) via a 1mm core UV-Vis optical fiber. This device is capable of recording UV-visible spectra (200 to 1100 nm) with a spectral resolution of 0.5 nm. Detector calibration was carried out using a mercury-argon light source (HG1, Ocean Optics company) with the known spectral line positions. The spectra were recorded using SpectraSuite® software (Ocean Optics company). The light acquisition was done for five seconds and repeated two times at each single measurement. Measurements were carried out at every five minutes during deposition for each single coating process. Spectral studies and analysis were done either by the SpectraSuite® or the GRAMS software.
The following data were studied through recorded spectra at different deposition conditions.
Spectral line profile - FWHM
Referring back to Chapter 3, the spectral line profile carries information from the plasma medium. The width of each line is a result of photon frequency shifts, because of different broadening mechanisms. In low-pressure plasma, the dominant broadening mechanism is the Doppler effect and it is related to gas temperature as described in Eq.(5).
The FWHM of peaks of the emitted spectra, as it was recorded by the spectrometer, contains not only the spectral broadening due to the plasma related mechanisms, but also the broadening induced by the spectrometer. Therefore, it is necessary to process the spectra and to remove the “instrumental function” before using it for the gas temperature (Tg) estimation. However, the resolution of the spectrometer used to perform the
experiments was not sufficient to accurately apply this procedure. Consequently the FWHM measured so far, although not allowing to calculate accurate Tg values, is
different plasma conditions, is directly employed as a plasma parameter to be used in the model.
Actinometry measurements
Actinometry is a technique to estimate relative densities of a ground state species in reactive plasma using OES measurements. According to the discussions in Chapter 3 about the actinometry measurements, the relative intensity of a probed species over that of the actinometer is related to the relative concentration of these two species in ground state. This technique has been employed in the carbon containing plasma process by several authors 72,74. However, the proper use of actinometry requires meeting some critical
assumptions.
First, the two species must be excited from the ground state via a single electron impact excitation. Second, both species must have a similar energy threshold for excitation. In this present study, a known amount of Ar, also used for Ar-etching, was used to perform the actinometry measurements (Ar transition at 750 nm) 36,74. The relative intensity of
CH, and H to that of Ar at different plasma conditions, are employed as an index of concentration for CH and atomic hydrogen. Finally, the predominant de-excitation process should proceed through radiative relaxation, which is the case in this study.
To calculate the exact value of the concentration of each species, one needs to apply the related coefficients to this ratio, as depicted in Eq. (6). Here, we are not looking for the real concentration values. Instead, we need plasma representative parameters to be included in the model. Therefore, the intensity ratios of atomic H and CH species to that of Ar were directly employed.
4.4.7 Statistical analysis
The next step is to analyze the employed parameters and the measured values, in order to determine how the data are correlated to each other. Partial Least Square Regression (PLSR), also known as Projection to Latent Structure (PLS), is a statistical method that is practical for data analyzing when there are numerous, correlated, noisy, and sometimes missing data. It extracts the latent structure of independent (X) and dependent (Y) data set
by finding new coordination systems for X and Y based on vectors along which there is minimum variance between the projected observations (also known as Principal Components (PC) or Latent Variables (LV)). The PCs describe each data space (X or Y) the best. This new coordination system is calculated in such a way that it assures the highest possible covariance between X and Y spaces. Therefore, at the same time, a PLSR model describes the data structure at predictive (X) and predicted (Y) matrices in addition to the correlation between these two 99.
A PLSR model begins by following decompositions of X and Y matrices 99 (when there are
N observations with K variables in X and M responses in Y):
(7) (8) (9)
T and U are called score matrices for X and Y, respectively, and bear the A principal components of the X and Y matrices in their columns. P and C are called loading matrices. E and F are the residuals of the model for X and Y, respectively. W* is called the weight matrix of the PLSR model and contains of the combinations of X variables that gives the best prediction of Y.
In a PLSR model, the T and U matrices are calculated in such a way that a high level of correlation between them is assured. Therefore, the T is also a good predictor of Y:
( 10 )
A combination of Eqs. (3)-(5) will be used for the purpose of the process prediction: ( 11 )
This calculation determines the B matrix, which contains the regression coefficients. Details on multivariate analysis are presented in appendix B.
In this study the process parameters and OES data are considered as X matrix and DLC properties as Y matrix. The multivariate analysis of this study is carried out by ProMV©
software (Ver. 15.02, ProSensus Multivariate). The raw data were first auto-scaled to
XN K TN APAT K EN K YN M UN ACAT M F N M TN A XN KWK A YN M TN ACAT M G N M YN M XN KWK ACTA M GN M XN KBK M GN M