THREE ESSAYS ON IPOS : MOTN ATION AND LONG TERM PERFORMANCE
DISSERTATION
PRESENTED AS PARTIAL REQUIREMENT
FOR THE DEGREE OF DOCTOR OF PHILOSOPHY IN ADMINISTRATION
BY
SALMA BEN AMOR
Service des bibliothèques
Avertissement
La diffusion de cette thèse se fait dans le respect des droits de son auteur, qui a signé le formulaire Autorisation de reproduire et de diffuser un travail de recherche de cycles supérieurs (SDU-522 - Rév.01-2006). Cette autorisation stipule que «conformément à l'article 11 du Règlement no 8 des études de cycles supérieurs, [l'auteur] concède à l'Université du Québec à Montréal une licence non exclusive d'utilisation et de publication de la totalité ou d'une partie importante de [son] travail de recherche pour des fins pédagogiques et non commerciales. Plus précisément, [l'auteur] autorise l'Université du Québec à Montréal à reproduire, diffuser, prêter, distribuer ou vendre des copies de [son] travail de recherche à des fins non commerciales sur quelque support que ce soit, y compris l'Internet. Cette licence et cette autorisation n'entraînent pas une renonciation de [la] part [de l'auteur] à [ses] droits moraux ni à [ses] droits de propriété intellectuelle. Sauf entente contraire, [l'auteur] conserve la liberté de diffuser et de commercialiser ou non ce travail dont [il] possède un exemplaire.»
TROIS ESSAIS SUR LES INTRODUCTIONS EN BOURSE : MOTIVATION ET PERFORMANCE A LONG TERME.
THÉ SE PRÉSENTÉE
COMME EXIGENCE PARTIELLE
DU DOCTORAT EN ADMINISTRATION
PAR
SALMA BEN AMOR
.À mon père, .À mon mari, .À mes deux anges, Osswa et Sima, .À toute la famille Ben Amor et Bensalah
Je tiens particulièrement à exprimer ma profonde reconnaissance au professeur Maher Kooli, mon directeur de thèse, pom la qualité de son encadrement, ses conseils avisés, son écoute, sa disponibilité et ses encouragements. Sa gentillesse, sa générosité et son appui constant tout au long de l'élaboration de ce travail, surtout dans les moments difficiles, ont contribué à la bonne réalisation de cette thèse. J'éprouve une sincère gratitude envers vous,
mon cher professeur.
Mes vifs remerciements vont également à M. Stephen Brown, M. Komlan Sedzro et M. Tolga Cenesizoglu qui m'ont fait l'honneur de pat1iciper à l'évaluation de ma thèse.
Je tiens à remercier mes amis et compagnons de ces années passées au doctorat: Mohamed, Wejdi, Mohamed Sabr, Sang et Mona. Je voudrais remercier tout pat1iculièrement mon ami Mohamed qut n'a pas cessé de me soutenir tout au long de ce parcours. Je n'oublierai toutefois pas le soutien et la gentillesse de Mme Olfa Hamza et de tout le personnel du Département de finance de I'UQAM.
Mes reconnaissances s'adressent aussi à mes collègues de travail et à tout le personnel du Dépat1ement des sciences administratives de l'Université de Québec en Outaouais pom lem accueil chaleureux et leur extrême gentillesse.
Je voudrais enfin exprimer ma profonde gratitude à Ahmed, mon man, pour sa compréhension, sa patience, son soutien et son encouragement durant toutes ces at111ées. Mes remerciements amoureux s'adressent aussi à mes deux anges Osswa et Sima, mes parents, mes frères et mes sœurs. Qu'il trouve dans cette thèse l'expression de ma gratitude et de ma reconnaissance.
LISTE DES TABLEAUX ... vii
LISTE DES FIGURES ... ix
RÉSUMÉ ... x ABSTRACT ... xi INTRODUCTION GÉNÉRALE ... 1 CHAPITRE! ARTICLE 1 ... 5 ABSTRACT ... 7 1.1 Introduction ... 8
1.2. Hypotheses development and construction of variables ... !! 1.2.1 Ownership structure hypothesis ... 11
1.2.2 Venture capital backing hypothesis ... 13
1.2.3 Information asymmetry and the acquisition currency hypothesis ... 14
1.2.4 Cross-holdings hypothesis ... 16
1.2.5 Control variables ... 17
1.3 Data and samp1e selection ... 19
1.4 Results ... 26
1.4.1 Univariate results ... 26
1.4.2 Determinants of post-IPO acquisition activity ... 29
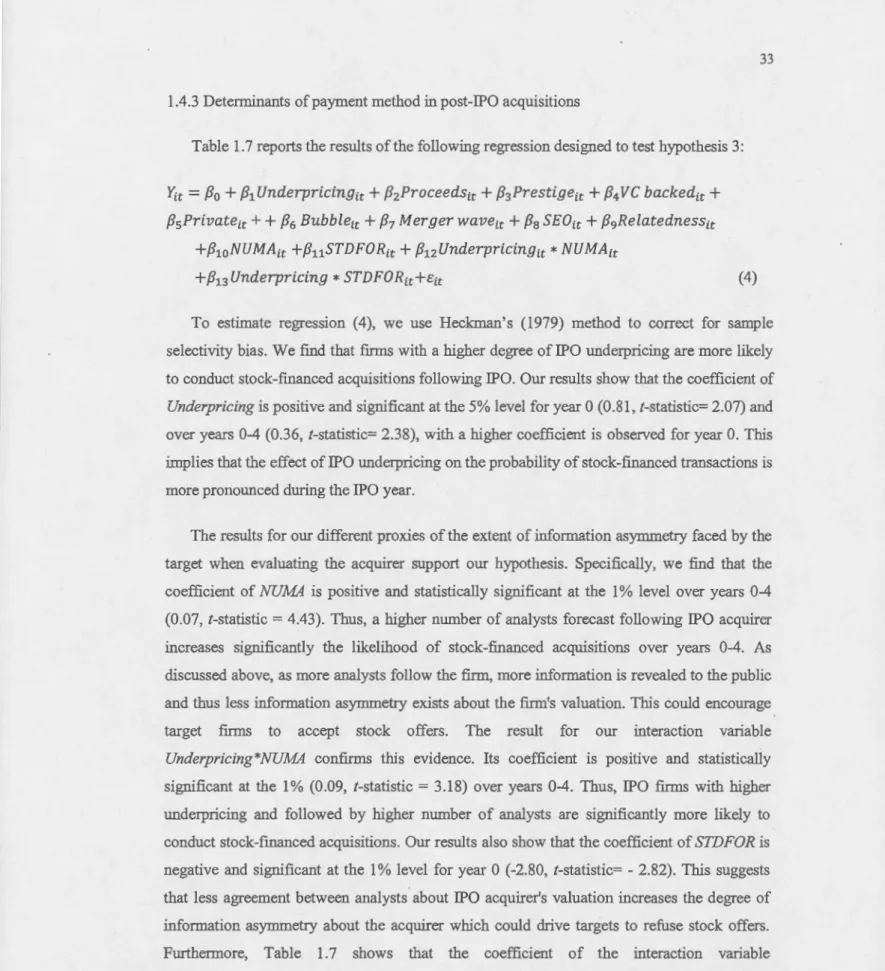
1.4.3 Determinants of payment method in post-IPO acquisitions ... 33
1.5 Determinants of frequent acquisitions by IPO fmns ... 39
1.6 Robustness tests ... .43 1.7 Conclusions ... : ... .47 REFERENCES ... .49 CHAPITRE II ARTICLE 2 ... 53 ABSTRACT ... 55 2.1 Introduction ... 56
2.2 Litera ture review ... 56
2.4 Ernpirical results ... 67
2.4.1 UnivaTiateresults ... 67
2.4.2 Robustness tests ... .-... 74
2.4.3 MultivaTiate results ... 78
2.4.4 Survival analysis ofiPO acquiTers ... 82
2.5 Conclusion ... 89
REFERENCES ... 91 CHAPITRE III ARTICLE 3 ... 94
ABSTRACT ... 96
3.1 Introduction ... 97
3.2 Litera ture review ... 1 00 3.3 Data and methodology ... 101
3.3 .1 Sarnp1e selection and use of proceeds classification ... 1 01 3.4 Methodology ... 105
3.4.1 Long-run stock performance ... 1 05 3.4.2 Long-run operating performance ... 107 3.5 Empmcal results ... 108
3.5 .1 Long-run stock performance ... 1 08 3.5.2 Long-run operating perforrnance ... 115
3.5.3 Robustness test: IPO survival profile ... 121
3.6 Conclusion ... 124 REFERENCES ... 126 CONCLUSION GÉNÉRALE ... 128 RÉFÉRENCES ... 131
Tableau Page
1.1 Variables, descriptions'<md their expected signs ... 19
1.2 Descriptive statistics ofiPO sample ... 21 1.3 Descriptive statistics ofM&A sample ... 23
1.4 Acquisition activity of IPO frrms over tirne ... 25
1.5 Summary statistics and uni varia te tests ... 28
1.6 IPO characteristics and the likelihood of an acquisition ... 32
1. 7 Logit regressions re garding the choice of payment method ... 35
1.8 Cross-holdings and payment method in post-IPO acquisitions ... 38
1.9 IPO characteristics and the likelihood of frequent acquisitions by IPO fm11s ... .42 1.10 Survival analysis results ... .44
1.11 Ordered logit regressions re garding the choice of payment method ... .46
2.1 Frequency Distribution by IPO Year ... 64
2.2 Industry distribution ... 65
2.3 Cumulative abnormal retums excluding the frrst year ... 69
2.4 Cumulative abnormal returns for frrst year frequent and non-frequent IPO acquirers ... 71
2.5 Calendar tirne factor mode] regressions ... 73
2.6 Decomposition of frrst-year returns for frequent IPO acquirers ... 75
2.7 .Cumulative abnormal retums for overlapping and non-overlapping cases ... 77
2.8 Multiple regressions results ... 81 2.9 Multinomiallogit regression results ... 85 2.10 Accelerated Failure Tin1e (AFT) model results ... 88
3.1 Sample summary statistics ... 1 04 3.2 Mean cumulative abnormal retums ... 109
3.3 Calendar time regressions of long run stock returns ... 113
3.4 Multivariate regressions explaining post-IPO perfonnance ... 114
3.6 Operating performance changes based on industry and pre-IPO perfonnance adjusted
measures ... 117 3. 7 Multivariate regression analysis of operating in come changes ... 119 3.8 Multivariate Cox Hazard regression ... 123
Figure Page
1.1 Aggregate IPO activity, aggregate acquisition activity and acquisition
activity by IPOs ... 24 1.2 Acquisition deal values and IPO proceeds by year. ... 24 1.3 Number of acquisitions, number of IPOs and number of IPOs making acquisitions
by industry ... 26
La présente thèse examine trois questions fondamentales liées aux emiSSions initiales d'actions. Le premier chapitre examine les déterminants des opérations de fusions et acquisitions dans les cinq aimées subséquentes à l'introduction en bourse. Nos résultats montrent que le changement dans la prop01tion d'actions détenues par les initiés et la présence de spécialistes de capital de risque sont associés positivement à la probabilité qu'une entreprise introduite en bourse s'engage dans des opérations de fusion-acquisition. Nous montrons aussi qu'une plus grande asymétrie d'information affrontée par la cible lors de l'évaluation de l'acquéreur diminue la probabilité de s'engager dans des acquisitions par actions. En outre, il ressort de nos résultats que la probabilité de s'engager dans une série d'acquisition est liée positivement à la sous-évaluation initiale et aux émissions subséquentes.
Le deuxième chapitre examine l'effet des opérations multiples de fusion-acquisition réalisées durant la première année après 1' introduction en bourse sur la performance financière à long terme et la survie des entreprises nouvellement introduites. En utilisant différentes approches, nos résultats montrent que la détérioration de la performance sur cinq ans des entreprises ayant réalisées plusieurs acquisitions, pendant la première am1ée, est significativement plus marquée que celle des entreprises ayant effectuées une seule acquisition indépendamment de l'indice de référence utilisé. Nos tests empiriques montrent aussi que la probabilité de non-survie des entreprises introduites en bourse est associée positivement au nombre d'acquisitions réalisées durant la première am1ée après cotation.
Dans le troisième chapitre, nous explorons la relation entre l'utilisation prévue des fonds levés lors de l'introduction en bourse et la performance financière et opérati01melle des entreprises introduites. Nous examinons quatre catégories d'utilisation prévue de fonds : investissement, réduction de la dette, marketing ou promotion des ventes et objectifs généraux. Nos résultats montrent que les entreprises qui ont annoncé que les fonds levés seront utilisés pour des fins d'investissement ont réalisé la plus faible dégradation de la performance financière ou opérationnelle sur les trois ans d'après introduction. Toutefois,
lorsque l'utilisation prévue des fonds est le paiement des dettes, la sous-perfom1ance devient significativement imp01tante. Nos résultats suggèrent que le marché réagit favorablement aux
intentions d'investissement et défavorablement aux intentions de paiements de dettes annoncées par les entreprises.
This thesis investigates three fundamental issues regarding initial public offerings (IPOs). The frrst chapter examines the acquisition motive for IPOs in the five years following their going public. We fmd that high change in insider ownership post-IPO positively affects the likelihood of an IPO frrm to engage in acquisition. Our results also show that venture-backed IPOs are more likely to make acquisitions than their counterparts. We show that high extent of information asymmetry faced by the target when evaluating the acquirer decreases the likelihood of stock-financed acquisitions and that IPO fm11S with higher underpricing and those conducting seasoned equity offerings (SEOs) are more likely to be frequent acquirers.
The second chapter examines whether making frequent acquisitions in the first year of the IPO affect the long-run stock performance and the survival profile ofiPOs differently than do in:frequent acquisitions. Using different approaches, we fmd that frequent acquirers experience significantly poorer performance in the five years following the IPO than in:frequent acquirers regardless of the benchmark used. Our empirical tests also show that being a frequent acquirer in the first year after going public increases the probability of not surviving and that the higher the number of acquisitions is, the higher is the probability of not surviving.
In the third chapter, we explore the role of intended use of proceeds on explaining the long run stock and opera ting performance of IPO firms. W e examine four categories of use of proceeds: investment, debt repayment, marketing and sales promotion and general corporate purposes. Our results show that IPOs stated investment as primary use of proceeds exhibits little or no underperformance in the three years following the IPO. However, when the stated use of proceeds is debt payrnent, IPO fums experience poor and significant underperfom1ance. Our results suggest that the market will react favorably for IPOs specifying investment plans for the use of proceeds while it has less favorable view for tho se stating debt repayment.
L'introduction en bourse ou l'émission initiale d'actions représente une étape cruciale
dans la vie d'une entreprise. Elle offre aux entreprises émettrices plusieurs avantages. Elle
leur donne la possibilité de lever des fonds propres nécessaires pour Je financement et le
développement de leur croissance. Elle représente un mécanisme de so1iie pour les bailleurs
de fonds. Elle améliore la notoriété de la société cotée sur Je plan financier et commercial, offre une visibilité permanente à travers J'attention régulière portée à l'évolution de ses
résultats et renforce sa crédibilité sur le plan national et international qui constitue un vecteur important de croissance.
Les études empiriques sur les introductions en bourse ont généralement examiné le comportement boursier à cowi, moyen et long terme des entreprises émettrices et tenté
d'expliquer plusieurs anomalies. qu'on associent aux émissions initiales, par exemples, la sous-évaluation initiale ou «underpricing», la contre-perfonnance à long terme et le
regroupement des émissions pendant les périodes de fo1ies activités « hot issues ». Récemment, les travaux sur les introductions en bourse se sont orientés vers l'étude des décisions corporatives prises par l'entreprise après son introduction en bourse, notamment les
opérations de fusion-acquisition. Ce sujet a suscité l'intérêt de plusieurs chercheurs. Par exemple, Brau et Fawcett (2006) ont envoyé un questionnaire à 336 responsables financiers afin d'identifier les motivations de s'introduite en bourse. Ces auteurs constatent que les deux principales motivations d'une entreprise à s'introduire en bourse est l'établissement d'une
valeur au marché des titres et la création d'un moyen de paiement pour les prochaines
acquisitions. Cependant, les études empiriques ayant tenté d'expliquer le rôle joué par l'introduction en bourse dans le développement des opérations de fusion-acquisition restent rares. Pourtant, Celikyurt et al. (2010) ont analysé l'activité des fusions et acquisitions de 1295 entreprises introduites en bourse entre 1985 et 2004 et ont constaté que l'appétit de ces entreprises à s'engager dans des transactions d'acquisition a augmenté après leurs introductions en bourse. Également, Ritter et al. (2013) ont montré que le nombre
d'entreprises nouvellement introduites en bourse qui deviennent acquéreuses ou acquises
dans les années post-émission a augmenté au cours du temps. Dans ce travail de recherche,
nous proposons d'explorer la relation entre l'introduction en bourse et les opérations de
fusions et acquisition. Il comporte trois chapitres, visant chacune des objectifs spécifiques et
se fondant sur une méthodologie propre.
Le premier chapitre examine les déterminants des opérations de fusion-acquisition
réalisées par les entreprises nouvellement introduites en bourse durant les cinq années suivant
l'émission. En premier temps, nous testons l'impact du changement de la structure de propriété après la cotation sur la probabilité qu'une entreprise s'engage dans des transactions d'acquisition. Notre objectif est d'évaluer l'effet du changement du pourcentage détenu par
les initiés après la cotation sur la probabilité d'effectuer des opérations de fusion-acquisition
durant les cinq années après 1' introduction en bourse. Par ailleurs, les études antérieures ont
montré que les entreprises soutenues par des capital-investisseurs ont une meilleure
performance financière. Nous proposons ainsi d'évaluer si l'appo1t en capital de risque aide
l'entreprise nouvellement introduite en bourse à s'engager dans des opérations de
fusion-acquisition. En deuxième temps, nous mettons l'accent sur les facteurs qui peuvent expliquer
le mode de paiement des opérations d'acquisition post-émission. Celikyurt et al. (2010) ont
montré que la sous-évaluation initiale des entreprises introduites en bourse est liée
positivement à la probabilité de s'engager dans des acquisitions par actions. Cependant, ces
auteurs n'ont pas tenu compte de l'asymétrie d'information qui peut exister entre l'entreprise émettrice et l'entreprise cible. Nous estimons que si l'entreprise cible est confrontée à un
niveau élevé d'information asymétrique, elle pourrait refuser l'offre par actions pour éviter de
recevoir des actions surévaluées. Nous examinons par la suite le rôle joué par les
investisseurs institutionnels dans le choix de mode de paiement. Les travaux antérieurs ont
démontré que les investisseurs institutionnels qui détiem1ent en même temps des actions dans l'entreprise acquéreuse et dans l'entreprise cible participent activement dans la décision d'acquisition et le choix de l'entreprise cible (Matvos et Ostrovsky, 2008; Harford et al.,
2011 ). Cependant, aucune étude empirique n'a examiné 1 'effet de ces investisseurs communs
sur le choix du mode de paiement des acquisitions. Finalement, nous effectuons un lien entre
dans les cinq années suivant l'émission. Notre objectif ici est d'expliquer pourquoi une
entreprise tend à s'engager dans une série d'acquisitions successives alors qu'une autre ne réalise qu'une seule acquisition durant cette période. Nos résultats montrent que la probabilité de faire une acquisition durant les cinq années suivant l'émission est liée
positivement au degré de changement du pourcentage d'actions détenues par les initiés et à la présence d'un capital-investissem dans le processus d'introduction en bourse. Nous montrons
aussi que l'information asymétrique affrontée par la société cible lorsqu'elle évalue les actions de l'entreprise acquéreuse est associée négativement à la probabilité de s'engager
dans des acquisitions par actions. De plus, nos résultats montrent que les investisseurs
institutionnels communs jouent un rôle impo1tant dans le choix de mode de paiement dans les
opérations d'acquisition post-émission. Nos tests empiriques révèlent aussi que le degré de
sous-évaluation et les émissions subséquentes sont liés positivement à la probabilité qu'une
entreprise introduite en bourse réalise plusieurs opérations d'acquisition successives durant les cinq années subséquentes à 1' introduction en bourse.
Le deuxième chapitre s'intéresse à l'impact de l'activité de fusion-acquisition sur la
performance à long terme et la survie des entreprises introduites en bourse. Les études antérieures ont démontré que les entreprises introduites en bourse ont tendance à effectuer
une série d'acquisitions successives dans la comte durée après leur cotation. Celikyurt et al.
(2010) constatent que 77% des entreprises introduites en bourse s'engagent dans des
opérations de fusion-acquisition dans les cinq années suivant 1' introduction et que ces
entrepiises effectuent, en moyenne, 3,64 acquisitions durant la même période. D'après Hovakimian et al. (201 0), les entreprises introduites en bourse accomplissent en moyenne 2
acquisitions durant les 3 ans post-émission. Ce travail se distingue des études antérieures en
quatre points. Tout d'abord, nous effectuons une comparaison entre la performance financière
à long terme des entreprises introduites en bourse qui ont réalisé une seule acquisition durant la première année après l'émission de celles qui ont réalisé plusieurs acquisitions durant la même période. Ensuite, nous tenons compte du problème de regroupement des acquisitions durant la période de calcul des rentabilités. Notre objectif est de corriger le biais qui peut exister dans le calcul des rendements anom1aux puisque tout nouvel évènement corporatif
donJlé que les résultats de pe1formance dépendent étroitement du choix du groupe de comparaison dans les méthodes de calcul des rendements anom1aux, nous utilisons la méthode d'appariement sur le score de propension (propensity score matching). Il s'agit d'une nouvelle technique statistique qui a l'avantage d'apparier les entreprises en tenant compte de plusieurs dimensions simultanément. Ainsi, elle permet de neutraliser le biais de sélection lié au choix du groupe de contrôle. La dernière section du chapitre 2 est consacrée à
l'analyse de survie des entreprises introduites en bourse qui s'engagent dans des opérations d'acquisition la première année après la cotation. Nos tests empiriques montrent dans l'ensemble une plus faible sous performance pour les entreprises introduites en bourse qui ont effectué plusieurs acquisitions une a1111ée après la cotation. Notre étude de survie révèle que la probabilité de non-survie après l'introduction en bourse augmente avec le nombre d'acquisitions réalisées durant la première année après cotation.
Le troisième chapitre vise à examiner la relation entre l'utilisation prévue des fonds levés lors de l'introduction en bourse et la performance financière et opérationnelle à long terme des entreprises. Les travaux antérieurs ont principalement considéré le cas des émissions subséquentes d'entreprises publiques (Walker et Y ost, 2008; Autore et al., 2009) et à notre connaissance, aucune étude antérieure n'a exploré cette question de recherche pour les émissions initiales d'actions. Nous nous intéressons particulièrement à quatre utilisations souvent mentionnées dans les prospectus avant l'introduction en bourse à savoir: (i) le développement de la croissance ou investissement (autrement dit les fonds levés seront utilisés pour financer la croissance à travers soit des acquisitions, des dépenses en recherche et développement ou des dépenses d'investissement du capital), (ii) la réduction de la dette, (iii) la promotion des ventes ou marketing, et (iv) objectifs généraux (les entreprises qui ont choisi de ne pas donner une raison claire pour leur utilisation). Dans l'ensemble, nos analyses révèlent qu'il y a une différence significative entTe les performances fmancières et opérationnelles des quatre groupes étudiés. Plus spécifiquement, une plus faible performance est observée pour les entreprises qui ont déclru·é que les fonds levés seront utilisés pour payer une partie de la dette.
Salma Ben Amor Ph. D. Candidate ESG-UQÀM MaherKooli Professer, Department ofFinance Université du Québec à Montréal
We investigate the acquisition motive for initial public offerings (IPO) in the five years following their IPO. We find that high change in insider ownership post-PO positively influence the likelihood of an IPO finn to engage in acquisition and that venture-backed IPOs are more likely to make acquisitions than their counterparts. We also show that high extent of infom1ation asymmetry faced by the target when evaluating the acquirer decreases the likelihood of stock-financed acquisitions. Fwihem1ore, we find that IPO fin11S with higher underpricing and those that make seasoned equity offerings are significantly more likely to be frequent acquirers. Overall, our findings confmn that an IPO represents an opportunity for new issuers to become acquirers and even frequent acquirers.
JEL: G32, G34
Keywords: initial public offerings, acquisitions, mergers
We thank Stephan Gasser (EFMA discussant), Xiaowei Xu (NF A discussant), Soun1endra De (FMA discussant) and seminar participants at the 2013 FMA Meeting, 2013 NFA Meeting and 2013 EFMA Meeting for many helpful comments and suggestions. We gratefully acknow led ge the financial suppo1i of the CDPQ Research Chair in P01ifolio Management of the School of Management (UQAM) and the SSRH. We are responsible for any remaining errors.
"1 see M&A as the upside to our core case. There are a lot of opportunities to build our position, bath in frozen and d1y (foods). "1
Robert Gamgort, Pinnacle Foods CEO - after Pinnacle Foods' IPO (March 28tl', 2013)
Why some fun1s go public while others continue to be p1ivate remains an in1p01tant question in corporate finance. Despite the existence of many theories addressing this question, lack of data on private firms before they become public linuts the development of empirical research. Pagano et al. (1998) have conducted one of the few empirical studies2 that exan1ine the motives for initial public offerings (IPOs). Having access to a unique data set covering accounting infonnation for a large sample of privately and publicly held firms in Ital y, they fmd that Italian fi1ms go public to rebalance their capital structure after a pe1iod of high investment and growth rather than fmance subsequent investment. Other studies have used surveys of corporate executives to empirically test the motivation for going public. For instance, Brau and Fawcett (2006) survey 336 chief fmancial officers and find that the creation of an acquisition currency and the establishment of market priee are the two most important reasons for going public. Based on Brau and Fawcett (2006)'s fmdings, Celikyurt et al. (20 1 0) explore the acquisition motive for IPOs. Their results show that 77% of firms make at least one acquisition within the fmt five years of the IPO and that the typical IPO finn makes four acquisitions in this five-year period. Wiggenhom et al. (2007) exan1ine the acquisition activity of over 5,000 US firms that went public during the 1992-2001 time period and fmd that there were more than 400 acquisitions made by new ly public firms within a year of going public, while less than 100 were targeted for takeovers. Hovakimian and Hutten (2010) fmd that 36% of IPOs complete at least one acquisition in the tl1ree years following
1
Robert Gamgort, Pinnacle Foods CEO was Interviewed after Pinnacle Foods' IPO (March 28ù', 2013) at CNBC's "Squawk on the Street" and reported by Paul Toscane (http://www.cnbc.com/idll 00600 175).
2 Rosen et al. (2005) also examine how the probability of going public is affected by various bank characteristics and find that banks with higher profits and more leverage are more likely to go public.
the IPO and, on average, an IPO fmn makes two mergers and acquisitions (M&As) within the same time period. Their results con:firm that IPOs facilitate subsequent acquisitions, using the cash raised at the IPO. Ritter et al. (2013) also confim1 that too many IPO fm11S are subsequently involved in M&A deals, either as a target or an acquirer. Hsieh et al. (2011) propose a mode! that links a firm's decision to go public with its subsequent acquisition activity. They focus on the informational role of IPOs by suggesting that IPOs reduce the valuation uncertainty of the bidder leading to a more efficient acquisition strategy. They fmd that the costs of going public are positively related to the likelihood of observing a merger within five years of an IPO.
Our study contributes to this literature in severa! ways. First, we examine why IPO fmns become acquirers shortly after their going public. In pa1ticular, we investigate the impact of post-IPO change in insider ownership on the likelihood of making acquisitions in the post-IPO period. Our rationale is that ownership dispersion following IPO could increase agency problems between shareholders and managers who may refuse any corporate decisions for entrenchment pw-poses (Jensen and Meckling, 1976; Mikkleson, 1997). Additionally, the role of venture capital in the IPO market is important and has been the subject of considerable debate in finance. For instance, numerous studies have examined the influence of venture capitalist stock holdings on IPO firm valuation, underpricing, and long-term performance (see Megginson and Weiss, 1991; Barry et al., 1990; Brav and Gompers, 1997, among others). In this paper, we contribute to this strand of literature by examining the effect of IPO venture backing on the likelihood of conducting acquisitions. Specifically, we analyse the acquisition activity of IPO fmns during the lockup period and investigate whether venture backing influences the likelihood of IPO fmns to conduct acquisitions during this period.
Second, we investigate the method of payment in M&As following IPO. Celikyurt et al. (2010) show that an IPO creates publicly traded stock that can be used as a fonn ofpayment for acquisitions. They suggest that IPO fmns with greater underpricing conduct more stock-financed acquisitions. However, these authors do not consider the level of information asymmetry faced by the target fmn when evaluating the IPO acquirer. We expect that an IPO fmn could use theil· overvalued stocks to pay for acquisitions only when the target shows a willingness to accept such an offer. Otherwise, the deal would not succeed. In other words,
the degree of information asynm1etry faced by the target when evaluating the acquirer could
decrease the likelihood of an IPO firm with high leve! of underpricing to engage in a stock
-fmanced acquisition. In addition, we explore whether institutional cross-holdings influence
the payment method in post-IPO acquisitions. This issue is not addressed in prior literature
although previous studies argue that institutional shareholders could affect managerial
corporate decisions including M&As (Harford and Li, 2007; Harford et al., 2011).
Third, our paper innovates by distinguishing between frequent and infrequent acquirers
and examining why some IPO fmns engage in only one acquisition while others carry out
frequent acquisitions in the years immediately following their IPO. The comparison between
these two types of acquirers could indeed add to our understanding of managerial behaviour.
Finally, we cover the period from January 1980 to December 2010 and use a larger
sample of IPOs3 (6,705) than those found in previous studies which allows us to draw
conclusions with greater confidence.
We fmd that higher change in insider ownership following IPO increases the probability
of IPO mergers in the five years following the IPO, suggesting that IPOs in which post-IPO
insider o.wnership remains high tend to avoid acquisitions in the post-IPO period. T1ùs result
could be explained by managerial entrenchment purposes. Consistent with the predictions of
the venture backing hypothesis, we fi.nd that venture-backed IPOs are more likely to engage
in acquisitions within five years following IPO than non-venture-backed IPOs. However,
they are less likely to engage in M&A activity during the lockup period, suggesting that the
pressure of venture capitalists to disengage from the IPO firm may drive them to avoid
acquisitions during this period as any new corporate event will change the fundamentals and
the risk profile of the company.
Exanùning the determinants of payment method in post-IPO acquisitions, we fmd that
IPOs with high degree of underpricing conduct more stock-financed acquisitions after the
3
Our final sample includes 2,547 IPOs firms involved in 5,853 mergers and 4,158 IPOs fmns that did not conduct any acquisitions during the five years following the IPO date. Hovakimian and Hutton (2010)'s sample, for example, includes 2,059
œo
fmns conducting 4,265 mergers and 3,712 IPO fmns without any acquisitions in the frrst tlrree years after the IPO. Celikyurt et al. (2010) consider 1,295 IPOs with IPO proceeds greater than $100 million (in 2004 dollars).IPO. However, higher extent of information asymmetry faced by the target when evaluating the acquirer decreases the likelihood of stock being used in acquisitions. Our results show that IPO fm11S may not be able to exploit thei.r overvalued stocks to pay for acquisitions when there is a high level of infom1ation asynm1etry between the acquirer and the target. Investigating the role of cross-holdings in explaining which acquisition payment method IPO fmns may choose, we fmd that IPO acquirers with a high level of cross-holdings are more likely to conduct stock-financed acquisitions.
Overall, our results suggest that specifie IPO characteristics significantly influence not only post-IPO acquisition decisions, but also the choice of the paYJnent method in such events. Our findings also show that IPOs with higher underpricing and those that make seasoned equity offerings are significantly more likely to be frequent acquirers
The paper is organized as follows. In section 2, we present our hypotheses. Data and sample selection are discussed in section 3. In section 4, we present our empirical results. Section 5 analyses the detenninants of frequent acquisitions by IPO fmns. In section 6, we run some robustness tests. Section 7 concludes.
1.2. Hypotheses development and construction of variables
Our first and second hypotheses focus on the effects of ownership structure and venture capital backing on the likelihood of an acquisition, while our third and fourth hypotheses focus on the effects of infom1ation asymmetry and cross-holdings on the acquisition method ofpayment in post-IPO M&As.
1.2.1 Ownership structure hypothesis
Previous IPO literature has shawn that the transition from private to public ownership via an IPO has a significant effect on the fmn's ownership structure. Specifically, previous results have shawn that insider ownership, including management ownership, decreases while extemal blockholders increase after the IPO. Mikkelson et al. (1997) analyse a san1ple of283
U.S. IPOs thé:!t occmred dming the 1980-1983 period. They find that the median ownership stake of the officers and directors declines significantly from the year before the IPO to ten yea.rs later. Roosenboom and Goot (2005) examine the ownership structme of 118 IPOs in the Netherlands. They fmd that management stock ownership declines from 42.5% to 28.6% after the IPO. Alavi et al. (2008) investigate the impact of the pre-issue ownership structure on key decisions su.rrounding an IPO using 565 Australian fm11S that went public between 1995 and 2005. They find that the pre-IPO managerial ownersh.ip decreases from 46.07% to
30.18% and that new blockholder ownersh.ip emerges, representing 3.62%. Besicles the change in the ownership structure, IPOs also drive the dilution of stock ownership, which
could increase agency problems between managers and shareholders. Jensen and Meckling (1976) argue that the interest of managers and other stockl1olders becomes less closely
aligned as managers' stakes decrease and the ownership becomes more dispersed. Post-IPO
agency problems are likely to be acute during corporate control events such as acquisitions. In fact, the incentives of managers and shareholders could diverge when newly public fm11S
decide to engage in acquisition. Managers who are afraid of losing control and motivated by
managerial entrench.ment are more likely to pursue their own interest rather than that of the
shareholders in the acquisition event. Jensen (1986) suggests that managers of fums with
large free cash flows are more likely to undeJiake low-benefit or even value-destroying
mergers reducing the value of their firms. To the extent that the funds raised in IPOs increase the free cash flow available to the fmns' managers, conflicts of interest between shareholders
and managers tend to be more severe. Taking these results into account, we expect that IPO
finns with high change in their insider ownership may be inclined to engage in more
Hl: The likelihood of an IPO finn to engage in an acquisition is positively associated with
the change in their insider ownership.
To test this hypothesis, we use the change in insider ownership (CRINS) as a measure of
inside ownership for each IPO finn. Insider ownership change is defmed as the absolute
value of the difference between post-IPO and pre-IPO inside ownership as rep01ted in the
Thomson Financial's SDC New Issues database.
1.2.2 Venture capital backing hypothesis
Numerous studies have examined the influence of venture capitalist (VC) stock holdings
on IPO finn valuation, underpricing, and long-te1m perfonnance. Megginson and Weiss
(1991) examine the role ofVC certification by comparing U.S. VC-backed IPOs to
non-VC-backed IPOs matched by industry and offering size between 1983 and 1987. They find that
the first day returns of VC-backed IPOs are significantly lower than those of non-VC-backed
IPOs. Barry et al. (1990) suggest that VCs could take an active role in monitoring comparues
that they have invested in since they own significant equity positions and therefore can
participate directly in the govemance of their portfolio f11TI1s. They fmd that ownership, the
length of board service, and the number of venture capitalists invested in the pre-IPO firm are
negatively related to IPO underpricing. Brav and Gompers (1997) examine the effect of V Cs
on the long-run perfonnance of newly public firms using a sample of 934 venture-backed
IPOs and 3,407 non-venture-backed IPOs during the period 1972-1992. They find that VC
IPOs outperform non-VC IPOs using equally weighted returns. Krishnan et al. (2011)
examine the relation between several VC reputation measures and subsequent IPO issuer
perfom1ance. They confmn that VC reputation affects the long-tenn performance of IPOs.
Ragozzino and Reuer (2007) consider IPOs as an information diffusion mechanism that can
help to reduce the information asymmetry between bidders and target fmns in M&A activity.
They suggest that the involvement of a VC at the time of an IPO can signal the quality of an
entreprenewial fmn. Consistent with this view, we consider that VCs facilitate post-IPO
acquisitions as they provide skills and M&A expertise as well as external relationships that a
H2a: VC-backed IPO finns are more likely to conduct an acquisition after the offering that non-VC-backed ones.
Nevertheless, newly public fmns could suffer from the venture capitalist involvement when conflicts of interest arise in the post-IPO period. Previous literature suggests that VCs sell their shares more aggressively than other shareholders at the expiration of the lockup period. Brav and Gompers (1999) examine the priee reaction at the time of the lock-up expiration and find that VC-backed IPO firms have priee declines that are more than 2% grea ter than non-VC fim1s at lockup expiration. They suggest that VC-backed IPOs could be associated with a larger number of shares coming to market when the lock-up expires. Field and Hanka (200 1) examine insider share sales in the year after the IPO using l ,948 lockup agreements in the period from 1988 to 1997. They fmd that VC investors sell more aggressively than other pre-IPO shareholders. Examining the trading volume and abnormal returns around the expiration date, they fmd that the three-day abnonnal return is almost three times larger for venture financed fums than non-venture financed fu111s. They also find that the tlu·ee-day abnom1al volume is five times higher for venture-backed fmns. These results suggest that VCs have an incentive to sell theil: shares quickly after the IPO. To the extent that VCs want to disengage from their relationship with the IPO fim1 and to cash out rapidly after the IPO, they could discourage any acquisition during the lockup petiod. This leads to the following hypothesis:
H2b: VC-backed IPOs are less likely to make acquisitions during the lockup period than non -VC-backed IPOs.
To test this hypothesis, we use VC backed, a dummy variable that takes the value of 1 if the IPO is backed by a venture capital fitm, and zero otherwise. Following Arikan and Capron (20 1 0), we construct a continuous measure for the lockup period (Lockup) by taking the natural logarithm of the number of da ys between the IPO date and expiration date.
1.2.3 Infonnation asynunetry and the acquisition cunency hypothesis
Prior empirical studies argue that an IPO creates publicly traded stock that can be used by newly public fums as a form of acquisition payment. Given the information asymmetry
between bidders and potential target fim1s, the former could issue overvalued stocks to pay
for future acquisitions. Shleifer and Vishny (2003) argue that many frrms have incentive to
exploit overvalued equity when making an acquisition. Their theoretical model shows that fums with overvalued stocks are more likely to conduct acquisitions, survive, and grow, while frrms with undervalued equity are more likely to become takeover targets. Celikyurt et al. (201 0) fmd that IPO fm11S with high degree of underpricing conduct more stock-fmanced acquisitions ·after the IPO. They suggest that fim1s go public to exploit acquisition opportunities when their equity is overvalued. However, the use of overva]ued stocks to pay for acquisitions is close! y related to the extent of infonnation asynm1etry between buyers and sellers in the M&A market. In fact, the success of a stock-fmanced acquisition depends on the
willingness of the target to accept such an offer. When faced with an equity offer, the target might realize that the IPO fim1 wishes to use overvalued stocks to pay for the acquisition and thus might refuse the offer. Chemmanur et al. (2009) examine a sample of publicly traded acquirers and target firms involved in 817 acquisitions announced between 1978 and 2004. They fmd that a higher probability of cash offerings is associated with high extent of infonnation asymmetry faced by the target when evaluating the acquirer. They suggest that the choice of the exchange medium in acquisitions is detemuned by the private infonnation
held sirnultaneously by the acquirer and target frrm. Consistent with this view, we consider
that the success of a stock-financed acquisition using overvalued stocks is related to the degree of the information asynm1etry the target faces when evaluating the acquirer. Thus, we propose the following:
H3: The probability of stock-fmanced acquisitions is negatively associated with the extent of information asymmetry faced by the target in its evaluation of the acquirer.
Following Celikyurt et al. (2010), we use Underpricing as a measure of overvaluation around the IPO, which is defmed as the priee run-up in the fu-st trading day after the IPO and measured as the difference between the flrst day closing priee over the offer priee. To measure the extent of information asymmetry faced by the target when evaluating the acquirer, we use two proxies as Chemmanur, Paeglis, and Simonyan (2009). The frrst one is
the number of analysts following the acquirer (NUMA). A higher number of analysts implies lower information asymmetry. Bhushan (1989) shows that more analysts following indicates that more private information will be disseminated to outside investors. Hongjun et al. (2007) also fmd that analyst activity leads to h:igher priee information content. The second measure we consider is the standard deviation of analyst forecasts (STDFOR). A larger standard
deviation implies less agreement between analysts and consequently a higher level of information asymmetry. These proxies are calculated, as reported by IBES, for the last month of the fiscal year preceding the acquisition announcement.
1.2.4 Cross-holdings hypothesis
Recent empirical studies emphasize the influence of shareholder cross-holdings on managerial corporate decisions including M&As. Matvos and Ostrovsky (2008) suggest that institutional shareholders of acquiring companies which hold substantial stakes in the target flrms are more likely to vote for mergers with negative acquirer mmouncement returns
because they can make up for the acquirers' !osses with the gains from the targets. They point
out a con:flict of interest between shareholders who hold only shares in the acquirer and the cross-owners. They show that cross-owners are more likely to vote for mergers with negative
returns than shareholders holding only shares in the acquirer, but not in the ones with positive returns. Harford et al. (2011) suggest that cross-holdings influence target selection. They find that the bidder managers consider their shareholders' cross-holdings when selecting merger targets. Other studies argue that deals driven by acquirer stock overvaluation do not produce the necessary synergy gains (Harford and Li, 2007; Gu and Lev, 2011). Fangjian et al. (2012) find a decrease in the acquirer's stock priee and an increase in the target's stock priee after the deal announcement for acquisition motivated by acquirer stock overvaluation. They suggest that targets in acquisition by overvalued acquirers realize higher premiums.
Nonetheless, examining whether cross-holdings affect the method of acquisition payment has been neglected in past empirical studies. We expect that IPO fmns tend to use stocks to pay for future acquisitions if high leve! of IPO institutional shareholders own shares in the target firms as they could offset their potentiallosses on acquirer shares with gains in target ones.
Therefore, we propose the following hypothesis:
H4: The probability of stock-financed acquisitions is positively associated with the leve! of institutional cross-holdings.
Cross-holding exists when a bidder shareholder also holds shares in the target finn. Our main measure for cross-ownership is the nurnber of institutional bidder shareholders that own shares in the target (NUMCRH). We also use COM_HOLD, a variable that measures the percentage of the bidder and target frrm's 'shares that are cross held. We likewise use the total institutional ownership in the bidder's equity (BIEQOW) and the total institutional ownership in the target's equity (TAREQOW) to evaluate the impact of these holdings on the choice of payment method in post-IPO mergers. Furthe1more, given the fact that large shareholders are more likely to have the ability to influence the corporate decisions of the bidding managers,
we consider that large cross-owners could have an effect on the paytnent method in acquisitions. We defme a large cross-owner as an institutional shareholder who owns more than 5% in the frrm. To test this effect, we consider two variables: (1) LARBCR, a dummy variable taking the value of one if there is a large cross-owner in the bidder's equity, and zero otherwise; (2) LARTCR, a dunm1y vmiable taking the value of one if there is a large cross -owner in the target's equity, and zero otherwise.
1.2.5 Control variables
Besides the primary variables described above, we also include a nurnber of controls that could be related to the likelihood of post-IPO acquisition and the choice between cash or stock as payment method. We use total gross proceeds (Proceeds) defined as the raised capital at the time of the offering. The total gross proceeds is also a proxy for IPO finn size. W e also control for the use of a prestigious underwriter, using the rankings of Loughran and
Ritter (2004t We defme the variable Prestige, a dummy variable that takes the value of one if the IPO's underwriter is in the top tier (ranks 8 and 9), and zero otherwise. We also include
a dummy variable Private that takes th.e value of one if the target is a private fm11, and zero
otherwise. We also use Relatedness, a dun1111y variable that takes the value of 1 if the target finn is in the same 3 digit SIC code as the acquirer, and zero otherwise.
To control for the effect of periods of high M&A activity, we use Ha1ford's (2005) industry merge wave indicator. A merger wave is identified when the number of acquisitions over 24 months exceeds the 95th percentile of the simulated probability distribution based on ten years ofM&A activity. We defme Merger wave, a dun1111y variable taken the value of 1 if an M&A wave occurs in any of the five post-IPO years we consider.
To control for subsequent raised capital in the fi.ve years following the IPO, we defme
SEO, a durnmy variable that takes the value of 1 if the IPO finn conducts an SEO during the
five years following the IPO, and zero otherwise. We also use Bubble, a dunm1y variable that takes the value of 1 for IPOs during 1999 and 2000, and zero otherwise to control for the
bubble period. Table 1.1 surnmarizes the definitions of all the variables considered and their
expected sign.
4
We thank Professor Jay. R. Ritter for making IPO underwriter reputation rankings data available on his web site.
Variable name Primarv variables CRINS NUMCRH COM HOLD BIEQOW TAREQOW LARBCR LARTCR VC backed Underpricing NUMA STDFOR Control variables Proceeds Prestige Priva te Merger wave Bubble SEO Relatedness
Table 1.1 Variables, descriptions and their expected signs
Description
Insider ownership changes defined as the absolute value of the difference between post-IPO and pre-IPO inside ownership The number of cro s-boldings
The percentage ofbidder and target sbares that are cross beld. The total of institutional ownership in the bidder's equity The total institutional ownership in the target's equity
Dummy variable: 1 if there is a large cross-owner in the bidder's equity and zero otherwise.
Dummy variable: 1 if there is a large cross-owner in the target's equity and zero otherwise.
Dununy variable: 1 if the IPO is backed by a ventme capital
finn and zero otherwise.
The difference between the fi.rst day closing priee and the offer priee given as a percentage of the offer priee.
The number of analysts following the acquirer The standard deviation of analyst forecasts
The natmal logarithm of total proceeds
Dummy variable: 1 if the underwriter is top ti er and 0 otherwise Dummy variable: 1 if the target is private and zero otherwise. Dummy variable: dummy variable taken the value of 1 if an M&A wave occurs in any of the five post-IPO years we consider, and zero otherwise.
Dummy variable: 1 for bubble IPO market, and zero otherwise Dummy variable: 1 if the IPO firm conducts an SEO during the five years following the IPO, and zero otherwise.
Dununy variable: 1 if the target finn is in the same 3 digit SIC code as the acquirer, and zero otherwise.
1.3 Data and sample selection
Expected SIOn (+) (+) (+) (+) (+) (+) (+) (+) (+) (+) (-) (-) (+) (+) (+) (+) (-) (+)
To construct our initial sample of IPOs and mergers, we use Thomson Financial's SDC New Issues and Mergers & Acquisitions databases. Using a sample period from 1980 through 2006, our IPO dataset consists of 7,206 U.S. IPOs, excluding ADRs, unit offers, and IPOs with offer priees under $5. We also exclude financial firms (one-digit SIC 6) and utilities (two-digit SIC 49) from the IPO sample. Our merger sample consists of U.S. completed
mergers that were announced between 1980 and 2010. We require that the merger transaction value exceed $1 million. Additionally, we restrict our focus only to acquisitions of ptivate, public and subsidiary targets. The resulting set contains 31,726 acquisitions. Since our objective is to examine the decision togo public and its role in facilitating subsequent merger activity, we collect the data on M&As that take place within a five-year period following the frrm's IPO, including the IPO year. Thus, merger data are available through the end of 2010 and we end the IPO sample in 2006 to allow us to track the five-year merger activity for all IPO frrms in our sample. Both IPO and merger sets are combined, resulting in 7,107 mergers made by 3,048 IPOs. We also require that IPO frrms have available data in COMPUSTAT. This results in a final sample of 2,547 IPO firms involved in 5,853 mergers. The remaining IPO fim1s did not conduct any acquisitions during the five years following the IPO date (4,158 IPOs). Data on asymmetric information measures comes from IBES while the infom1ation on institutional ownership comes fi·om the Thomson Reuters Institutional Holdings (13f) database. The sample size varies for different tests and hypotheses due to the availability of necessary data items.
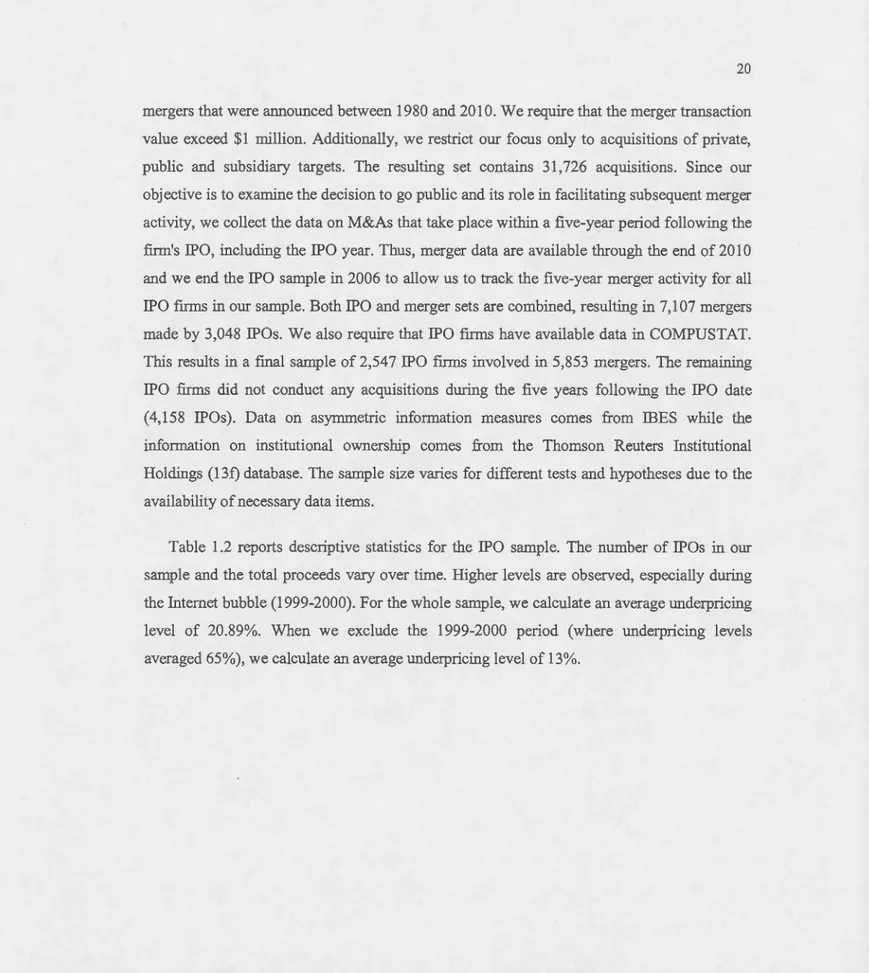
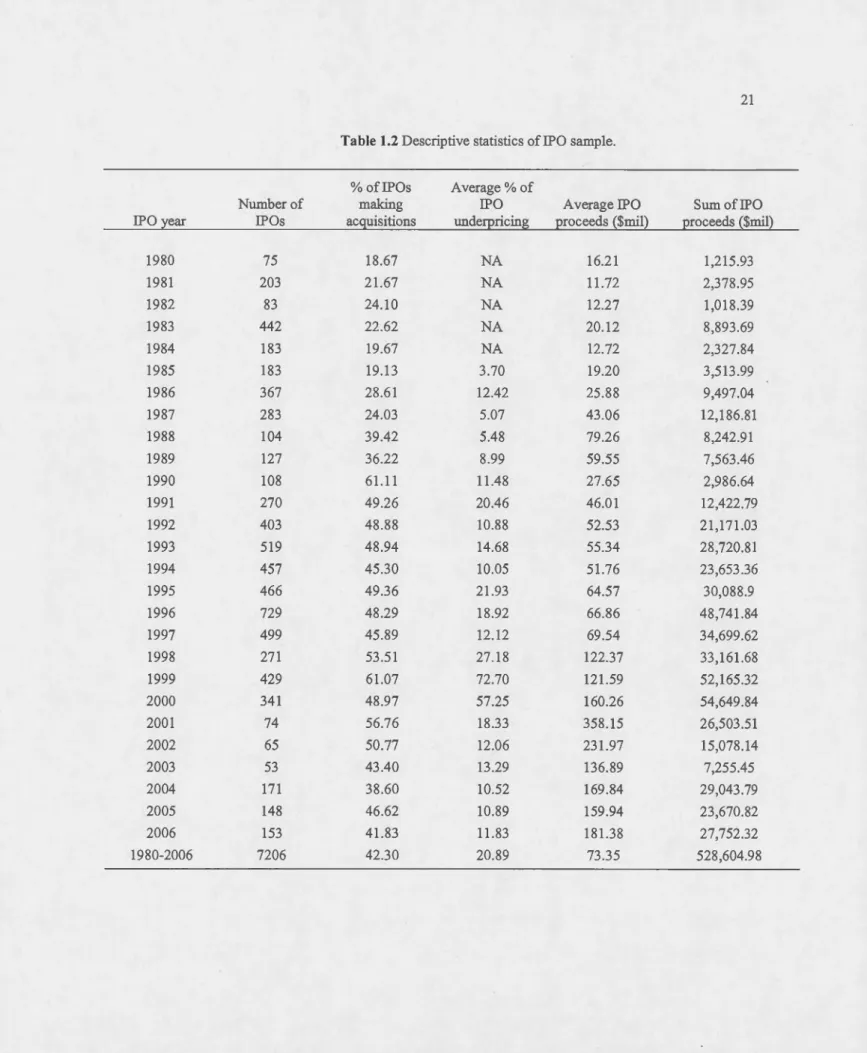
Table 1.2 reports descriptive statistics for the IPO san1ple. The number of IPOs in our sample and the total proceeds vary over time. Higher levels are observed, especially during the Intemet bubble (1999-2000). For the whole sample, we calculate an average underpricing level of 20.89%. When we exclude the 1999-2000 period (where underpricing levels averaged 65%), we calculate an average underpricing level of 13%.
Table 1.2 Descriptive statistics ofiPO sample.
% ofiPOs Average% of
Number of making IPO Average IPO Sum ofiPO
IPO year IPOs acquisitions underpricing proceeds ($mil) proceeds ($mil)
1980 75 18.67 NA 16.21 1,215.93 1981 203 21.67 NA 11.72 2,378.95 1982 83 24.10 NA 12.27 1,018.39 1983 442 22.62 NA 20.12 8,893.69 1984 183 19.67 NA 12.72 2,327.84 1985 183 19.13 3.70 19.20 3,513.99 1986 367 28.61 12.42 25.88 9,497.04 1987 283 24.03 5.07 43.06 12,186.81 1988 104 39.42 5.48 79.26 8,242.91 1989 127 36.22 8.99 59.55 7,563.46 1990 108 61.11 11.48 27.65 2,986.64 1991 270 49.26 20.46 46.01 12,422.79 1992 403 48.88 10.88 52.53 21,171.03 1993 519 48.94 14.68 55.34 28,720.81 1994 457 45.30 10.05 51.76 23,653.36 1995 466 49.36 21.93 64.57 30,088.9 1996 729 48.29 18.92 66.86 48,741.84 1997 499 45.89 12.12 69.54 34,699.62 1998 271 53.51 27.18 122.37 33,161.68 1999 429 61.07 72.70 121.59 52,165.32 2000 341 48.97 57.25 160.26 54,649.84 2001 74 56.76 18.33 358.15 26,503.51 2002 65 50.77 12.06 231.97 15,078.14 2003 53 43.40 13.29 136.89 7,255.45 2004 171 38.60 10.52 169.84 29,043.79 2005 148 46.62 10.89 159.94 23,670.82 2006 153 41.83 11.83 181.38 27,752.32 1980-2006 7206 42.30 20.89 73.35 528,604.98
Table 1.3 presents descriptive statistics for the M&A sample. A large number of acquisitions occuned between 1994 and 2000 with an average of 1 ,907 acquisitions. The total acquisition amount reached its h.ighest level in 1999 and 2000, which co.incides with the
highest IPO proceeds. As Rau and Stouraitis (2011) and Hovak.imian and Hutton (2010) point
out, this result suggests that IPO waves are followed by an .increase in the aggregate merger activit/. Figures 1.1 and 1.2 confinn our observation.
5
Schultz and Zaman (2001) confin:n that internet IPOs in the late 1990s were followed by series of acquisitions.
Table1.3 Descriptive tatistics ofM&A sample. Numberof
acquisitions by % of acquisitions A vera ge deal Sum of deal transaction
Acquisition year public frrms by public fin11S transaction ($mil) ($mil)
1980 40 0.13 222.51 8,900.57 1981 269 0.85 163.60 44,007.80 1982 339 1.07 74.09 25,116.31 1983 644 2.03 59.13 38,080.01 1984 966 3.04 117.59 113,589.98 1985 405 1.28 296.64 120,139.50 1986 530 1.67 185.42 98,274.54 1987 553 1.74 169.58 93,775.07 1988 569 1.79 186.72 10,6243.35 1989 704 2.22 172.35 12,1335.94 1990 701 2.21 85.17 59,701.86 1991 662 2.09 67.17 44,467.68 1992 873 2.75 62.85 54,866.60 1993 1156 3.64 102.91 118,964.97 1994 1419 4.47 110.96 157,448.51 1995 1536 4.84 131.90 202,604.48 1996 1928 6.08 173.61 334,711.99 1997 2316 7.30 168.61 390,498.76 1998 2232 7.04 323.30 721,614.07 1999 2003 6.31 422.69 846,642.23 2000 1914 6.03 487.12 932,352.21 2001 1147 3.62 336.11 385,519.13 2002 1067 3.36. 211.46 225,625.10 2003 978 3.08 192.29 188,056.95 2004 1138 3.59 265.70 302,637.60 2005 1185 3.74 400.28 474,334.09 2006 1177 3.71 420.97 495,479.96 2007 1176 3.71 305.68 359,480.51 2008 831 2.62 231.45 192,334.25 2009 628 1.98 570.64 358,363.62 2010 640 2.02 350.29 224,184.23 1980-2010 31726 100 228.03 783,9351.85
0,14 0,12 0,1 0,08 0,06 0,04 0,02 0
- IPos - Aggregate acquisitions
N 0 0 0 0 N N _..,._Acquisitions by IPOs C'"l '<!" 0 0 0 0 N N V) \0 0 0 0 0 N N
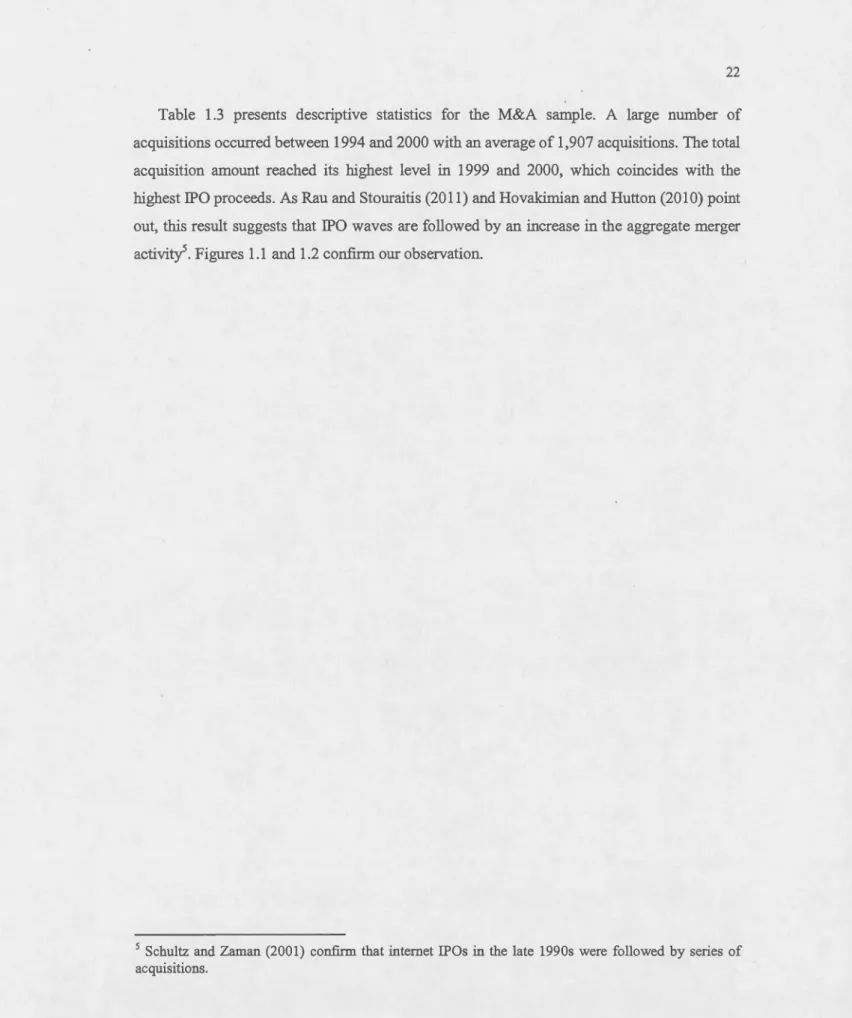
Figurel.l Aggregate IPO activity, aggregate acquisition activity and acquisition activity by IPOs
Note: This figure presents aggregate IPO, aggregate acquisition activity and acquisition activity by IPO fi1ms. Annual aggregate !PO activity is scaled by the total number of IPOs during the sample period. ArulUal aggregate acqui ition activity i scaled by the total number of acquisitions during the sample period. Annual acquisition values by TPO finn are scaled by the total number of acquisitions conducted by lPOs.
0,101 0,081 0,061 0,041 0,021 0,001 0 N C') '<!" V) \0 r- 00 0\ 0 N C') '<!" V) \0 r- 00 0\ 0 N C'"l '<!" V) \0 r- 00 0\ 0 00 00 00 00 00 00 00 00 00 00 0\ 0\ 0\ 0\ 0\ 0\ 0\ 0\ 0\ 0\ 0 0 0 0 0 0 0 0 0 0 0\ 0\ 0\ 0\ 0\ 0\ 0\ 0\ 0\ 0\ 0\ 0\ 0\ 0\ 0\ 0\ 0\ 0\ 0\ 0\ 0 0 0 0 0 0 0 0 0 0 0 N N N N N N N N N N N _..,._Acquisition deal values - IPO proceeds
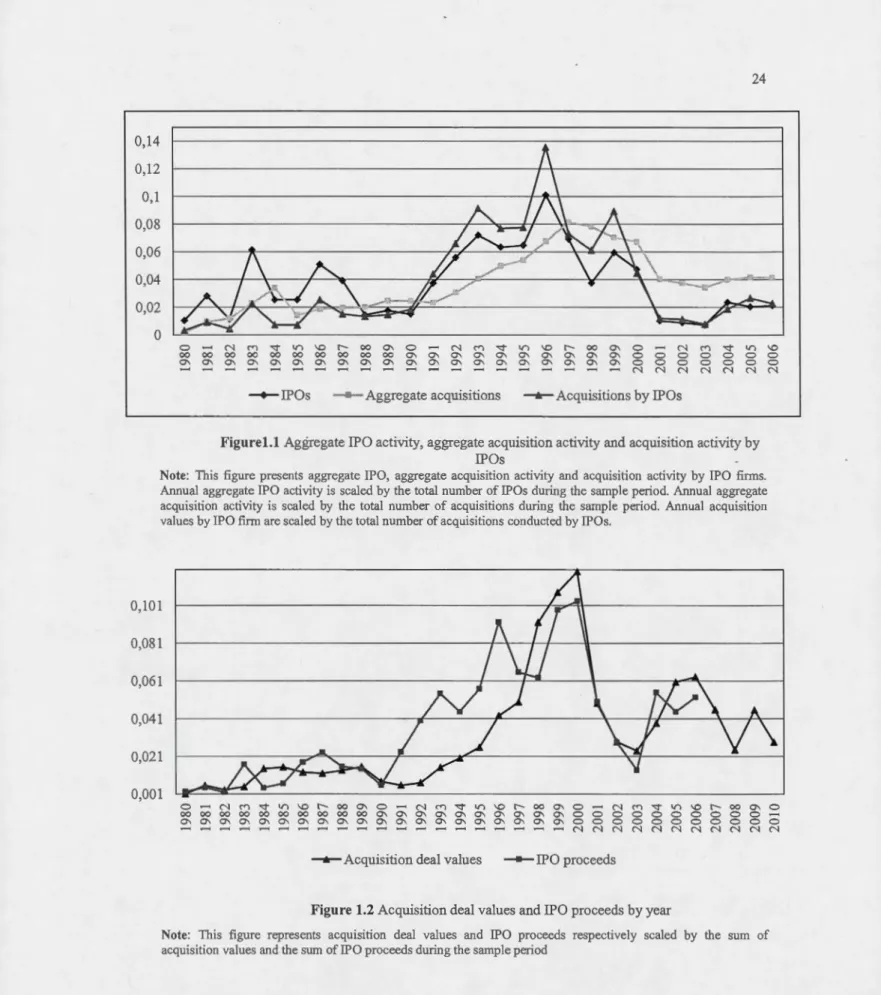
Figure 1.2 Acquisition deal values and IPO proceeds by year
ote: This figure represents acqui ition deal values and IPO proceeds respectively scaled by the sum of acquisition values and the sum ofiPO proceeds du ring the sample period
Table 1.4 summarizes the acquisition activity undertaken by IPO fim1s for windows extending up to five years after the IPO date. Y ear 0 denotes the year of the IPO. W e observe
that 21% ofiPO fi1ms make at least one acquisition in their IPO year and 47% ofiPO firms
make at !east one acquisition in year 1. These observations confm those of Celikyurt et al.
(2010) and Brau et al. (2012), namely that a significant number of fmns become acquirers shortly after the IPO. Moreover, we find that many fmns make more than one acquisition within five years following their IP06. The average number of acquisitions by an IPO fm is 2.33, while the mediannun1ber of acquisitions in the first five years after going public is 2. In
Table 1.4, we also present frequent acquisitions year by year. We define a frequent acquirer
as an IPO firm that conducts at !east two acquisitions in a given year. We frnd that 30.22% of
IPO firms conduct more than two acquisitions in the year after the IPO. This percentage varies between24.18% and 27.77% in the following years, suggesting that IPO finns tend to
be frequent acquirers in the sh01t period in1111ediately following their IPOs.
Table 1.4 Acquisition activity ofiPO finns over time
Year 0 Year 1 Year2 Year 3 Year4 Number ofiPOs making at lea t one acquisition 525 1201 918 736 660 Percentage of IPO frrms making at !east one acquisition 20.61 47.15 36.04 28.89 25.91
Number ofiPOs making frequent acquisitions 130 363 255 178 165
Percentage ofiPOs making frequent acquisitions 24.76 30.22 27.77 24.18 25 Total number of acquisitions by IPO finns 708 1827 1356 1022 940
Percentage of acquisitions 12.09 31.21 23.16 17.46 16.06
Figure1.3 shows aggregate acquisitions, aggregate IPOs, and IPOs making acquisitions
by industry. We observe that IPO fums make more acquisitions in manufacturing and service
industry groups than in other industry groups.
6 White our main focus in this paper is on M&A as a motivation to go public, we should mention that
some IPO fums do not become acquirers over their fust five years for severa! reasons (e.g. financial distress or bankruptcy, going private, become acquisition target, etc.). We leave these issues for future research.
Services Wholesale and retail trade
Sanitary services Communication Transportation Manufacturing Construction Natural resource Agriculture 0 0,05 0,1 0,15
• Acquisitions by IPOs • IPOs
0,2 0,25 0,3 0,35 0,4 0,45
Aggregate acquisitions
Figure 1.3 Number of acquisitions, number of IPOs and number of IPOs making acquisitions by industry
Note: This figure illustrates the total number of acquisitions by IPOs, the total number of fPOs and the aggregate acquisition activity ela sified by industry. Acquisitions by IPOs in each industry are caled by the total number of acquisitions made by IPOs in ali studied industries. Total number ofiPOs by industry is scaled by the sum ofiPOs in ali industries. Aggregate acquisitions by industiy are scaled by ail acquisitions in ali studied induso·ies. ·
1.4 Results
1.4.1 Univariate results
Panel A of Table 1.5 presents the summa.ry statistics for IPO firms making acquisitions
and those that do not du.ring the five years following their IPO. We find that IPOs making
acquisitions in the five years following their IPO are significantly more underpriced than
.those that do not. The mean underpricing of IPO firms making acquisitions is 27%, whereas it is 20% for those that do not. Our results show that venture backed IPOs are significantly more likely to engage in acquisitions than non-venture backed IPOs. We also find that change
in insider ownership is significantly higher for IPOs making acquisitions as compared to
Panel Bof Table 1.5 presents summary statistics for cash and stock acquisitions. We fmd that underpricing is significantly higher for IPOs making stock acquisitions than those making cash acquisitions. The mean underpricing of IPO acquirers in stock acquisitions is 40% as compared to 24% for IPO acquirers in cash acquisitions. The mean proceeds at the IPO date is significantly higher for IPOs that conducted cash acquisitions tl1an for those that conducted stock acquisitions, thereby supporting the capital infusion hypothesis of Celikyurt et al. (2010). IPO firms seem to use theil· stocks to pay for acquisitions in periods of high M&A activity and dwing the hubble period. We fmd significant differences in means and
medians for the variables Bubble and Merger wave. Comparing the means and medians of the proxies for information asynm1etry, we fmd that NUMA is significantly higher for stock acquisitions than for cash acquisitions. The mean number of analysts following the acquirer is 5.29 for stock acquisitions, whereas it is 4.60 for cash acquisitions. Our results also indicate
larger standard deviation of analyst forecasts followli1g the acquirer li1 cash-fmanced acquisition although this result is not statistically significant.
Table 1.5 Summary statistics and urùvariate tests Panel A: Summary statistics and univariate tests for lPOs that did not make acquisitions and lPOs that did
Total fPOs that did not make acguisitions IPOs that make acguisitions Difference Difference
N Mean Median STD N Mean Median STD in means in medians
Underpricing 1754 908 0.20 0.09 0.45 846 0.27 0.14 0.48 -0.07 -0.05 (-3.23)*** (-4.82)*** Proceeds 1754 908 3.44 3.48 0.96 846 3.65 3.63 0.87 -0.21 -0.15 (-4.83)*** (-5.04)*** Prestige 1754 908 0.55 0.49 846 0.63 0.48 -0.07 0.00 (-3.11)*** (-3.1 0)*** VC backed 1754 908 0.45 0 0.49 846 0.50 0.50 -0.05 -1.00 (-2.13)*** (-3.1 0)*** CHINS 1754 908 0.18 0.16 0.12 846 0.24 0.18 0.35 -0.05 -0.02 (-4.33)*** (-4.49)*** SEO 1754 908 0.31 0 0.46 846 0.46 0 0.50 -0.14*** 0*** (-6.24) (-6.17) Bubble 1754 908 013 0 0.34 846 0.17 0 0.37 -0.04*** 0*** (-2.29) (-2.29) Merger wave 1754 908 0.17 0 0.38 846 0.20 0 0.40 -0.03** o.oou (-1.99) (-1.99)
PaneiB: Summaty statistics and univariate tests for cash fmanced and stock financed acqui itions. Total Cash-financed acguisitions Stock-financed acguisitions
Difference Difference N Mean Median STD N Mean Median STD in means in medians Underpricing 2010 1211 0.24 0.11 0.54 799 0.40 0.18 0.64 -0.16 -0.09 ( -5.85)*** ( -6.97)*** Proceeds 2010 1211 3.92 3.93 0.97 799 3.72 3.63 0.87 0.19 0.30 ( 4.67)*** (5.16)*** Prestige 2010 1211 0.68 0.46 799 0.77 0.42 -0.08 0.00 ( -4.11)*** (-4.10)*** VC backed 2010 1211 0.45 0 0.50 799 0.59 0.49 -0.14*** -1.00*** (-6.54) (-6.48) Priva te 2010 1211 0.57 0.48 799 0.72 0.45 -0.14 0.00 ( -6.82)*** ( -6. 74)*** Bubble 2010 1211 0.10 0 0.30 799 0.18 0 0.38 -0.07 0.00 (-5.10)*** (-5.07)*** Merger wave 2010 1211 0.17 0 0.37 799 0.32 0 0.47 -0.15 0.00 (-7.91)*** (-7.99)*** SEO 2010 1211 0.19 0 0.39 799 0.16 0 0.36 0.03 0.00 (1.86)* (1.86)* Relatedness 2010 1211 0.62 0.48 799 0.61 0.49 0.01 0.00 ( 0.03) ( 0.03) NUMA 1823 1114 4.60 3.62 709 5.29 4 4.36 -0.68 -1.00 ( -3.62)*** ( -4.03)*** STDFOR 1119 753 0.04 0.02 0.03 441 0.03 0.02 0.02 0.01 0.00 ( 0.31) ( 0.04) NUMCRH 164 48 2.00 2.07 0.98 116 2.50 2.48 1.02 -0.50 -0.41 (-2.88)*** (-2.66)***
Note: This table resumes summary statistics and univaliate tests. Panel A reports the results for IPOs not making any acqui ition within the five years following the TPO and lPO making at !east one acquisition within the same time period respectively. Panel B reports results for cash-financed and stock-financed acquisitions respectively. Underpricing is the priee run-up in the first trading day after the TPO; it is defined as the difference between the first day closing pliee and the offer pliee given as a percentage of the offer priee. Proceeds is the naturallog of the total capital raised at the ti me of the !PO. Prestige is a dummy variable th at takes the value of 1 if the underwriter
is in the top ti er and 0 otherwise. VC backed is a du mm y taking the value of one if the TPO i backed by a venture capital finn and zero otherwi e. Loc/eup is the naturallogarithm of the number of days between the IPO date and expiration date. CHJNS i the absolute value of the difference between post-IPO and pre-TPO inside owner hip.
SEO is a du mm y variable th at takes the value of 1 if the JPO fm11 conducts an SEO du ring the five years following the TPO, and zero otherwise. Bubble is a dummy va1iable that takes the value of 1 for lPO du ring 1999 and 2000, and zero otherwise. Metger wave is a dummy variable ta ken the value of 1 if an M&A wave occurs in any of the five post-IPO years we consider, and zero otherwise. Priva te is a dummy that takes the value of 1 if the target is a privately held firm and zero otherwise. Re/atedness is a dummy that takes the value of 1 if the acquirer and the target are in the sa me industry and 0 otherwise. NUMA i the number of analysts following the acquirer. SDTFOR
is the standard deviation of analysts' earnings forecasts about the acquirer. NUMCRH is the natural logarithm of the number of cross-holdings. The results of t-tests for the difference in means and non-parametric Wilcoxon ra nk-sum tests for the difference in medians are reported in parentheses. ***,**and* indicate significance at the 1%, 5% and l 0% levels respective1y
1.4.2 Determinants of post-IPO acquisition activüy
We rw1 the following logit regression7 to test the effect of IPO characteristics on the
likelihood of an acquisition:
Yi
=/3
0+
/3
1 Underpricingi + f32Proceedsi + f33Prestigei + f34VC backedi +/35
SEOi+
f36CHINSi+
f37Bubblei+f38Merger wavei + Ei (1)The dependent variable in regression (1) takes the value of 1 if an IPO fmn makes at
!east one acquisition during the five years following its IPO, émd zero otherwise. Table 1.6 shows the results. We fmd that the degree of underp1icing is a positive and significant detenninant of making acquisition within the frrst five years following IPO, suggesting that IPO fmns with a higher degree of underpricing are more 1ikely to involve in M&A transactions. We also find that firms with higher proceeds are more likely to engage in acquisitions following the IPO. Thus, the capital raised from the initial offering help newly public fmns to grow through acquisitions. The subsequent capital raised via seasoned equity offerings also seems to influence the ability of an IPO fmn to conduct acquisitions shortly after their going public decision. The coefficient of SEO is positive and significant at the 1%
7
We also considera Tobit estimation to take into account the number of M&A after going public and our results remain qualitatively unchanged.·