HAL Id: tel-03168289
https://tel.archives-ouvertes.fr/tel-03168289
Submitted on 12 Mar 2021
HAL is a multi-disciplinary open access
archive for the deposit and dissemination of
sci-entific research documents, whether they are
pub-lished or not. The documents may come from
teaching and research institutions in France or
abroad, or from public or private research centers.
L’archive ouverte pluridisciplinaire HAL, est
destinée au dépôt et à la diffusion de documents
scientifiques de niveau recherche, publiés ou non,
émanant des établissements d’enseignement et de
recherche français ou étrangers, des laboratoires
publics ou privés.
Essays on Households’ Long-term Trajectories in
Welfare and Human Capital
Irene Clavijo Muñoz
To cite this version:
Irene Clavijo Muñoz. Essays on Households’ Long-term Trajectories in Welfare and Human Capital.
Economics and Finance. École des hautes études en sciences sociales (EHESS), 2019. English. �NNT :
2019EHES0189�. �tel-03168289�
1
École des Hautes Études en Sciences Sociales
Paris School of Economics
THESIS FOR THE DEGREE OF DOCTOR OF PHILOSOPHY IN ANALYSIS AND POLICY IN ECONOMICS
I
RENE
C
LAVIJO
E
S S A Y S O N
H
O U S E H O L D S
’
L
O N G
-
T E R M
T
R A J E C T O R I E S I N
W
E L F A R E A N D
H
U M A N
C
A P I T A L
Thesis Advisor: Karen Macours, Professor at the Paris School of Economics
Date of the Defense: November 21st, 2019
THESIS COMMITTE
External Reviewers
Elise HUILLERY,
Professor at Université Paris-Dauphine
Renos VAKIS,
Lead Economist at the World Bank
Discussants
Denis COGNEAU,
Professor at the Paris School of Economics
2
A mis padres, reconociendo la
importancia de la transmisión
intergeneracional de su
3
A
C K N O W L E D G E M E N T S
When I first arrived at PSE to obtain the master’s degree (a medium distance race) I wasn’t certain I would
pursue the PhD (run the full marathon). The invigorating research environment I found in the field of
development economics at PSE, in particular under Karen’s supervision of my master’s thesis, had a lot to do
with the subsequent decision of staying to proceed onto the PhD. Little did I know it would prove to be such a
challenging feat at all levels. When it comes to the set of constraints faced during any endurance race of this sort,
the only constant is change. Now that the 42- kilometer banner is finally in sight; it is clear that I am not
crossing the finish line on my own. Plainly put, ‘No one can whistle a symphony. It takes a whole orchestra to
play it’
1.
To Karen my utmost gratitude for her guidance and patience over the course of this eventful journey. The road
has indeed been long and winding. But beyond being grateful for her help in bringing my thesis to fruition, I
deeply appreciate the unique and enriching opportunities granted to me through her; from teaching at Los Andes,
to attending a high-level summer school in Tuscany, and conducting fieldwork and enumerator training in
Africa.
I am also sincerely thankful to all the members of the jury for their valuable input. Their advice and
contributions had been valuable not only due to their technical quality, but especially given their constructive
nature. A referee’s impact on a researcher’s work should never be underestimated (it can ‘make or break’ a
scholar). In my case, the jury’s positive and formative undertone was essential for me in maintaining the
motivation needed for the final, toughest kilometers. Moreover, their comments were instrumental in improving
upon earlier versions of each chapter and the pending revisions suggested will likely enhance the papers research
quality further.
I dedicate this milestone to my parents. In this dissertation I studied the importance of parental aspirations and
investments in their children. It’s no wonder I have come to acknowledge and appreciate so deeply my own
parents’ dedication and effort. None of the pages here would have been possible without their support at every
level; emotional, psychological and material. Support which I have received not just during the doctoral years
but throughout my childhood and to date.
Throughout my research, as I delved deeper into the study of the intergenerational transmission, underlying the
formation of human capital, my gratitude towards my parents continued to grow. Speaking of long-term
4
trajectories (as I do in my thesis) I must note that this transmission mechanism runs further back to my
grand-parents’ generation. In a somewhat atypical distribution of opportunities, given the gender norms of their day
and age, my two grand-mothers (as oppose to my grand-fathers) were the ones who went on to pursue university
degrees while raising their families. My grandfathers on their part, both self-made men, compensated for their
lack of academic degrees with a profound work ethic and humble yet relentless effort. Each, in their own way,
have shaped my identity both directly and indirectly through my parents. To them I also extend this
acknowledgement.
Finally, to Diego, my partner in all adventures, you have made this journey endurable and, more importantly,
you have made it most exciting. We have such a wealth of stories to share with our children (maybe even our
children’s children). What a ride! From DC to Paris, to Kenia, all the way to Turkey and back… where to
next? Gracias. Te amo.
5
A
B S T R A C T A N D
K
E Y W O R D S
This dissertation comprises the research I conducted over the course of my doctoral studies at the Paris School of Economics. The underlying common theme between the chapters is the microeconomic study of poor rural households over the course of time. I focus on changes in these households’ welfare level (intragenerational mobility) and the development of their human capital (intergenerational transmission). The first essay examines whether the timing of a cash transfer program could have an impact on the household’s long-term welfare trajectory. The results suggest that a short time differential in exposure to the program had an impact on the household’s likelihood of remaining stuck in poverty in the long-run. The second essay investigates the intergenerational relationship between parental non-cognitive skills and subsequent child outcomes. In this paper I examine how informative and malleable these measures are within a poor rural setting, where respondent educational attainment is low and measurement may be rife with error. The results indicate there is an association that between the parent’s non-cognitive skills and the child’s outcomes that is still detectable after several years. The third essay investigates the risk factors (near birth) associated to children’s developmental trajectories into youth, with a focus on maternal mental health. The results show the development gaps, between poor and stable mental health mothers, widen with time. This finding points to the importance of maternal mental health as a risk factor in the early stages of a child’s development. Overall, the ensemble of studies highlight the research insight which may be gained from following households’ or individuals’ trajectories over the longer term with a focus on specific periods identified as critical for development.
6
R
E S U M E E T M O T S C L E S
Mes travaux de recherche menés durant mon doctorat au sein de l’Ecole d’Economie de Paris et de l’Ecole des Hautes Etudes en Sciences Sociales ont pour thème commun l’étude de l’évolution au cours du temps des ménages ruraux pauvres. J’analyse l'évolution d’une part, du niveau de bien-être de ces ménages au sein d’une génération (mobilité intragénérationnelle) et d’autre part, de leur capital humain d’une génération à l’autre (transmission intergénérationnelle). Le premier chapitre examine si la durée d’exposition à un programme d’aides financières (cash transfer program) a une incidence sur la trajectoire de bien-être à long terme du ménage. Les résultats suggèrent qu’une faible différence d'exposition à un tel programme augmente la probabilité que le ménage reste pauvre à long terme pour ceux moins longtemps exposés. Le deuxième chapitre étudie la transmission intergénérationnelle, notamment comment les compétences non-cognitives des parents influencent les caractéristiques anthropométriques et capacités cognitives de leurs enfants. Je montre que les effets sont significatifs et perdurent dans le temps. Le troisième chapitre étudie les facteurs de risques, notamment la santé mentale des mères qui peuvent survenir proche de la naissance et leurs effets sur les trajectoires des enfants. Les résultats montrent que les écarts de développement entre les enfants dont les mères sont stables ou instables mentalement se creusent avec le temps, ce qui suggère l'importance de la santé mentale maternelle comme facteur de risque dans les premiers stades du développement de l'enfant. Dans l'ensemble, cette thèse apporte différents éclairages sur ce que nous apprend l’analyse longitudinale.
7
F
O R E W O R D
When I embarked in my doctoral research, I considered it a timely opportunity to conduct long-term studies given the increasing availability of high-quality longitudinal data. Data of this sort was not readily available back when I was pursuing my undergraduate degree as an economist close to two decades ago; in particular for
developing countries2. Therefore, in all three chapters I use panel data to follow households over various rounds,
tracing their trajectories along different dimensions of welfare.
The underlying common theme between the chapters is thus the microeconomic study of poor rural households over multiple time periods. In particular, I focus on changes in these households’ welfare level in the first chapter (intragenerational mobility) and the development of their human capital in the other two chapters (intergenerational transmission).
In the first paper I was interested in examining the long-run impacts which a conditional cash transfer program could have on the household’s socioeconomic mobility. The primary interest in the study of the sustained impacts of a CCT program (or lack thereof) emerged as a continuation from the research I conducted on the pioneering Mexican program (Progresa) during my master’s at PSE (Clavijo, 2011). To date, a large literature has documented the short and medium-term impacts of the Mexican experience and its successors (cf. Fiszbein and Schady, 2009; and more recently Baird, et al, 2014). Meanwhile, the jury is still out with regards to the long-term impacts. The evidence which has emerged so far is mixed and still limited (Molina-Millán, et al. 2019a). The question about the impacts from cash transfers in general, which are sustained in the long-term, therefore remains high on the research agenda. In fact, development researchers focused on the study of poverty have been called upon to double-down on long term studies to understand whether impacts from cash transfers are sustained over
time (Blattman et al, 2019)3.
Moreover, in the first paper I set out to combine this research theme on long-term effects of transfers with a
personal interest in distributional analysis; in particular mobility dynamics4. Admittedly, the hybrid study proved
to be a challenge in its application of traditional impact evaluation techniques to the study of welfare dynamics.
2 The Living Standards Measurement Study (LSMS) may be considered the pioneering initiative in this field
(Ravallion, 1998). Led by Professor Martin Ravallion the LSMS was established by the World Bank in 1980 to explore ways of improving the type and quality of household data collected by statistical offices in developing countries. Anecdotally, I first came to know of the LSMS after finishing my undergraduate studies and working at the Poverty and Gender Unit at the World Bank (with Renos Vakis as my supervisor, and mentor from whom I learned a great deal about poverty measurement). Some years later, I had the privilege of attending class with Professor Ravaillion at PSE and was further interested in distributional and longitudinal analysis.
3 Blattman and co-authors (Faye, Karlan, Niehaus and Udry) emphasize that further evaluation of subgroup
analysis is needed to understand how impacts differ depending on beneficiary characteristics. They note that these characteristics should expand beyond the usual heterogeneity variables such as gender, age and wealth, towards less studied context dimensions such as mental health or conflict.
4 An interest which was fueled in large part by the lecture on Distribution and Inequality (offered by Professor
8
In this respect, the guidance provided by the members of the jury, and specially by my adviser, was instrumental in improving upon earlier versions of the chapter.
Given the evaluation design of the Mexican transfer scheme, I exploited the random allocation to early treatment in order to evaluate the impact of differential exposure to the program on the welfare path followed by the household. In particular, I focused on the likelihood that a household presents a path of sustained poverty or downward mobility among other trajectories, as outcome variables to describe the welfare path. At the more conceptual level I was interested in understanding whether the impacts varied according to the households’ constraints. To do so, I examined how the impacts of the differential timing varied according to the heterogeneity between the households (in terms of physical and human capital and exposure to shocks.) The rationale for the heterogeneity analysis stemmed from the premise that the household’s binding constraints are not constant over time. Rather, the heterogeneity between households, in terms of their access to and accumulation of physical and human capital, as well as the unexpected shocks they may encounter, renders these constraints dynamic. As such, the specific moment at which a household enters the program may affect the extent to which the CCT has an impact on its welfare.
Overall, the results showed that the households that randomly received the transfers first displayed on average a higher likelihood of sustaining high welfare levels and a lower probability of remaining stuck in poverty. The heterogeneity analysis indicated that early receipt of the program impacted households to differing degrees according to their characteristics at baseline relating to physical capital (for land and homeowners and those close to markets) and human capital (for primary and secondary aged members). However, the heterogeneity between households in terms of their exposure to shocks does not seem to affect the impact of the timing of the CCT in the long-run. At the broader level, I concluded that understanding how the timing of transfers may affect the extent of their impact can be important for targeting purposes, taking into account households’ heterogenous and dynamic constraints.
The second paper of my dissertation investigated the intergenerational relationship between parental non-cognitive skills and subsequent child outcomes. Subjective measures of non-non-cognitive skills are now widely used and there is increasing evidence about their importance in skill formation. However, these measures have mainly been validated in developed countries. During my second year in the Ph D I had the privileged opportunity to do field work in Kenia by participating in a study aimed at testing the reliability and validity of some the most commonly used skills measures in a rural developing context (Laajaj and Macours, 2019). The research idea for this second chapter spawned in large part from this field experience.
The main objective of this paper was precisely to investigate how informative and malleable certain measures of non-cognitive skills are within a poor rural setting, where respondent educational attainment is low and measurement may be rife with error. To this end, I exploited a rich panel dataset that spans a decade in time across four developing countries to examine the predictive validity of a number of non-cognitive skills on final child outcomes. I focused on parental aspirations and psychosocial wellbeing (as determinants) and parental investments and observed child human capital quality (as dependent variables).
9
The results indicated there was still a systematic positive association between the non-cognitive skills and the subsequent child outcomes, detectable even up to 8 years after. At the broader level, understanding the role of parental psychosocial wellbeing in the decisions about their children’s future human capital could prove to be useful input to inform policy interventions that directly aim to shape these so-called ‘soft skills’.
Finally, the third chapter of my dissertation also dealt with measures of subjective wellbeing with a focus on maternal mental health. More specifically, I investigated the risk factors associated to children’s developmental trajectories into youth, featuring caregiver depression as a risk factors on which there is less evidence to date. The results shed light on the development gaps between poor and stable mental health mothers, indicating these gaps widen with time. This result points to the importance of maternal mental health as a risk factor in the early stages of a child’s development.
Taking a step back, the ensemble of my research highlights the valuable insight which may be gained from following households’ or individuals’ trajectories over the longer term. In other word, there is much to be learned from watching the ‘full movie’ rather than just looking at the ‘snapshot’. The notion that constraints are dynamic and are shaped by changing household circumstances, and unexpected shocks, emphasizes the need for longitudinal analysis with a focus on specific periods identified as critical for development. Further studies examining the trajectories traced by households in poverty, whether within the same generation or into the next, will continue to enrich our understanding of their welfare and the development of their human capital.
References in the Foreword
Blattman, C. M. Faye, D. Karlan, P. Niehaus & C. Udry, 2017. “Cash as Capital”, Stanford Social Innovation Review Summer 2017
Clavijo, I. 2011. “Long-term Impacts of Conditional Cash Transfers on the Rural Youth: Evidence from Mexico’s Oportunidades program”, Mimeo, Master’s Dissertation, Paris School of Economics. September 2011. Fiszbein, A., and N. R. Schady. 2009. “Conditional Cash Transfers: Reducing Present and Future Poverty.” World
Bank Policy Research Report.Washington, DC: World Bank.
Molina Millan, T., T. Barham, K. Macours, J.A. Maluccio, and M. Stampini. 2019a. "Long-Term Impacts of Conditional Cash Transfers in Latin America: Review of the Evidence". The World Bank Research Observer, Volume 34, Issue 1, February 2019.
Laajaj, R and K. Macours, 2019. “Measuring Skills in Developing Countries”. Journal of Human Resources, forthcoming.
Ravallion, M. 1998. “Poverty Lines in Theory and Practice”, Working Paper No. 133, Living Standards Measurement Study, The World Bank.
10
T
A B L E O F
C
O N T E N T S
DEDICATION ... 2
ACKNOWLEDGEMENTS ... 3
ABSTRACT AND KEYWORDS ... 5
RÉSUMÉ ET MOTS CLÉS ... 6 FOREWORD ... 7 TABLE OF CONTENTS ... 10 LIST OF TABLES ... 12 LIST OF FIGURES ... 13 CHAPTER 1: LONG-TERM IMPACTS OF THE TIMING OF CONDITIONAL CASH TRANSFERS ON HOUSEHOLDS’ECONOMIC MOBILITY...14
1.INTRODUCTION ... 15
2.BACKGROUND OF THE PROGRAM ... 17
2.1. Program design ... 17
2.2. Evaluation design and data ... 18
3. CONCEPTUAL DEFINITIONS,FRAMEWORK AND HYPOTHESES ... 21
3.1. Intragenerational Socioeconomic Mobility ... 21
3.2. Conceptual Framework and Hypotheses ... 22
4. ESTIMATION STRATEGY ... 26 5. AGGREGATE RESULTS ... 28 6. HETEROGENEITY ANALYSIS ... 31 7. CONCLUDING REMARKS ... 34 REFERENCES ... 36 TABLES ... 39 APPENDIX SECTIONS ... 45 CHAPTER 2: ASPIRATIONS AND PSYCHOSOCIAL MEASURES:EVIDENCE ON THE MEASUREMENT AND MEANINGFULNESS OF NON-COGNITIVE SKILLS...50
1.INTRODUCTION ... 51
2.DATA,CONCEPTUAL DEFINITIONS, AND DESCRIPTIVE EVIDENCE ... 52
2.1. The Young Lives survey dataset ... 52
2.2. Conceptual definitions and measurement of variables ... 53
3. MEASUREMENT CONCERNS ABOUT NON-COGNITIVE SKILLS ... 62
3.1. Methodological procedures ... 63
3.2. Empirical results ... 64
4. PREDICTIVE VALIDITY:NON-COGNITIVE SKILLS AND PARENTAL INVESTMENT IN HUMAN CAPITAL ... 74
5. MALLEABILITY:RESPONSIVENESS OF NON-COGNITIVE SKILLS TO HOUSEHOLD SHOCKS ... 78
6. CONCLUSIONS ... 82
REFERENCES ... 83
TABLES ... 87
APPENDIX FIGURES ... 100
APPENDIX TABLES ... 101
APPENDIX SECTION A.1. ... 108
CHAPTER 3: MATERNAL MENTAL HEALTH AND CHILD HUMAN CAPITAL:LONG TERM RISK FACTORS IN DEVELOPMENT TRAJECTORIES…………...110
1.INTRODUCTION ... 111
2.DATASET AND DESCRIPTIVE STATISTICS ... 114
2.1. The Young Lives Survey dataset ... 114
2.2. Descriptive Statistics ... 115
11
4.MENTAL HEALTH AND CHILD DEVELOPMENT AT EACH STAGE ... 118
4.1. Methodology ... 118
4.2. Correlation Estimates: Results ... 119
4.3. Gradients Analysis at each stage in the child’s development cycle ... 124
5.MENTAL HEALTH AND CHILD DEVELOPMENT TRAJECTORIES ... 128
5.1. Methodology and Conceptual definitions ... 128
5.2. Trajectories Estimates: Results ... 130
6. CONCLUSIONS ... 132
REFERENCES ... 133
TABLES ... 135
12
L
I S T O F
T
A B L E S
CHAPTER 1:
Table 1.1. Progresa monthly cash transfer schedule ... 39
Table 1.2. Sample of households used in the analysis ... 39
Table 1.3. Differential attrition by treatment status and baseline characteristics ... 40
Table 2. Impacts of differential exposure to the CCT on households’ Welfare Trajectories ... 41
Table 3.1. Heterogeneity analysis for baseline characteristics relating to Physical Capital ... 42
Table 3.2. Heterogeneity analysis for baseline characteristics relating to Human Capital ... 43
Table 3.3. Heterogeneity analysis by Shocks to the household ... 44
Table A.1.1. Robustness check: Estimates of Mobility Ranks results as a function of long-term attrition ... 46
Table A.2. Administrative information on Date of first transfer ... 48
Table A.3. Heterogeneity analysis by Shocks to the Household (other waves) ... 49
CHAPTER 2: Table 1. Young Lives Survey Sample information ... 87
Table 2.1. Factor loadings: Psychosocial competencies ... 87
Table 2.2. Factor loadings: Psychosocial and Depression scale items ... 89
Table 2.3. Factor loadings: Aspirations outcomes (All waves) ... 91
Table 2.4. Internal consistency test for each Psychosocial and Aspirations measure: Cronbach’s Alpha ... 92
Table 3.1. Correlation estimates: Psychosocial and Depression items ... 93
Table 3.2. Correlation estimates: Aspirations measures ... 95
Table 4.1. Response of Economic outcomes to number of shocks ... 97
Table 4.2. Response of Aspirations measures to number of shocks ... 98
Table 4.3. Response of Psychosocial measures to number of shocks ... 99
Table A.1. Caregiver’s Occupational Aspirations for their child... 100
Table A.2.1. Factor Analysis results (Psychosocial items) ... 101
Table A.2.2. Factor Analysis results (Psychosocial and Depression scale items) ... 102
Table A.2.3. Factor Analysis results (Aspirations items) ... 103
Table A.2.1.1. Factor loadings: Psychosocial competencies (by each separate wave ... 104
Table A.2.1.2. Factor loadings: Psychosocial competencies (Items corrected for Acquiescence bias) ... 106
Table A.2.3.1. Factor loadings: Aspirations outcomes (by each separate wave) ... 107
Table A.3. Correlation between number of shocks and baseline wealth ... 109
CHAPTER 3: Table 1. Young Lives Survey Sample information ... 135
Table 2.1. Descriptive statistics ... 136
Table 2.2. Descriptive statistic (by Mental health factors) ... 137
Table 3. Factor loadings: Mental Health Measures ... 138
Box 1. Mental Health Key (CESD scale symptoms of depression) ... 139
Table 4.1. Correlation estimates: Weight ... 140
Table 4.2. Correlation estimates: Height ... 143
Table 4.3. Correlation estimates: PPVT (standardized score) ... 146
Table 5.1. Correlation between Maternal Mental Health and Child’s development trajectories: Ethiopia... 149
Table 5.2. Correlation between Maternal Mental Health and Child’s development trajectories: India ... 150
Table 5.3. Correlation between Maternal Mental Health and Child’s development trajectories: Vietnam ... 151
Table 5.1.1. Correlation estimates (full controls): Ethiopia ... 152
Table 5.2.1. Correlation estimates (full controls): India ... 153
13
L
I S T O F
F
I G U R E S
CHAPTER 1:
Figure 1. Consumption distribution by Treatment and Eligibility ... 21
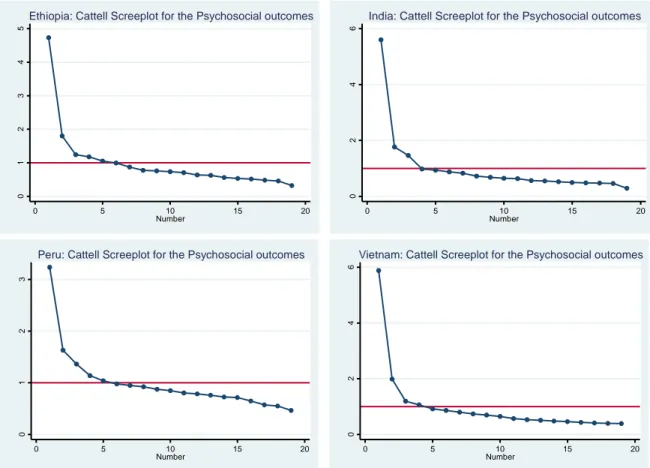
CHAPTER 2: Figure 1. Catell scree plots for the Psychosocial measures ... 68
Figure 2. Catell scree plots for the Psychosocial measures including the Depression items ... 70
Figure 3. Catell scree plots for the Aspirations measure ... 73
Figure A.1. Frequency of shocks by type of adverse event ... 100
CHAPTER 3: Figure 1. Child development gradients (Ethiopia) ... 126
Figure 1.2. Child development gradients (India) ... 127
14
Chapter 1
Long-term Impacts of the timing of Conditional Cash Transfers on
Households’ Economic Mobility
Abstract
Could the timing of an intervention affect its impact? More specifically, could a small time-differential in the entrance into a CCT program have an impact on the household’s long-term welfare trajectory? This could be the case if households’ binding constraints are not constant over time. These constraints are likely to be dynamic due to the heterogeneity between households. This paper exploits the randomized evaluation design of a renowned CCT program to evaluate the impact of an 18-month differential in exposure to the program on the likelihood that a household presents a path of sustained poverty or downward mobility, among other trajectories. Furthermore, I explore how the impacts of the differential timing vary according to the heterogeneity between the households (in terms of physical and human capital and exposure to shocks.) The heterogeneity analysis indicates that early receipt of the program impacts households to differing degrees according to their characteristics at baseline relating to physical capital (for land and homeowners and those close to markets) and human capital (for primary and secondary aged members). However, the heterogeneity between households in terms of their exposure to shocks does not seem to affect the impact of the timing of the CCT in the long-run. Overall, understanding how the timing of transfers may affect the extent of their impact can be important for targeting purposes, taking into account households’ heterogenous and dynamic constraints.
15
1. IntroductionFor nearly a decade now there has been a wave of optimism about the increase in socioeconomic mobility in Latin America. According to comparable regional estimates, two in five Latin Americans were upwardly mobile between 1995 and 2010, resulting in an expansion of the middle class of approximately fifty percent over that period. Some of the cross-country descriptive evidence suggests that targeted interventions, specifically conditional cash transfers (CCTs), might have played a key role in promoting upward mobility. In contrast, general social spending (on untargeted schemes such as pensions or unemployment) showed little correlation to mobility in the region (Ferreira et al, 2013).
The focalized nature of social protection is understood to be a key component to enhance progressive socioeconomic results, such as providing opportunities for upward mobility and combating poverty persistence. Indeed, for conditional transfers there is direct evidence that targeting based on the household’s characteristics affects considerably the impact and efficiency of the program (de Janvry and Sadoulet, 2006).
In addition to targeting at the household level, could the timing of an intervention of this sort matter for it to have an impact on socioeconomic mobility? By definition a research question examining socioeconomic mobility requires a prolonged time dimension, whether referring to mobility over time within a generation (intrageneration) or into the next generation (intergenerational). In the case of CCTs, a large literature has
documented the short and medium-term impacts of the pioneering Mexican program Progresa5 and its
successors (cf. Fiszbein and Schady, 2009; and more recently Baird, et al, 2014). The evidence is now emerging about the long-run impacts though it is mixed and still limited, thus remaining high on the research agenda
(Molina-Millán, et al. 2019a)6.
Understanding how the timing of CCTs and transfers in general may affect the extent of their impact, on human capital and subsequent outcomes, can be important for targeting. This proves particularly relevant as some of the more recent transfer programs target narrower populations and objectives (e.g. Filmer and Schady, 2014 in Asia or Baird et al., 2011 in Africa). The emerging long-term evidence has accordingly laid the focus on certain critical age ranges of exposure to the intervention (Barham et al, 2013; Molina Millán, et al, 2019b; Parker and Vogl, 2018). The majority of existing evaluation studies for CCTs identify average treatment effects, even if the focus is on intergenerational impacts (Araujo, et al. 2018; Parker, Vogl, 2018). The evidence of the program’s
5The program was initially called Progresa in 1997; the name was later changed to Oportunidades in 2002, and more recently rebranded as
Prospera. In this study I adhere throughout the paper to the program’s original name.
6 The review study by Molina-Millán, et al. (2019a) finds consistent positive long-term impacts on schooling but less so for cognitive skills, learning or socio-emotional skills. The results for impacts on earnings and employment are mixed, possibly because former beneficiaries were still too young. A number of the studies reviewed find estimates which are not statistically distinguishable from zero. However, the authors caution that it is often not possible to distinguish whether this is due to an actual lack of impact or the methodological challenges facing all long-term studies.
16
specific effect on distributional measures remains scant. A recent exception examining the impact on inequality of opportunity is the study by Van de gaer and Figueroa (2014).
This paper uses the randomly assigned differential exposure between early and late treatment groups of Mexico’s renowned CCT program Progresa to evaluate the impact of the timing of the transfers on the households’ socioeconomic mobility within the same generation. The hypothesis that the timing of the conditional transfer may impact the household’s socioeconomic mobility follows from the premise that the household’s binding constraints are not constant over time. Rather, the heterogeneity between households, in terms of their access to and accumulation of physical and human capital, as well as the unexpected shocks they may encounter, renders these constraints dynamic. As such, the specific moment at which a household enters the program may affect the extent to which the CCT has an impact on its welfare. This impact will depend on the constraints faced by the household at that given point in time and whether these constraints are effectively lifted by the CCT. Moreover, the small time differential (less than two years) may potentially have lasting effects if the CCT affects not only the household’s contemporaneous welfare but rather the welfare trajectory on which the household is set.
In particular, in this paper I exploit the information from the panel’s middle survey rounds to construct 3-period welfare trajectories. A trajectory is defined as the sequence of a household’s position along the welfare distribution. More specifically I evaluate the impact of differential exposure to the program on the likelihood that a household presents a path of sustained poverty, sustained downward mobility, or temporary downward mobility (or the analogous upward mobility paths). The evaluation data allows the inclusion of the (ineligible) non-poor population in the mobility rankings (as opposed to simply gauging impacts on beneficiaries against the eligible poor in the control group). This ranking sets a higher bench mark against which to measure impacts - closer to the non-vulnerable, whom are too wealthy to qualify for the program.
The trajectories estimates indicate that the beneficial welfare impact on the early recipients does persist into the long term. In particular, the households that randomly received the transfers first displayed on average a higher likelihood of sustaining high welfare levels and a lower probability of remaining stuck in poverty. Thus, the persistence effects stand the test of time while the impacts on mobility decay (upward and downward movement, sustained as well as temporary).
Furthermore, I explore how the impacts of the differential timing vary according to the heterogeneity between the households (in terms of physical and human capital and exposure to shocks.) The heterogeneity analysis indicates that early receipt of the program impacts households to differing degrees according to their characteristics at baseline relating to physical capital (for land and homeowners and those close to markets) and human capital (for primary and secondary aged members). However, the heterogeneity between households in terms of their exposure to shocks does not seem to affect the impact of the timing of the CCT in the long-run. The rest of the paper is organized as follows. Section 2 provides the basic relevant background information on the program, including the program design and data set used. In section 3 I present some definitions regarding the measure of intragenerational mobility used and the conceptual framework to motivate the hypothesis that the timing of the transfers may affect their impact on economic mobility. The empirical strategy, leveraging the
17
experimental design and constructing welfare trajectories to evaluate the impact of timing on socioeconomic mobility, is laid out in section 4. The aggregate results for the short, mid and long-term trajectories are presented in section 5, followed by the heterogeneity analysis with focus on the long-term estimates in section 6. Concluding remarks are presented in section 7.
2. Background of the Program
2.1 Program design
As one of the most renowned and studied CCT programs the rules and evaluation design of Progresa have been extensively documented (Behrman and Todd, 1999a, 1999b; Skoufias and McClafferty, 2001). In this section I therefore limit the information to the program’s most basic, relevant aspects. Progresa started operating in the most marginal rural communities in Mexico in 1997, covering approximately 300,000 beneficiary households.
Subsequently, the program expanded into urban areas covering six million families by 20167, or about one quarter
of families in Mexico. Its broad coverage and prolonged tenure - as opposed to other randomized evaluation trials (RCTs) consisting of small, temporary pilot interventions-suits well the distributional focus of this study on long-term mobility.
The program provided cash transfers to mothers, conditioned on children’s enrollment in school and regular attendance (85 per cent of the time) as well as scheduled visits to health centers. Originally the program provided grants only for children between the third grade of primary and the third year of secondary school (i.e. ninth
grade) aged eight to seventeen years8. Under the original grant structure, cash amounts (adjusted every six months
for inflation) increased as children progressed to higher grades to reflect the increased opportunity cost of schooling as children grow older. In addition, at the secondary level of education (grades seventh through ninth)
cash amounts were slightly higher for girls than boys (by about 13 percent; Table 1.1)9. Students benefiting from
the program are allowed to fail each grade once, but if a same grade is repeated twice, the schooling grant is discontinued permanently. Finally, the program also provides subsidies for school supplies and a fixed transfer for nutritional support linked to health clinic attendance. However, in terms of magnitude the school grants represent the majority of the program benefits.
7 According to official figures by 2016 the latest version of the program, including conditional and unconditional schemes (esquema sin corresponsabilidad), covered close to 7 million Mexican families. https://www.gob.mx/prospera/documentos/que-es-prospera
8 In 2001 the program was extended to include high school (upper secondary) grants and the age limit increased to 21 years.
9 By the end of 1999 the educational grants ranged from 80 pesos (about $US8) in the third grade of primary to 265 pesos ($US26) for boys
and 305 pesos ($US 30) for girls in the third year of secondary school (all nominal prices). For further details on the program rules see Skoufias and Parker (2001).
18
2.2 Evaluation design and data
As documented in several previous studies on Progresa, the original evaluation and sample design for the program
consisted of 506 rural communities10 (localidades) of which 320 were randomly assigned to receive benefits
immediately and the other 186 to receive benefits at a later point in time. The eligible households in the original treatment localities (henceforth referred to as the treatment or early treatment group) began receiving program benefits in the spring of 1998, while the control group (also referred to as the late treatment group) started receiving benefits at the end of 1999. Program eligibility depended on poverty status of the household as determined by a proxy means test. In particular, households in both treatment and control villages were classified as being eligible or ineligible according to an assessment of their permanent income from information collected in a census of localities carried out in September 1997. As a result of this selection process slightly over half of
the households in the evaluation sample were initially classified as eligible in 1997.11
This census, the 1997 Survey of Household Socio-Economic Conditions (ENCASEH 97), provided the
pre-program data for the evaluation12. In March 1998 before any transfers were distributed a specially designed
baseline (Wave 1) evaluation survey (ENCEL survey) was applied to all households in both treatment and control communities to collect detailed information on demographics, schooling, health, employment, income and expenditures. The first follow-up ENCEL survey was conducted in October 1998 (Wave 2). From then until November 2000 ENCEL surveys (Waves 2 through 6) were applied every six months. Since control households started receiving benefits between November and December 1999 the experimental variation phase comprises Waves 2, 3 and 4. A new follow-up survey (ENCEL 2003 or Wave 7) was conducted in 2003 which included all the households that could be located in the original 320 treatment localities and the original 186 control communities. Finally, the most recent follow-up survey was carried out in 2007 (ENCEL 2007 referred to as
Wave 8), though this final survey was only carried out in a subset of the original evaluation localities13. Given the
long time-span between the base and end-line, and notably the administrative issues concerning data collection for the final round, attrition is of particular concern as I discuss next.
For this study I build on the household panel dataset used in Gertler et al. (2012) which linked the ENCASEH97 to the ENCEL surveys between Wave 2 and 7. To this panel I added Wave 1 (the baseline ENCEL) and Wave 8 to obtain a ten-year span. I mainly focus on the changes in household consumption between the baseline and
10 From the following seven states: Guerrero, Hidalgo, Michoacan, Puebla, Queretaro, San Luis Potosi, and Veracruz.
11 There were actually two rounds of selection of eligible households in Progresa. In the first selection 52 percent of households were initially classified as eligible. A few months later, still before the program began, the list of eligible households was revised and 54 percent of the households originally classified as ineligible were added to the beneficiary group. This reclassification procedure was known as the 'densification'. However, around 60 percent of reclassified (or densified) households did not receive transfers because of administrative problems. In this study I adhere to the original classification of households (i.e. the ineligible group constitutes 48 percent of the sample). This has mostly been standard practice in studies using the Progresa evaluation dataset since the incorporation of the densified households is less well documented (see for example Gertler et al., 2012; and Angelucci and Di Giorgi, 2009).
12 See INSP 2006 for further details on the three successive phases of the targeting process, ie. [(i) Geographic targeting of marginal areas with adequate access to education and health facilities; (ii) targeting based on discriminant analysis applied to the ENCASEH survey; and (iii) Verification and modification of the beneficiary roster at a community assembly.]
13 Due to budgetary and operation cost issues, only localities with more than 20 dwellings (viviendas) in 2003 were revisited in 2007. As a result, 37 of the 320 early treatment localities and 10 of the 186 late treatment localities were excluded from the survey sample in 2007 (Instituto Nacional de Salud Pública, 2007). In terms of the households from the original sample included in the ENCEL 2003, but excluded in ENCEL 2007, this amounts to 2.9 percent overall sample loss, slightly higher for the treatment group (3.1 versus 2.3 percent for the control) (see Clavijo, 2011 for further details on the survey sampled in Wave 8).
19
Waves 2 and 4 (for the short-term analysis), and the changes between baseline and Waves 6, 7 and 8 (for the
long-term heterogeneity analysis)14. I concentrate on the household as the unit of analysis primarily to address
non-random attrition concerns which are more salient at the individual level15. The complete unbalanced panel
contains 20,670 households with consumption data at baseline, of which 52 percent (i.e. 10,676 households) were originally classified as eligible.
Of these eligible households approximately 2 thirds belong to the early treatment group and the other third to late treatment. Table 1.2 details the sample of households used for the core of the analysis in this study (i.e. households, present at baseline [Wave 1] and at each follow-up, for which consumption data is available). Note that the all regression estimates in the paper use the sample of eligible households at each period (column 3 in Table 1.2) to measure the impact on mobility of differential exposure to the program (i.e. early versus late treatment households). However, the mobility outcomes (measured at the household level) are constructed using the entire consumption distribution (including all the households originally classified as ineligible [column 7] in
addition to the original treatment and control households (column 3)16.
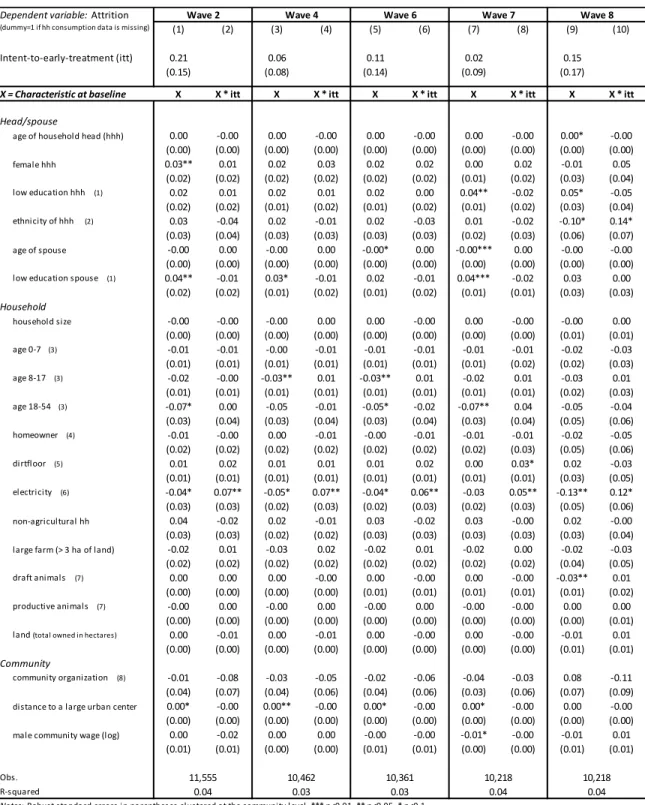
The attrition rates indicated in Table 1.2 show there is already considerable sample loss between the first two periods. Attrition amounts to 9 percent at the aggregate level by Wave 1 and 4 and is higher for the treatment group (10 percent versus 6 percent for the control). After this period the cumulative attrition remains stable up to Wave 7. The steepest hike in attrition (amounting to 48 percent at the aggregate level) happens between the last 2 periods; in the transition between the mid and long term. In all, attrition in the long-term panel is highest among the ineligible households (52 percent), followed by the treatment group (46 percent) and slightly lower among the control group (42 percent). However, beyond comparing the raw attrition rates, in order to understand the bias this sample loss may generate, it is necessary to determine whether there is differential attrition between the treatment groups based on their initial characteristics. Table 1.3 displays the estimates at each wave of attrition as a function of treatment status and the interaction term with a number of baseline characteristics at the head, household and community level. While attrition is associated to a few baseline characteristics (e.g. education of the head/spouse, household composition, and access to electricity), the results indicate there is no evidence of differential attrition according to treatment status. None of the point estimates for the intent-to-treat variable alone are statistically significant and, in all, less than five percent of the point estimates for the interacted terms are significant in the short term (columns 2, 4 and 6). By Wave 7 (5 and a half years since the beginning of the program) this proportion increases only slightly and is still less than 10 percent (columns 8 and 10). Access to electricity is the only variable which is consistently associated to a lower likelihood of attrition throughout the ten-year span, and to a greater extent for the early treatment group.
14 I do not use Wave 5 (i.e. May 2000) since the consumption data is not available for this round.
15 In previous research I conducted using the preprogram census and the last round of the ENCEL (ie. the ENCASEH linked to Wave 8) I
found substantial attrition especially among the sample of youths I studied (74 percent overall attrition and 76 percent among the male youth; see Clavijo, 2011).
16For further clarity, when constructing the household mobility measures, I use the entire universe of households in the evaluation villages (i.e. the original eligibles plus the original ineligibles; column 9 in Table 1.2). In contrast to other studies that drop the densified households from their sample altogether, in this study, although I adhere to the original classification into treatment and control, I still use the information of all the original ineligibles in order to characterize the welfare distribution in these villages at each period.
20
Moreover, in the long-term, households are less likely to attrite if the head is of indigenous descent (i.e. speaks an indigenous language). This sample selection due to ethnicity only appears in the final round of the survey. It is important to bear in mind that in this final wave only localities with more than 20 dwellings (viviendas) in 2003 were revisited in 2007. However, this administrative sample selection does not seem to be driving the ethnicity result since indigenous predominance is likely to be higher precisely in the smaller and thus excluded localities. Rather the negative association between ethnicity and attrition is more consistent with a lower likelihood of migration among the indigenous population. The interaction term indicates this effect is augmented among the early beneficiaries.
The potential biases from the two sources of non-random attrition seem to work in opposite directions. On the one hand indigenous descent is likely associated with lower levels of welfare while access to electricity correlates to higher living standards. Thus, it will be important to bear these factors in mind when interpreting the impact results. In any event, the ensemble of estimates for all the baseline characteristics across the five separate survey rounds suggests there is no evidence of differential attrition along treatment status, even in the long-run, despite the high rate of sample loss (48 percent) examined above. To summarize, even though the evidence suggests the
attrition is mostly random, in moving forward, I will control for all these baseline characteristics17 in the estimates
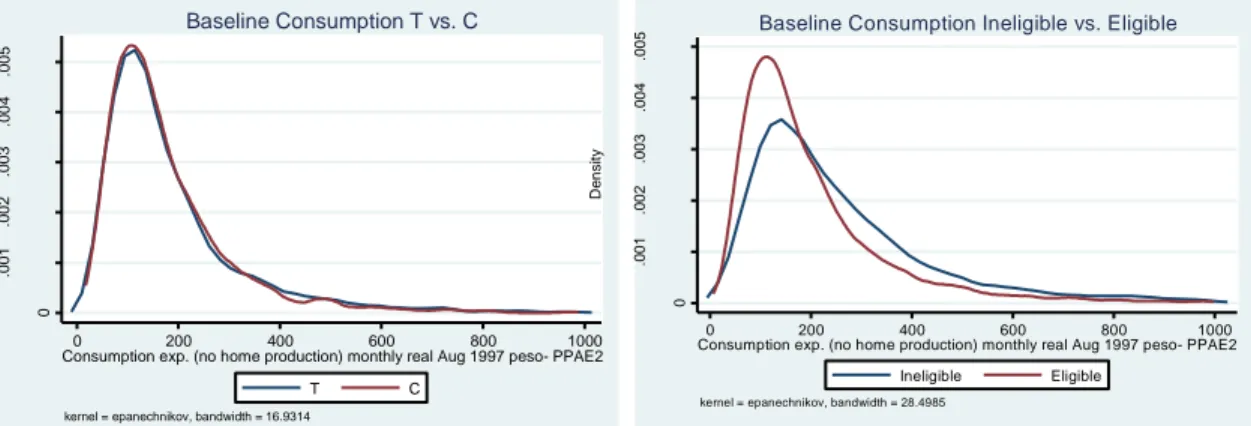
and remain mindful of the selection due to sample loss over the survey rounds. Further attrition checks are presented in the Appendix section (see section A.1.1 at the end). For the sample of households under study, treatment status (early treatment or late treatment for the control group) denotes ‘intention-to-treat’ (ITT). Given that I will be including the entire census of households to construct the mobility measures (i.e. using the full consumption distribution of the evaluation villages), it is important to examine how the ineligible ‘non-poor’ initially compare to the eligible poor. Figure 1 below plots the consumption distributions for the households in the sample at baseline by treatment status (left panel: T vs. C) and eligibility status (right panel: Ineligibles vs.
Eligibles). As expected, given the successful village randomization18, treatment and control households have
nearly identical consumption distributions (the kernel densities essentially overlap at all points the distribution). The consumption distribution for the ineligible households is mildly skewed to the right indicating a slightly higher mean consumption as expected given they were classified as non-poor. However, the distribution suggests they are not very well off, since there is still considerable overlap of their consumption distribution to that of the poor (eligible) household, in particular at the upper and lower tails. This similarity in terms of consumption at the extremes of the distribution reflects the fact that the program eligibility was based on a means test, to proxy for households’ permanent income, and not on actual consumption. The main take-away from this comparison (showing an overlap in consumption between the eligible and non-eligible households) is that when constructing the mobility trajectories, based on a household’s position along the entire consumption distribution, we can do not expect the wealthiest tercile at baseline to consist exclusively of the ineligible population. Rather, the distributions’ overlap suggests there will be some marginal ineligibles even at the lowest tercile, and some eligible
17Following to a large extent Gertler et al. (2012) in the choice of control variables.
18 Indeed, throughout the analysis that follows, the validity of the intent-to-treat estimates using the evaluation design of Progresa hinges on the randomization of households into treatment status. Thus, non-compliance and/or changes in the classification of eligible households may attenuate the detectable impacts. These potential concerns are addressed in the Appendix section at the end (see section A.1.2. on compliance and the ‘densification process’ surrounding Progresa).
21
at the top. It will be important to take into account this initial distributional set-up when interpreting movements in the subsequent analysis.
Figure 1. Consumption distributions by Treatment and Eligibility status
3. Conceptual definitions, Framework and Hypotheses 3.1. Intragenerational Socioeconomic mobility
Up to now I have used the term mobility loosely but an important distinction must be made regarding the concept of mobility I will use in this study. As reviewed in an influential taxonomy by Fields (2000 and 2006) the literature on economic mobility is vast and the different indices are not measures of the same underlying conceptual entity. Ideally the space, domain and concept of economic mobility should be well defined (Ferreira et al, 2013). The space
indicates the choice of variable in the distribution under consideration (in this study, household consumption19),
and the domain indicates how far apart in time the two (or more) distributions are observed. In the present context this distance is close to ten years (between 1997 and 2007) depending on the specific welfare trajectory under study.
It is key to distinguish between two very different domains of economic mobility: the intragenerational (for which the unit of observation, e.g. individuals or households, is tracked over time) and the intergenerational (for which the unit of observation indicating lineage is followed across generations, e.g. fathers and sons, mothers and daughters, etc.) Both domains are important in their own right and the distinction is fundamental since the key desirable properties for a measure of mobility across generations may differ from those for mobility over a person’s lifetime. Also, the two domains may portray diverse pictures since it is possible for a given society to exhibit high mobility within generations while remaining almost completely immobile across them, or vice versa.
19 More precisely, I use per capita adult equivalent household consumption. Household consumption includes food and nonfood
expenditures. From Wave 2 onwards, the food consumption data is based on a direct question about the amount of each food item consumed and purchased. In particular, respondents are asked about consumption of 36 food items grouped into 4 types (“Fruit and Vegetables”, “Cereals and Grains”, “Meats, Fish and Dairy”, and “Other processed foods”). However, the consumption questionnaire differed slightly in Wave 1 (food expenditures were not recorded for each item separately but aggregated by type. In any case, the comparability of the consumption variable in levels between the waves is not a particular concern since the outcomes of interest (the mobility measures) are constructed using the tercile positions along the distribution.
0 .0 0 1 .0 0 2 .0 0 3 .0 0 4 .0 0 5 D e n si ty 0 200 400 600 800 1000
Consumption exp. (no home production) monthly real Aug 1997 peso- PPAE2
T C
kernel = epanechnikov, bandwidth = 16.9314
Baseline Consumption T vs. C 0 .0 0 1 .0 0 2 .0 0 3 .0 0 4 .0 0 5 D e n si ty 0 200 400 600 800 1000
Consumption exp. (no home production) monthly real Aug 1997 peso- PPAE2
Ineligible Eligible
kernel = epanechnikov, bandwidth = 28.4985
22
The unit of analysis used in this study is the same household observed at baseline and up to a decade later. Thus, the domain of mobility is strictly intragenerational.
Following the taxonomy of mobility measures defined by Fields (2005)20 the underlying concept of mobility I
adhere to in this study is one of ‘mobility as movement’ (as opposed to ‘mobility as origin independence’ or ‘mobility as equalizer of long-term incomes’). In particular, within this concept of ‘mobility as movement’, I will focus on ‘positional movement’ (as opposed to ‘directional or non-directional consumption movement’ or ‘share movement’). The rationale for this choice of mobility concept is given by the strict focus in this study on intragenerational mobility.
As discussed in the review on mobility concepts by Ferreira et al (2013) across generations mobility is often associated with the notion of equality of opportunity, where a mobile society is one in which the outcomes of one generation do not substantially determine that of the next generation. As such, the concept of mobility most closely associated (in axiomatic terms) with this notion is that of origin independence (Shorrock, 1978). However, this is not necessarily the case within generation. For a given household, the lack of serial correlation between consumption at one period and another is not a particularly meaningful measure of mobility. There are ethical and incentive-related reasons why a certain degree of temporal persistence in the rewards to effort would be desirable within a generation (e.g. compensation for successful investments in human and physical capital). Origin independence therefore is not a suitable concept of mobility in this study. Rather, given the interest in tracing and understanding the pathways followed by the households that received the timely transfers and their standing relative to others, positional movement is arguably a more adequate measure of socioeconomic mobility.
More specifically, I build a simple outcome measure of each household’s trajectory21 in terms of its position (tercile)
along the consumption distribution. Thus, it is important to note that in this study I am not constructing a mobility measure for a population as a whole, as is common for descriptive analysis on mobility. Rather, I construct a welfare trajectory for each household to obtain an outcome measure of the household’s individual economic
mobility22.
Having established the space, domain and concept of intragenerational mobility used in this paper, for brevity, the term ‘mobility’ hereafter entails this specific definition.
3.2. Conceptual Framework and Hypotheses
In this section I lay out the conceptual underpinnings which sustain the hypothesis that the timing of the conditional transfer may impact the household’s socioeconomic mobility (i.e. affect its long-term welfare trajectory). This hypothesis stems from the main premise that the household’s binding constraints are not constant over time. Rather, the heterogeneity between households, in terms of their access to and accumulation 20 In addition to Fields (2000 2006) and more recently Ferreira et al. (2013), other reviews of the mobility literature include Atkinson et al., (1992) and Fields and Ok (1999).
21 The method used for the construction of the welfare trajectories is explained further below (Section 4; Estimation strategy).
22 A mobility outcome measure is needed for each individual household in order to perform the impact evaluation (of differential exposure to the CCT). Specifically, the impact evaluation in this context consists of comparing between early and late treatment households the (mean) likelihood of following a given trajectory (more details provided in Section 4; Estimation strategy).
23
of physical and human capital, as well as the unexpected shocks they may encounter, renders these constraints dynamic. As such, the specific moment at which a household enters the program may affect the extent to which the CCT has an impact on its welfare. This impact will depend on the constraints faced by the household at that given point in time and whether these constraints are effectively lifted by the CCT. Moreover, the small time differential (less than two years) may potentially have lasting effects if the timely access to the CCT affects not only the household’s contemporaneous welfare but rather the welfare trajectory on which the household is set. The premise that the households’ binding constraints are dynamic over time, thereby affecting the welfare impact of the transfer program, derives from the heterogeneous conditions surrounding each household; in particular from three sources of heterogeneity:
i. Heterogeneity in Human capital
To hypothesize about the household’s constraints in terms of its human capital it is useful to think about an underlying lifecycle of earnings of the household (Ben-Porath, 1967). The constraints faced by the household can be thought to be dynamic since they are shaped by the household’s changing demographic composition. As modeled in a number of studies, on the production of human capital, the constraints on the household’s earnings capacity is expected to change as members age (cf. Ben-Porath, 1967; and subsequently Basu and Van, 1998; and Baland and Robinson, 2000).
Taken to the rural, high poverty context where Progresa operated, for example, households with very young-aged children may be burdened to some extent, taxing their income earning capacity. Rearing new-born infants in particular may place a significant time-constraint on the caregiver attending the child’s needs and the corresponding income opportunity cost of that time. This income opportunity cost could be lower during the child’s primary school age, both because school fees are not as high as in secondary school (thus the lower transfer values of the CCT in primary) and because the opportunity cost of child wages are expected to be lower given the young primary- aged child’s (lack of) abilities. Consequently, the constraints imposed on the household’s earnings capacity would be lowest in the case of prime-aged members, having passed the stage of investment in their own human capital and being able to offer their labor supply to the household.
Indeed, early evidence on Progresa suggests the CCT had a safety net value for child schooling but not for labor (de Janvry, et al, 2010). Moreover, the heterogeneity between the households implied large differences in the impact of the conditional transfer (on enrollment) across categories of children. The largest effects detected were at the transition stage from primary school to secondary school (de Janvry & Sadoulet, 2006).
ii. Heterogeneity in Physical Capital
The prediction that the timing of the transfer may affect the program’s impact, depending on the household’s possession of physical capital (at the time of treatment), follows initially from the existing evidence that Progresa allowed households to invest part of the transfer in productive activities (Gertler et al 2012). This would be expected if the cash injection, for example, helped recipient households afford the start-up costs associated with entrepreneurial activities (McKenzie and Woodruff, 2006). Also, risk-averse beneficiary households could have
24
been more willing to invest in riskier, but higher return, activities if the transfers were perceived as a secure and steady source of income. Naturally, the capacity to successfully invest the transfers would depend on the household’s existing physical capital at the time of treatment (e.g. asset holdings that serve as start-up or complementary resources for the productive activity). In other words, the household’s investment constraints and therefore the CCT’s potential impact on welfare is expected to vary as a function of the household’s initial physical capital.
In fact, the evidence for Progresa shows that, during the experimental phase, beneficiary households increased ownership of productive farm assets and that agricultural production increased faster for beneficiary households than non-beneficiary households (Gertler et al, 2012). This resulted in significantly higher agricultural income (an estimated 9.6 percent increase as a result of an 18-month exposure period). Moreover, the returns on these investments were estimated to persist (beyond the experimental period), raising long-term living standards as measured by consumption. According to the estimates by Gertler et al., four years after households in the late treatment group were incorporated into the program, consumption levels for the early treatment households were still five percent higher. This particular finding motivates the hypothesis that the timing of the transfer might affect the program’s welfare impact. If the early impacts on productive activities were not sensitive to the timing of the transfers, then the late treatment households would be expected to eventually catch-up. However, the program’s impact could be time-sensitive if innovative investment opportunities are seized to a greater extent by early recipients.
Furthermore, and related to productive activity, the access to markets could also emphasize the importance of the timing of the transfers. For example, it is expected that within and across localities the increased consumption demand be met by an increase in production. Whether this translated into a welfare enhancing mobility opportunity for the program recipients would depend on which households managed to seize the production opportunity raised by the increased consumption demand. If the demand was met by the wealthier ineligibles, the program beneficiaries would be less likely to move up in the welfare distribution. Alix-Garcia et al (2013) provide evidence that the production increase within localities depended on the connection to surrounding markets. Specifically, in localities with good road infrastructure there was no production-side response among local ineligible households because the demand was met by surrounding localities. In contrast, where poor infrastructure localizes economic activity the increased consumption caused by the program was indeed met by an increase in output. However, this boost in output was driven primarily by the wealthy ineligible households, thus making upward mobility less likely for the program beneficiaries’ in these remote areas. Bearing this evidence in mind, I hypothesize that heterogeneity between household proximity to market centers may affect the program’s impact on the household’s welfare mobility. In particular, transfer recipients could be in better conditions to take advantage of the mobility opportunity in better-connected areas, with early beneficiaries enjoying a head-start to seize innovative investment opportunities.
25
iii. Heterogeneity in Exposure to ShocksThe notion that a household’s response to short-run shocks may have long-term consequences on the household’s welfare path rests on the premise of state-dependence in household decisions (de Janvry et al., 2006) and the evidence that temporary shocks may trigger poverty persistence (Premand and Vakis, 2010). In particular, disinvestments decisions, both in terms of human and physical capital (e.g. pulling children out of school or asset liquidation), taken in the face of transient events, may have lasting effects on households due to re-entry costs (e.g. school re-enrollment or lumpy asset expenses). In this respect, the CCT program may potentially attenuate the adverse lasting effects of shocks. This hypothesis builds on the evidence provided by de Janvry et al (2006), which suggests that Progresa had a strong mitigating effect on the school enrollment response to an income
shock23. More recently, Adhvaryu et al. (2018) analyzed the heterogeneity of differential impacts for the Mexican
program. In particular they compared the impacts between individuals who had experienced pre-program negative rainfall shocks during their first year of life, and all others. For educational and labor outcomes (i.e. labor force participation and employment stability), the authors find larger differential impacts for those exposed to negative shocks during childhood. These pieces of empirical evidence, focusing on children who were age eligible for the schooling transfer, complement the early results showing that beneficiary households managed to smooth their consumption in the face of adverse shocks (Skoufias and McClafferty, 2001).
Thus, the heterogeneity between households in their exposure to shocks is expected to affect the CCT’s impact on the welfare path the household follows. Finally, the program’s impact on the household’s welfare path is also expected to be time-sensitive. In this context, even a small time-differential in the receipt of the transfer could have lasting effects on the welfare trajectory followed. For a given household hit by a negative incident, receiving the cash at that moment could mitigate the adverse effect while receiving the transfer a year later would send the household on different (likely downward) trajectory.
To sum-up, the life-cycle of earnings framework and the existing evidence on the differential impact of CCTs depending on capital accumulation and shocks incidence support the postulate that households’ constraints are heterogenous and dynamic over time. On the human capital plane, the rearing costs (including income opportunity costs) associated to the different stages of the household members’ life-cycles are predicted to be high at early ages, possibly peaking around the transition between primary and secondary school, and falling towards prime-age (i.e. that of adult entrance into the labor market). In the case of physical capital welfare impacts of the program are predicted to vary depending on initial household wealth and the timing of the transfer could make a difference if innovative investment opportunities are seized to a greater extent by early recipients. Lastly, the CCT’s shock mitigating capacity, and hence its impact on the welfare trajectory, is expected to be sensitive to the timing of the transfers in proximity to the moment when the household is hit by an unexpected negative event.
23 As shown in the dynamic model the authors develop households may still choose to send children to school with a negative utility for
schooling but a high utility for cash as a consequence of an income shock. By contrast, since the conditionality applied to school and not to work (and the two activities were not time incompatible), the CCT did not have much of an effect in refraining parents from responding to an income shock by increasing child labor.