Publisher’s version / Version de l'éditeur:
Journal of Cellular Plastics, 31, July/Aug 4, pp. 356-374, 1995-07-01
READ THESE TERMS AND CONDITIONS CAREFULLY BEFORE USING THIS WEBSITE. https://nrc-publications.canada.ca/eng/copyright
Vous avez des questions? Nous pouvons vous aider. Pour communiquer directement avec un auteur, consultez la première page de la revue dans laquelle son article a été publié afin de trouver ses coordonnées. Si vous n’arrivez pas à les repérer, communiquez avec nous à [email protected].
Questions? Contact the NRC Publications Archive team at
[email protected]. If you wish to email the authors directly, please see the first page of the publication for their contact information.
NRC Publications Archive
Archives des publications du CNRC
This publication could be one of several versions: author’s original, accepted manuscript or the publisher’s version. / La version de cette publication peut être l’une des suivantes : la version prépublication de l’auteur, la version acceptée du manuscrit ou la version de l’éditeur.
Access and use of this website and the material on it are subject to the Terms and Conditions set forth at
Reference period for predicting long-term thermal performance of
thermal insulating foams
Di Lenardo, B.; Bomberg, M. T.
https://publications-cnrc.canada.ca/fra/droits
L’accès à ce site Web et l’utilisation de son contenu sont assujettis aux conditions présentées dans le site LISEZ CES CONDITIONS ATTENTIVEMENT AVANT D’UTILISER CE SITE WEB.
NRC Publications Record / Notice d'Archives des publications de CNRC:
https://nrc-publications.canada.ca/eng/view/object/?id=af563901-0a53-4239-915e-513f12447921 https://publications-cnrc.canada.ca/fra/voir/objet/?id=af563901-0a53-4239-915e-513f12447921
http://www.nrc-cnrc.gc.ca/irc
Re fe re nc e pe riod for pre dic t ing long-t e rm t he rm a l pe rform a nc e of
t he rm a l insula t ing foa m s
N R C C - 4 6 2 8 5
D i L e n a r d o , B . ; B o m b e r g , M . T .
J u l y 1 9 9 5
A version of this document is published in / Une version de ce document se trouve dans:
Journal of Cellular Plastics,
31, (4), July/Aug, pp. 356-374, July 01, 1995
The material in this document is covered by the provisions of the Copyright Act, by Canadian laws, policies, regulations and international agreements. Such provisions serve to identify the information source and, in specific instances, to prohibit reproduction of materials without written permission. For more information visit http://laws.justice.gc.ca/en/showtdm/cs/C-42
Les renseignements dans ce document sont protégés par la Loi sur le droit d'auteur, par les lois, les politiques et les règlements du Canada et des accords internationaux. Ces dispositions permettent d'identifier la source de l'information et, dans certains cas, d'interdire la copie de documents sans permission écrite. Pour obtenir de plus amples renseignements : http://lois.justice.gc.ca/fr/showtdm/cs/C-42
The Reference Period for Predicting
Long-Thrm Thermal Performance of
Thermal Insulating Foams*
BRUNO DI LENARDO AND MARK BOMBERG** National Research Council of Canada
IRC, Building M-24 Ottawa, Ontario,KIA OR6
Canada
INTRODUCfION
*This study is a part of a joint SPI·NRC Canada project on long term performance of
thermal insulating foams.
**Author to whom correspondence shouldbeaddressed.
R
eplacement of traditional blowing agents, chlorofluorocarbons (CFC), with partially halogenated chlorofluorocarbons (HCFC) that have thermal insulating performance inherently lower than that of CFC brought to question their long-term thermal performance (LTTP). As a result of research activities, two predictive techniques, slicing and scaling [1,2J or slicing and modeling [3,4], are now con-sidered for evaluating long-term thermal performance of different foam products: polyisocyanurate, polyurethane, extruded polystyrene, and phenolic (resole) foams. But without defining: What does the "long-term" period mean? much of these proposals remain unconvincingtothe practitioners.
The knowledge of long-term thermal performance of the insulating material is used to select one of many thermal insulating products for the construction, as well as to assess the economics of the energy performance of the building envelope. Whether the building is situated in a cold or hot climate, the insulation reduces the cost of heating or
356 JOURNAL OF CfLWLAR PLASTICS Volume31- July 1995
0021-955X195104 0356-19 $10.0010
Re{erence PeriodfOrPredicting I:I'TP o{Thermallnsutating FOams 357 cooling energy and as such should be subjected to an economic evalua-tion. One must compare the cost of purchase and installation against the future saving of the energy costs.
'Ibanalyze future returns of the investment, one must select a finan-cial analysis technique, for instance a life·cycle analysis.'Ibperform the life·cycle cost analysis, however, an estimate of service life is needed. Making such an estimate may not be as simple as it appears to be. Ac-cessibility and COBt of replacement are different depending where the particular material waB installed (roof deck, masonry cavity, curtain wall or insulating sheathing). Furthermore, according to the draft of the Canadian Standard Association (CSA) Guideline on Durability in Buildings, a deBign Bervice life may be as Bhort as ten years (e.g., tempo-rary classroom) or as long as 100 years in monumental or heritage buildings.
Smith [5] in diBcuBsing the understanding of life-cycle (LCC) stated: "The estimated service life of a roof is the most difficult assessment to make of all ofthe LCC factors. And this estimation can have a dramatic impact on the analysis. For example, if you figure the life of the roof at forty years, but it fails in fifteen years, the owner's true roofing cost will be much higher than you figured:' Except for exceptional cases, twenty years is recommended for comparative assessments [5].
Another cost·benefit analysis is based on the payback approach [6J. This approach was used, however, in a somewhat more complex scheme. First, an economic analysis was performed on. several Ilew and retrofitted wall constructions to establish an indicator called a "design value." This indicator would be uBed instead of the actual annual R-value, as the latter varies with the age ofthe foam. Since this indicator is sensitive to the length of the payback period for that insulation option,these calculations were performed for actual deBigns and prices of fuel and construction materials. Then, two other steps were taken, namely: (1) the actual measurements offoam aging were used to derive an analytical equation serving to establish the reference period; (2) the DIPAC computer model was applied for a case study, and its predictions were used to establish the reference period.
Evidently, one may expect different intervals of the reference period when applying these three techniques to foams with various aging characteristics, different thicknesses and constructions in diversified economic and service conditions. Bearing in mind that the objective of the design thermal resistance is to provide a comparative basis, the same reference time was selected for all foam products. The last part of this paper, therefore, applies the proposed definition of the design R-value to calculate payback for two selected foam products and
ana-BRUNO Dl LENARDO AND MARKBoMBEAG
358
THE SCOPE OF ECONOMIC ANAIXSIS
lyze differences between an approximate and the precise calculation of the payback time.
The term "life·cycle costing" is broad in scope and relatesto financial analysis techniques such as: cost·benefit analysis, savings·to-cost ratio, internal rate of return and the payback period. Depending on the type of investment under consideration, one technique may be better suited than the other [7,8J. Nevertheless, all these techniques essentially analyze initial and future costs with respect to future returns of the
investment.
In this review, the cost of installing different cellular plastic insula-tion is compared with the potential saving in the energy cost. This im-plies a comparison between the sum of the intial investment (i.e., the purchase and installation costs) and the presentworth of the heating costs (Le., savings in energy) associated with the considered option. This approach is essentially the "payback period" and will be used as a basis for comparison of various long-term R-values. A more complete approach, a life-cycle cost (LCC) would go beyond the period in which the investment pays for itself and examine the total cost of the con· struction over the expected service life of twenty-five or fifty years.
The concern of an investor or designer weighing several insulation options is to analyze the payback period, i.e., to determine how many years of energy saving is necessary to pay for the initial cost of the selected insulation option. The payback analysis is more suitable for this purpose than other types of economic analysis, e.g., life-cycle cost analysis, and this analysis can be further simplified if it can be per-formed not with the actual thermal resistance as it. changes with time, but with an indicator, called a design R-value. Therefore, the purpose of this paper is to select the reference period for the design R·value of the thermal insulating products.
'Ib derive the reference time, we will establish s precise payback period based on the diminishing annual R-value and determine the foam age when the actual R-value of the foam gives the same payback period. Since this analysis relates to a comparative study ''within a type" of cellular plastic insulation and not "between types" of insula-tion, costs related to maintenance, repair, replacement and disposal may be assumed as approximately equal and need not be quantified.
Five different cellular plastic insulations, polyisocyanurate, polyure-thane, extruded and expanded polystyrene and phenolic (resole) foams, randomly denoted as A, B, C, D and E foams, were analyzed in three
Reference Period fbr Predicting J.:I'Tp of Thermal/Mutating Jiboms 359 Canadian climates, Nova Scotia, Ontario and Alberta. We have con· sidered three heating fuels for comparison. All economic assumptions such as future interest rate, inflation rate and fuel escalation rate were the same as provided by the provincial authorities for development of the 1995 Canadian Energy Code. The cost of construction of the wall assemblies and cost of insulation alternatives were also provided by an independent consultant commissioned by the 1995 Energy Code Com· mittee (in one case, the cost estimate was obtained from the industry). The payback period was calculated in two steps: first, the annual heating cost per square meter of wall or roof was determined, then the present value(PVlof heating cost was calculated for each of the future years (now being year one). The sum of annual savings, expressed as the cumulative present value, is compared with the incremental cost of insulation. The investment is paid back when the cumulative present value is equal to the incremental cost of the insulation purchase and installation.
Since this is a comparative study of material alternatives, the heat· ing degree-day estimation method is adequate to calculate the annual heating cost per unit of area:
where:
HCU = 24
x
Ax
HDDx
FC/(Rx
Ell) (1)Then, the annual heating cost is calculated for several future years, each recalculated into the current dollars and expressed as the present value (PVl. This is done by using escalating fuel costs and corrected cost of money, namely:
HCU = Heating cost per unit area, ($/sq. m.)
A = Area of component, here1m'
HDD
=
Sum of degree·days during the heating season (OC day)R
=
Thermal resistance of the component (m'OC)/WFe
=
Cost of fuel: gas, oil or electricity ($/GJJEll = Efficiency factor for appliance: 0.6 for gas or oil and 1.0 for electric
PV
=
HCU x (1+
_)"-'/(1+
iY'-'
where:
_ =
fuel escalation rate(%)BRUNO 01 LENAAOO "NO MARK BoMBERG
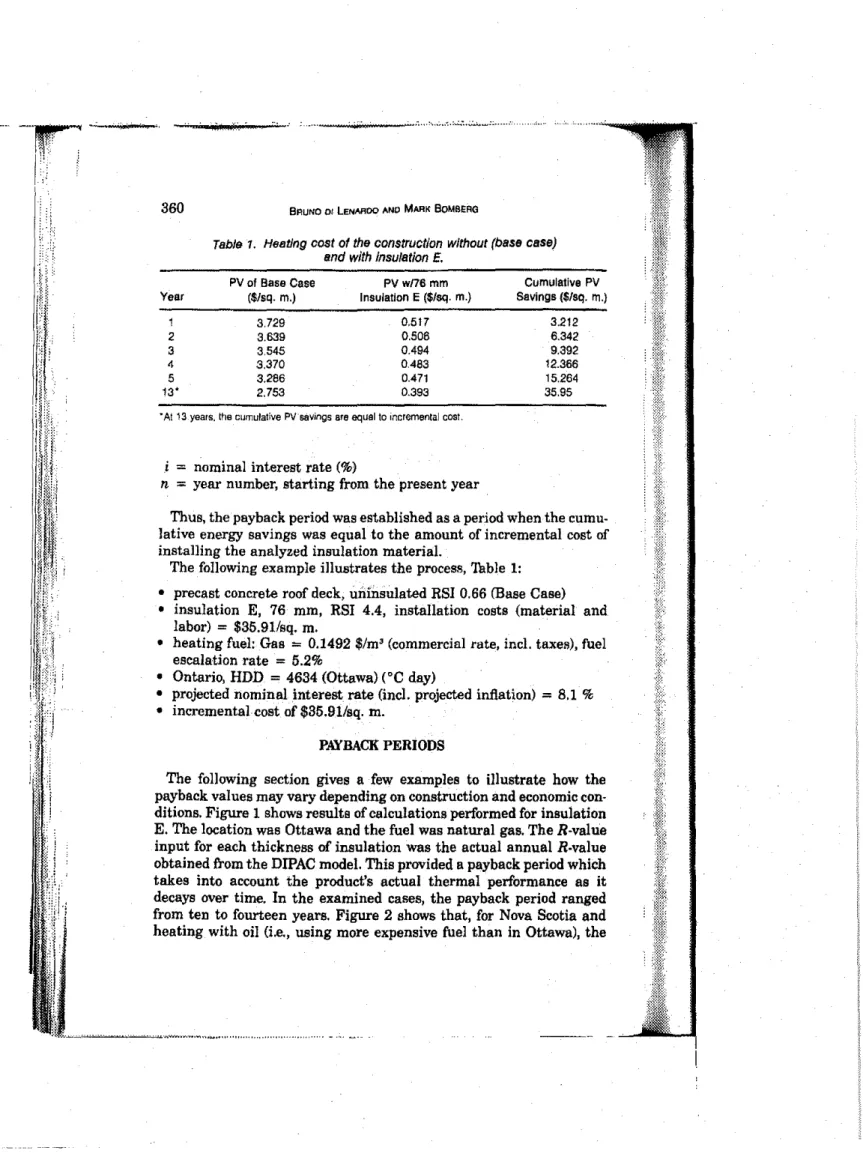
Table 1. Heating cost of the construction without (base case) and with Insulation E.
360
PVofBase Case PVwn6mm Cumulative PV
Yesr ($/sq. m.) Insulation E($/aq. m.) Savings ($/sq. m.)
1 3.729 0.517 3.212 2 3.639 0.506 6.342 3 3.545 0.494 9.392 4 3.370 0.463 12.366 5 3.266 0.471 15.264 13' 2.753 0.393 35.95
•At 13years.thecumulative PV'sSyings are equal 10 incremental cost.
=
nominal interest rate (%)n = year number, starting from the present year
PAYBACK PERIODS
Thus, the payback period was established as a period when the cumu-lative energy savings was equal to the amount of incremental cost of installing the analyzed insulation material.
The following example illustrates the process, Table 1: • precast concrete roof deck, uninsulated RBI 0.66 (Base Case) • insulation E, 76 mm, RBI 4.4, installation costs (material and
labor)
=
$35.911sq. m.• heating fuel: Gas '= 0.1492 $/m' (commercial rate, incl. taxes), fuel
escalation rate = 5.2%
• Onterio, HDD
=
4634 (Ottawa) (OC day)• projected nominal interest rate (incl. projected inflation)
=
8.1 %• incremental cost of $35.911sq. m.
The following section gives a few examples to illustrate how the payback values may vary depending on construction and economic con-ditions. Figure 1 shows results of calculations performed for insulation E. The location was Ottawa and the fuel was natural gas. The R-value input for each thickness of insulation was the actual annual R·value obtained trom the DJPAC model. This provided a payback period which takes into account the product's actual thermal performance as it decays over time. In the examined cases, the payback period ranged from ten to fourteen years. Figure 2 shows that, for Nova Scotia and heating with oil (i.e., using more expensive fuel than in Ottawa), the
'----'-'-"_.-'-',:.-'
_
..:" ; ,..: ,.:: , ; ,.;.,; [セGB :.,...;:: \ ;; ;; , .-; ; ,.., セ_._
.._-
'Reference Poriod fi>r Predicting LTTP of Thermo/Insulating!'barns 361
1
14 13 13,5 131
12 11'"
セ
'0
セ 9rC
8 48 81 78 91ThIckn••s of Insulation E.D\QI
Fiaurel. Payback period for insulation E in the wall: Ontario, fuel-natural gas.
7 6.5
!
6.31
6'"
J
5 4 48 61 78 91 Insulation lhJckn.... mm362 BRUNO 01 leN....ROO AND MARK BoMBERG
1
20 17.•1
1 5'"
..
"
i
..
10 19 39 wuJation thidcnes&,mmCOMPARISON OF PAYBACK PERIODS
...
セN...
Figure 3. Payback period for-insulation E in the wall: Nova Scotia, fuel-electricity.
same insulation results in a payback period between five and seven years.
Both figures show an increase in payback period with increased thickness of insulstion, i.e., diminishing returns all investment with
increase in thickness and/or R·value. Figure 3 shows the contrary, an increased insulation thickness (improved R·value) reduced the payback period. This could have been caused by one or both ofthe following factors:
(1) An apparent cost advantage was associated with selecting the thicker insulation.
(2) The thicker product maintained a higher thermal resistivity over the period due to a lower decay rate compared to the thinner product.
In the actual caBe, the increase in cost of material and installation was more than offsetbythe savings in heating costs.
Figure 4 shows errors caused by using a single thermal resistance value instead of the annual average value for calculation of the payback period. In case of insulation D, city of Ottawa with electricity as the fuel, the payback period was 19.9 years when using the annual aged R·value. When using the initial R-value payback was 12.8 years, with 180 day value (as recommended bythe U.S. Federal Trade Com-mission) the payback period was 17.3 years. These methods misrepre-sented payback by thirty-five and thirteen percent respectively.
Requestingcalcu}ationstocome within two percent of the reference value (allowing 2% error in calculations), one finds that for the
con-RefrrenceFtriod/bePredicting lfI'TPofThermal Insulating Jibams 363 18.3 19.7 19.9 19.9
'II
".セZエ[N セtiセᄋ00.,.
900 1800 1V, 2 Vr aVr 4Vr Act.R R;'value at liseFigure 4. Effect of R-value selection. lnsuJation D. 19 mm thick, retrofitor wall,Ontario, fuel-electricity.
sidered set of parameters the reference period for R·value is between two and one·half to four years, In the considered case, using the four year reference time provides a correct estimate of the true payback period.
Insulations Band C, shown in Figures 5 and 6, show again that 180 day aged R·values do not represent the true payback period. Using four to six year (Figure 5) and three to five year (Figure 6) R·values repre· sent the true payback period with 2% precision.
Aging rate is very slow for insulations A and E (not shown here). As a result, a close representation of the payback period obtained using the annual R·value may be obtained with any reference period.
20
,.
DOlV' 1800 1y, 2V, aVr 4Yr BV, BV, ActR
Jl..value
.t.1t
Figure5. Effect of R·value selection. Insulation B, 38 mm-thick, retrofitof wall.Ontario. fuel-electricity.
BRUNODr lE'NAADo AND MARKBaMBERG
364
DISCUSSION ON PAYBACK APPROACH
The ASTM Standard E 1121, "Standard Practice for Measuring Payback for Investments in Buildings and Building Systems" [6J states: "Use the method to find if a project recovers its investn,ent cost and other accrued costs within its service life or within a specified maxi-mum acceptable payback period <MAPP) less than its service life.Itis important to note that the decision to use the payback method should be made with care."
Indeed, care is used in this analysis which considers
costs
related to maintenance, repair, replacement and disposal as approximately equal for different types of cellular plastic insulation. 'J'he objectiveofthis analysis is to establish the reference time for design R·value. The authors believe that with todey's changing economy and marketplace a fifteen to twenty year payback period is likely to be all that the investors/owners are preparedtoconsider as a reasonable return. Thus the maximum acceptable payback period would be shorter than the service life of the building.Selecting the payback period approach as the means of economic analysis of the selected construction option (indeed the average payback varied between ten and eighteen years Figures 1-3), one faces the questionofwhat reference period should be selected to use a single R-value instead of the annual R-value. The five insulations examined may be suitably represented by a four year aged R-value. Thus, a four year re.ference period emerges as the benchmark for analyzing thermal performance.
The reference period for R·valueis,however, sensitivetothe length of the payback period for that insulation option. If a cavity filled with insulation is compared with "no" insulation in the cavity, the payback
ODaya 1800 1 Yr 2 V, 3 V, ,. Vr IiYr ActA
R-va)ue at age
FJgure 6. ,Effect of R.vaJue seJection. InsulationC, 50 mm thick, retrofitof waIl.Ontario, fuel- natural gas.
""-""---'M セ ..,., セMB
-"-"--"
BBセBB セMセセセセ セセセセMセセセMMセMMLRef"rence PerkKl ft>r Predicting LTTP of Thermal Insukmng fibams 365 period is usually less than ten years. When the payback period is less than ten years, the R·value input in the payback period calculation could be any R-value (e.g., 180 day, one or four years), and the result will be reasonably close to the true payback period.
In a retrofit situation, when adding an external insulating sheathing to a base wall with RBI 2.1 (R-12), the payback period often falls between ten to twenty years. In locations where the cost of fuel is low, the payback period will be closer to twenty years; higher fuel costs will result in lower payback period. A realistic prediction oflong-term R-value (e.g., 4 year R-R-value) is important only in such a case. In essence, the four year aged R-value was found suitable to conduct an unbiased comparison of insulation alternatives.
THE RELATION BETWEEN THE REFERENCE TIME AND THE AGING PERIOD
Thermal resistivity (r-value or inverse of k-factor) may be related to the period 9f aging in different ways: an exponential dependence of
r-value on time, ,-value versus square root of time, or イセカ。ャオ・ versus
logarithm of time. Independent of the manner in which this depen-dence is presented, one usually distinguishes between two stages of aging process. The primary aging stage shows a rapid reduction in thermal resistivity of the foam as a result of air components entering into the cells and changing the cell-gas composition. The _econdary aging _tage i_ often called a "plateau" _tage, since the air ingress into the foam is nearly completed and the outward diffusion of blowing agent changes the cell-gas composition at a much slower. rate.
Dillon [9) analyzed aging of twenty-five rigid foams with density ranging from 27 kg/m' to 49 kg/m' and thickness between 15 and 43 mm over the period upto ten years and described the data using two types of equations: and k
=
k.+
A(l - exp(-13m k = k.+
(A+
BtX1 - exp(-l3t» (3) (4)where k. is the initial thermal conductivity, k is the thermal conductiv-ity at time セ A, Band13 are constants obtained from the non-linear least square fitting of the data to Equations (3) or (4). At largs values oftime, Equation (3) approaches a horizontal asymptoteof(k.
+
A).As(5)
(8) (6)
(3a)
..-, ; ,.; -:..,:, ;.:'","..;;.
BAUNO 01 LENAROO AND MARKBoMBERG
h =h.
+
(h. - h.)exp( - (jt)r/t
= -
(lIa)ln(lia - exp( - a)/a) h•• = h.+
(h, - h.)/(exp( - (jt)-lX - (3t)366
one obtains
Introducing the time-averaged thermal conductivity, defined
sS
follows: it is not possible to define the end of aging process when describing it with Equation (3), normally one analyzes a period to reach 50% of the difference between the initial and final values ofthermal conductivity, so called half-time, t', as defined by the relation t'=
(In 2)/(j, The second curve has arising asymptote defined by the equationh = (h,
+
A)+
Bt,where the term(Bt)is usually small in comparison to the first term.Equation(3)can be rewritten by introducingh. as the value of the horizontal asymptote andh,being the initial thermal conductivity:
In(l/a - exp(-aVa)
=
セHェイIf time, r, is defined in such a manner that after substituting to Equation (3a), thermal conductivity h becomes equal to the time· averaged thermal conductivity, h.lk{r)
=
h,J, and denoting a=
(jtone obtains:
If searching for the relation between the total period of time,t,and the
interim value of time,T, one obtainsl;
'Private communication with professor David Yarbrough.
Using Equation (8) one msy relate the time-averaged thermal con-ductivity to the total period of time, i,e., define the reference time for the thermal measurements used to determine long-term thermal per-formance of cellular plastics,
セ....;.;,...; ⦅Nセ ,'..•:...;_ :;,.. _' _:.:...•.ZN⦅セNZNNNZNNゥNNN[セ ..:.J.•• _::_.:...••⦅セ •••セL
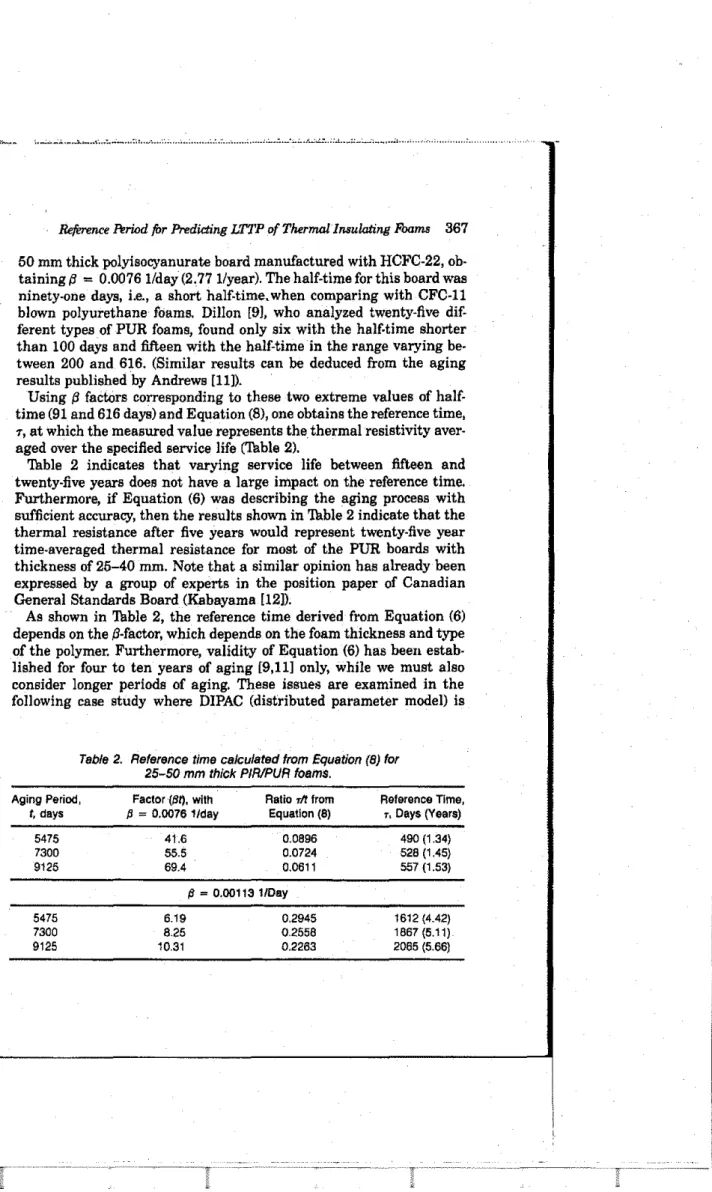
lkfrmmce Period fOr Predicting I.:rTP of Therrrw.lI1l8ulating J'bams 367 50 mm thick polyisocyanurate board manufactured with HCFC-22, ob-taining 13
=
0.0076 Ilday (2.77 l/year). The half-time for this board was ninety-olle days, Le., a short half-time.when comparing witb CFC-ll blown polyurethane foams. Dillon [9J, who analyzed twenty-five dif-ferent types of PUR foams, found only six with the half·time shorter than 100 days and fifteen with the half-time in the range varying be-tween 200 and 616. (Similar results can be deduced from the aging results published by Andrews [I1J).Using 13 faclors corresponding to these two extreme values of half-time (91 and 616 days) and Equation (8), one obtains the reference half-time,
T,at which the measured value represents thethermal resistivity
aver-aged over the specified service life (Table 2).
Table 2 indicates that varying service life between fifteen and twenty-five years does not have a large impact on the reference time. Furthermore, if Equation (6) was describing the aging process with sufficient accuracy, then the results shown in Table 2 indicate that the thermal resistance after five years would represent twenty-five year time-averaged thermal resistance for most of the PUR boards with thickness of 25-40 mm. Note that a similar opinion has already been expressed by a group of experts in the position paper of Canadian General Standards Board (Kabayama [12]).
As shown in Table 2, the reference time derived from Equation (6) depends on the l1-factor, which depends on the foam thickness and type of the polymer. Furthermore, validity of Equation (6) has been estab-lished for four to ten years of aging [9,l1J only, while we must also consider longer periods of aging. These issues are examined in the following case study where DIPAC (distributed parameter model) is
reble 2. Reference time celculeted from Equetion (8) for 25-50 mm thick PIR/PUR foams.
Aging Period, Factor(BQ, with Ratio Th from Reference Time,
t, days B
=
0.0076 1/day Equation (8) T,Days (Vears)5475 41.6 0.0896 490 (1.34) 7300 55.5 0.0724 528 (1.45) 9125 69.4 0.0611 557 (1.53) B
=
0.00113 lID.y 5475 6.19 0.2945 1612 (4.42) 7300 8.25 0.2558 1867 (5.11) 9125 10.31 0.2263 2065 (5.66)first validated and then used to describe the aging during an extended period.
.'-,",-'.,,'.
368
,..'.'." ..セ .
BRUNO 01 LENARDOMioMARKBoMBEAG
CASE STUDY: AGING OF A POLYlSOCYANURATE BOARD
A PIR board produced in August 1986 was stored in laboratory until January 1987, when it was cut into the test specimens. An average thermal resistivity determined on eleven specimens was 52.1 (mK)fW, and the standard errol' ofthis measurement was 1.1%[3]. In addition to aging at 60'C, previously discussed [3J, the dependence of thsrmal resistivity on time, diffusion and solubility coefficients were also
measured.
Applying these properties to the DIPAC model, sufficient agreement with the measured data was obtained. Having validated the material characteristics, we may use them for calculating long.term thermal performance of the discussed PIR foam while varying the board thick· ness from 20 to 90 mm.
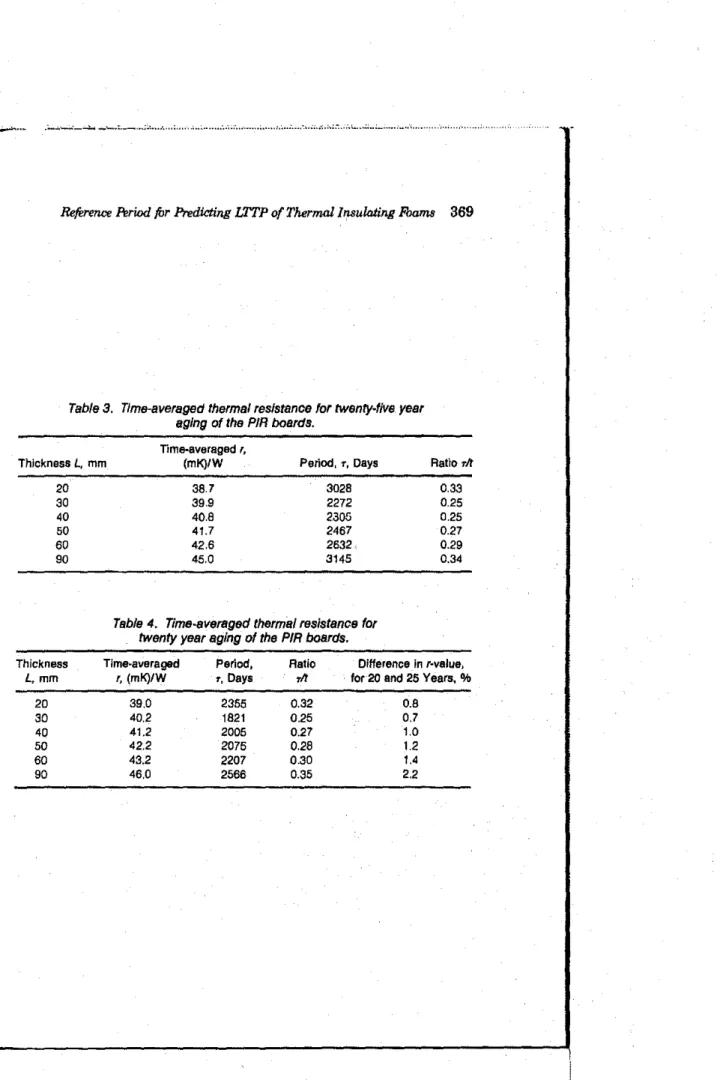
Results shown in Table 3 indicate that despite the thickness varia· tion between 20 and 90 mm and associated change in time-averaged thermal resistivity, there is very small difference in the teference time. The reference time on thin board is about 8.3 years; it decreases with increase of thickness to about 6.3 years (for 30-40 mm thick product) and increases again to about 8.6 years on very thick board (90 mm).
Previous discussion implied that considering energy savings on the basis of life cycle cost is justified only for the period of fifteen to twenty years. The reference time is therefore calculated again, this time for the service period of twenty years (Table 4).
The results obtained in this calculation (Table 3) are similar to those shown in Table 3. The reference time is about 6.5 years for 20 mm board, becomes as low as 5.5 years for board with 40 mm thickness and increases to 6 years at 60 mm board thickness. These results are very consistent, and the differences between time·averaged values calcu· lated for twenty and twenty·five years are small, in the range of 1 to 2 percent.
Four out of six reference periods shown in Table 4 (PIR product in the range between 30 to 60 mm thickness) indicate that taking six years (2200 days) would adequately describe long·term thermal performance of this product. It should also be mentioned that the actual 42 mm thick PIR board product was extensively tested by the manufacturer, who labeled the long.term thermal performance of this product within 1%ofthe estimated R·value at the reference period of six years.
T
Nセ ...MN[N[⦅セ _ ...:.__ •••;;,••••••••• : ...,., •• , .••••• :.:." .•••.•.••• , ... ,., •• : ...••.•• :; •••;. ,. ;;.l.•• ..;;_:_,..••,_.:<.•.•...
Refrrence Period fiJr Predicting I:fTPofThermal/TUluloJjngl'bams 369
Table 3. Time-averaged thermel reslstencetortwenty-five year aging of the PIR boards.
Thickness L, mm 20 30 40 50 50 90 TIme-averaged '. (mK)/W 38.7 39.9 40.8 41.7 42.5 45.0 Period,T, Days 3028 2272 2305 2457 2532. 3145 RatioTh 0.33 0.25 0.25 0.27 0.29 0.34
Teble 4. Time-averaged thermal resistance for twenty year aging 01 the PIR boards. Thickness L.mm 20 30 40 50 50 90 Time-averaged r, (mK)/W 39.0 40.2 41.2 42.2 43.2 45.0 p・セッ、L T,Days 2355 1821 2005 2075 2207 2568 Retio TIt 0.32 0.25 0.27 0.28 0.30 0.35 DIHerence In ,-value,
lor 20 and 25 Years,%
0.8 0.7 1.0 1.2 1.4 2.2
Design life-time is normally defined as the time interval during which an installed material, product or system should substantially maintain its design performance, and the life·time may also depend on the serviceability of the installation.
This definition is frequently misunderstood by assuming that any product should maintain its initial performance through the service life. When a manufacturer c1llims a certain levelof the product per· formance (accounting for weathering, aging or other time dependent processes), this manufacturer establishes the design performance level. It is therefore important for the SPIINRC project to establish a refer· ence time for which this "design performance level" should be related. Economic analysis, discussed in the above section, indicated that using thermal resistance at four years of aging (I.e., four year became the reference time) provided a sufficient agreement with calculations based on yearly values of thermal resistance for ten to twenty year payback. Examining the relation between the integrated over twenty year and the average PIR board thermal performal)Ce, we have estab· lished six years reference period. The same analysis performed on thick phenolic or modified resole foams gives the reference period of seven
years.
The 'fdesign thermal resistance" is, however, to provide a comparative
basis which ensures that the materials would "substantially maintain declared performance" [131. We have, therefore, selected five years as the reference time. The actual thermal performanceofthe foam board (as it varies depending on the foam thickness) at 1825 ± 25 days of aging is called the design thermal resistance ofthe foam board. Such a definition, as shown in 'Thble 4, means that the actual design values of thermal resistivity (or thermal conductivity) will be different for thin and thick foam products.
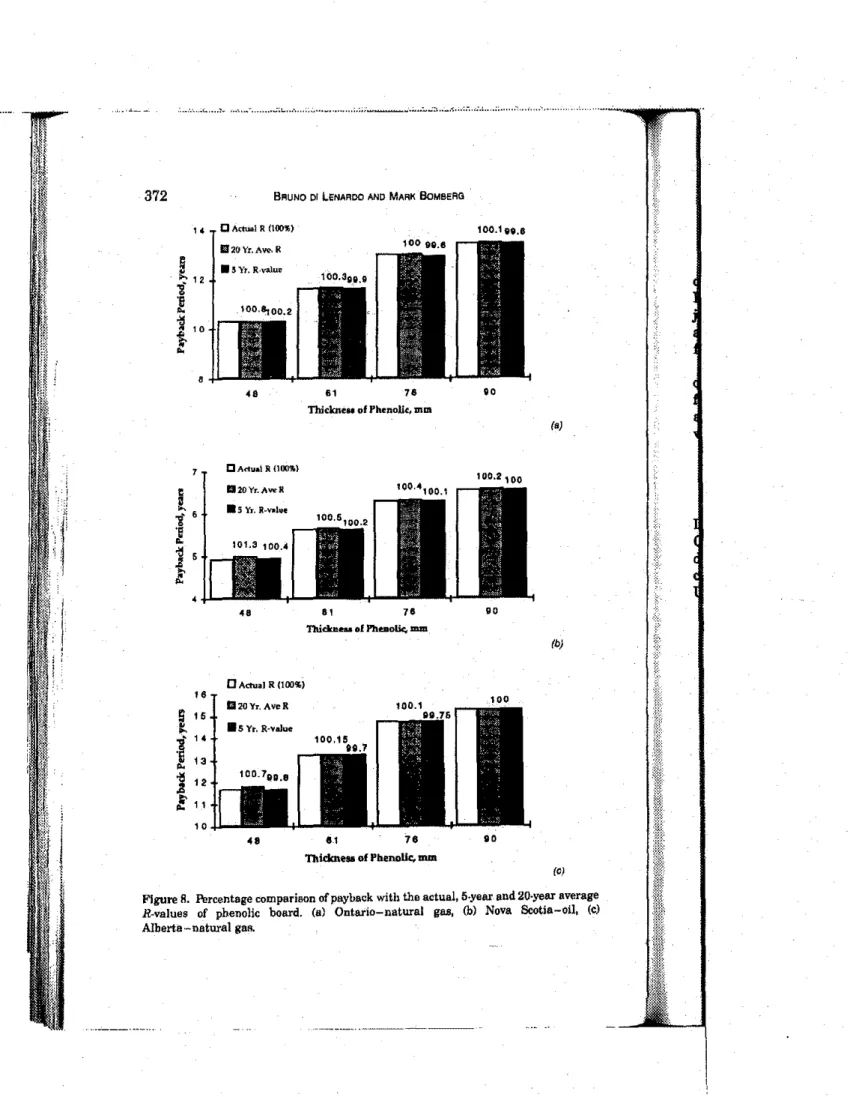
The concept of design thermal resistance is then applied to calculate payback period in two extreme cases from the five compared materials. Figures 7 and 8 show such calculations performed for phenolic and polyisocyanurate for!)Os where design r·value is co!)Opared with the ac· tually calculated annual R-values and the average r·value over 20 year period. While the design R·value data predict the payback period within 1.0% for phenolic, they predict 2-4% longer payback period for polyisocyanurate roofing boards and up to 7% for unfaced sheathing boards. The proposed design R-value definition is therefore set on the conservative side.
•.•••'_ _'-.... ••" ••• , .•• _ ;;' ••• r," , ;., ;.•セ ••セGMN[ •••.セ•••: .. NNセL :'
PROPOSED REFERENCE TIME FOR LONG·TERM THERMAL PERFORMANCE EVALUNrION
BRUNO 01 lENAAOO AND MARKBoMBERG
...,
...
"Reference hriod fbr Predicting LTTP ofThermalInsulating Fbams 371
Figure'1. Percentage comparisonof payback with the actual, 5-year and 20·year average
R-values for polyisocyanurate. Locations: (a)· Ontario, (b) Nova Scotia, (c) Alberta,
Ibi Is) '0 00 '0 100.1 ie.8 100.2 100
,
.
NN[N[[[GMセMMGN[NN ..-_.::,...⦅NセN[LN[NM ..".:..,.;;...,..,...;'."...,
Truclcne.. of PhC!noUc, mm••
BRUNO Of LENARDO AND MARK BoMBERG
C ActUal R (100'lli)
1120 Yr. Aw.it
.!I
Yr. R·value•
·.._...'...c,,-._..セN '''' •.•...••••.:;:..••.•
372
(C,)
Figure R. Percentage comparison of payback with the actual. 5·year and 20·year average R-values of phenolic board. (8) Ontario-natural gas, (b) Nova Scotia-oil, (c) Alberta - natural gas.
&{erencehrWfOr Predicting LTTP o[Thermal lnsukuing Foams 373 CONCLUSION
The reference time of five years was previously postulated by a group of experts in the position paper of Canadian General Standards Board, Kabayama [12J. This analysis confirmed that their opinion was fully justified, and it may represent five typical thermal insulating materi· als with thickness between 20 mm and 90 mm and service life between fifteen and twenty·five years.
The actual thermal performance ofthe foam boa.rd at 1825 ± 25 days of aging (five years) is the proposed design thermal resistance of the foam board. As the aging process depends on the foam thickness, the actual design values of thermal resistivity (conductivity) will also vary with the thickness of the hoard.
ACKNOWLEDGEMENTS
Deep gratitude is expressed to Mike Swinton, Building Performance Laboratory, Construction Research, National Research Council of Canada, for assistance and providing the authors with the economic data for analysis. We would also like to acknowledge the technical dis-cussions with Prof. David W. Yarbrough, 'Thnnessee 'Thchnological University, and Dr. Kumar Kumaran also from the IRCINRC.
REFERENCES
1. Bomberg, M. T. 1990. "Scaling Factors in Aging of Gas·FiIled Cellular Plastics:'Journal o[Thermollnsulation, QSHj。ョIZQTYセQUYN
2. Christian, J. E., G. E. Courville,R.S. Graves, R. L. LinkollS,D.L. McElroy,
F.J.Weaver and D.W. Yarbrough.l99l."ThermalMeasW"ement orIn·Situ
and Thin Specimen Aging of Experimental Polyisocyanurate Roof Insula-tion Foamed with Alternative Blowing Agenls:' ASTM STP 1116, pp.
QTRセQVVN
3. Bomberg, M. 1988. Gセ Model of Aging for Gas·Filled Cellular Plastics,"
Journal o[ Cellular Plastics, 24(Ju1y):327セST 7.
4. Bamberg, M. T. and M. K. Kumaran. 1994. '1,aboratory and Roofing Expo. sures of Cellular Plastic Insulationto VeTify a Model of Aging,·ASTM STP1224, Wallace and Rossiter, eds., Philadelphia, PA: American Society for Testing and Materials, pp.QUQセQVWN
5. Smith, T. L. 1993. 'Understanding Life-Cycle Costing:' Pro{esswnal Roofing, 10:66.
6. GuidetoEnergy Efficiency in Masonry and Concrete Buildings, Masonry
Council of Canada, April, 1982.
ofcfcセbャッキョ Insulations and Substitutes for Residential and Commer·
cial Construction:'NBSIR88-3829, NIST, July, 1988.
8. ASTM E 1121·92. "Standard Practice for Measuring Payback for Invest·
ment in Buildings and Building Systems:'Annual Book of ASTM
Stand-ards, Vol. 04.07.
9. Dillon, P.W. May, 1978. Chemeial, and Plastics, IlJD Dept., Tarrytown,
NY: private communication.
10. Yarbrough, D.W.,R.
a
Graves and J. E.Christian. 1991. "Thermal Per· formance of HCFC 22 Blown Extruded Polystyrene Insulation:' ASTMSTP 1116, pp. 214-228.
11. Andrews, W. R. 1984. "Observation, on k·Factor of Rigid Polyurethane,
Foam, a Long-Term Study," Journal of Thermal Insulation,
8(Oct):136-160.
12. Kabayama, M. A. 1987. "Long.Term Thermal Resistance Values of Cel·
lular Plastic Insulations," Journal of Thermal Insulation,
10<April):286-300.
13. ISO DP 10456·1991·07·02 Draft Proposal. "Methods for Determining
Declared and Design Thermal Values for Building Materials and Prod· ucts:'