Publisher’s version / Version de l'éditeur:
Vous avez des questions? Nous pouvons vous aider. Pour communiquer directement avec un auteur, consultez la première page de la revue dans laquelle son article a été publié afin de trouver ses coordonnées. Si vous n’arrivez pas à les repérer, communiquez avec nous à [email protected].
Questions? Contact the NRC Publications Archive team at
[email protected]. If you wish to email the authors directly, please see the first page of the publication for their contact information.
https://publications-cnrc.canada.ca/fra/droits
L’accès à ce site Web et l’utilisation de son contenu sont assujettis aux conditions présentées dans le site LISEZ CES CONDITIONS ATTENTIVEMENT AVANT D’UTILISER CE SITE WEB.
Insight: Non-Destructive Testing and Condition Monitoring, 57, 1, pp. 18-34,
2015-01-01
READ THESE TERMS AND CONDITIONS CAREFULLY BEFORE USING THIS WEBSITE.
https://nrc-publications.canada.ca/eng/copyright
NRC Publications Archive Record / Notice des Archives des publications du CNRC :
https://nrc-publications.canada.ca/eng/view/object/?id=3d095d10-7429-4eca-a3f9-c699d7b60970
https://publications-cnrc.canada.ca/fra/voir/objet/?id=3d095d10-7429-4eca-a3f9-c699d7b60970
NRC Publications Archive
Archives des publications du CNRC
This publication could be one of several versions: author’s original, accepted manuscript or the publisher’s version. / La version de cette publication peut être l’une des suivantes : la version prépublication de l’auteur, la version acceptée du manuscrit ou la version de l’éditeur.
For the publisher’s version, please access the DOI link below./ Pour consulter la version de l’éditeur, utilisez le lien DOI ci-dessous.
https://doi.org/10.1784/insi.2014.57.1.18
Access and use of this website and the material on it are subject to the Terms and Conditions set forth at
Design of an advanced automatic inspection system for aircraft parts
based on fluorescent penetrant inspection analysis
l
Submitted 03.08.14 / Accepted 04.09.14
J Zheng and W F Xie are with the Department of Mechanical & Industrial Engineering, Concordia University, Montreal, QC, H3G 1M8, Canada. M Viens is with the Département de génie mécanique, L’École de technologie supérieure, Montreal, QC, H3C 1K3, Canada.
L Birglen is with the Department of Mechanical Engineering, Polytechnique Montreal, Montreal, QC, H3T 1G4, Canada.
I Mantegh is with CNRC Aerospace Manufacturing Technology Centre, Montreal, QC, H3S 2S4, Canada.
Design of an advanced automatic inspection
system for aircraft parts based on luorescent
penetrant inspection analysis
Non-destructive testing (NDT) of aircraft parts has become increasingly important in improving the safety and reliability
of the aerospace industry, especially in the testing of high-temperature and high-pressure turbine engine parts. Among
the various types of NDT methods available, luorescent penetrant inspection (FPI) is comparably more cost-eicient
and is widely used in NDT on aircraft parts. However, current FPI still requires considerable labour forces in its processing,
inspection and analysis procedures. In this paper, we have developed an advanced automatic inspection system (AAIS)
that uses image processing and pattern recognition techniques to aid human inspectors. The system can automatically
detect, measure and classify discontinuities from the FPI images of aircraft parts. Tests have been performed on the
sample images provided by our industrial partners to evaluate our developed AAIS. The test results demonstrate that the
developed system has signiicantly improved the eiciency of FPI with satisfactory accuracy.
Keywords: turbine blades, discontinuities, FPI, image processing, pattern recognition.J Zheng, W F Xie, M Viens, L Birglen and I Mantegh
1. Introduction
In the aerospace industry, safety and reliability are always the most pressing issues. Scientists and engineers must pay attention to damage analysis, product quality control and maintenance. Regardless of the size of various parts, they are all critically important in maintaining the aircrat’s safety[1-4]. Typical failures
that appear on aircrat parts can be classiied into two categories: manufacturing failure or fatigue failure. Manufacturing failure is usually caused by the process of casting, solidiication and coating. Fatigue failure is usually caused by stress, thermal fatigue cracking and corrosion. Most of these appear as surface discontinuities. To investigate both types of failure, non-destructive testing (NDT) methods can be applied to inspect aircrat parts.
As a powerful tool for detecting and analysing structural failure and damage, NDT is widely used in aerospace, material and civil engineering. here are several NDT methods commonly used in the aerospace industry: magnetic particle inspection (MPI), ultrasonic testing (UT), eddy current testing (ECT) and luorescent penetrant inspection (FPI)[5]. MPI establishes a magnetic ield to detect the
defects on, or near, the surface of a ferromagnetic component. Imbert and Rampersad[6] have successfully developed and tested
MPI on small turbine blades. However, using the MPI method requires diferent coils for parts of diferent shapes and sizes, and the detection performance can be afected by the surface paint and the angle between the magnetic ield and the defect. UT sends sound waves into a test-piece to detect possible discontinuities. It can detect deep defects with high accuracy and without any part preparation. Unfortunately, UT only works well on large parts and structures such as turbine engine shats[7], or even bigger components such
as wind turbine blades[8]. Another popular NDT method used in
the aerospace industry, ECT, uses coils to produce a magnetic ield, which then generates an alternate electrical current (eddy current) on the test-piece. his current generates another magnetic ield and the inductance caused by this magnetic ield is measured to detect defects. ECT is highly sensitive to surface or near-surface
defects and it can automatically inspect special structures using well-designed probes[9-11]. Automated ECT on turbine blades is
presented in[11]. Because the distance between the probe and the test
surface should be kept constant during the ECT scanning process, it needs a special probe and a well-tuned surface scan for diferent types and sizes of blades. he process is also relatively slow[11]. For
some parts, such as mounting holes[9] or turbine rotors[10], it is easier
for the ECT process to be automated. However, for testing other parts, such as turbine blades, the detection process of the ECT is still ineicient. FPI is an alternative method for inspecting these types of parts and the process can be automated. he process of FPI requires the application of liquid luorescent penetrant to the surface of the test-piece. he liquid penetrant tends to be pulled into the defects by capillary action and the defects are detected by the trace of the penetrant. he surface is then cleaned and a developer is applied to pull the penetrant out of the defects’ surface. he indication of defects can then be seen under an ultraviolet (UV) light. Compared to the other NDT methods, FPI is cheaper, easier to apply and better for inspecting aircrat parts with small surface defects and complex geometry[12]. Besides, unlike the other NDT methods, FPI
can process a large surface area or a large volume of parts at once, making it the most cost-efective NDT method that maintains a high sensitivity in tasks such as defect detection in turbine blades.
AEROSPACE NDT
In the current FPI procedure, visual inspection largely relies on human inspectors. In other words, discontinuities and cracks are detected by human eyes under ultraviolet light. Depending on the training of the human inspector, such procedures may lead to variations in the interpretation of results[13]. In addition,
the manpower assigned to such tasks results in signiicant recurrent costs. In patents[14-17], automated FPI techniques
have already been developed that are in operation at present. Patton et al[14] have invented image enhancement techniques to
detect the failures in man-made structures, of which the sizes and shapes are very diferent from those of the aircrat parts we are dealing with. Henrikson’s invention[15] uses the intensity
value in hue, saturation, lightness (HSL) space, which is similar to grey level. In his invention, a threshold has to be set manually, which is neither consistent nor robust. Herveand and Prejean-Lefevre[16] and Budd[17] have invented similar techniques
using grey-level thresholds to detect cracks. However, the above-mentioned inventions cannot be applied directly in the aerospace industry, which has been seeking a solution to automate analysis of the FPI data of aircrat parts. he automated FPI technique has to be able to detect and classify complex defects. It must also perform with high sensitivity, reliability and repeatability.
To accomplish the task of detecting and classifying the indications from a complex background and noise in the FPI images of aircrat parts, we have developed an advanced automatic inspection system (AAIS) to automatically process FPI test images taken under UV light. he test images contain some typical indications of various types in a bright green colour, such as cracking, dusting, pit, cold shut, hot tear, etc. he developed AAIS has four parts: image processing, image segmentation, feature extraction and classiication. In image processing, we compare the standard RGB to the greyscale function[18] with the colour
components method[19], then combine wavelet[20] with median
ilter noise reduction and enhance the processing results with gamma transformation. For image segmentation, an efective way is to use the background subtraction method (BSM)[21,22]. In this
paper, we combine intensity thresholding, gradient edge detection and the BSM approach. We also develop an Otsu adaptive thresholding with Canny edge detection and the erosion-dilation-subtraction method to segment indications with high quality. Finally, we develop feature extraction and classiication functions to perform a preliminary classiication of the indications into two types and four classes according to the ASTM E433-71 ‘Liquid penetrant inspection’ standard[24,25].
he developed sotware has eicient image processing and classiication functions, which can extract key information from the indications and classify them into standard classes (ASTM-E433 ‘Standard reference photographs for liquid penetrant inspection’). With the user-friendly interface, inspectors can conveniently process FPI images to obtain the discontinuity information. With the developed sotware, the human inspectors do not need to check the aircrat parts under ultraviolet light, which may introduce errors. Hence, with the AAIS, the eiciency of FPI has been signiicantly improved and the accuracy is demonstrated to be the same or higher compared to that of human inspection.
he rest of the paper is organised as follows. In Section 2, the four main parts of the AAIS are presented in detail. In Section 3, the AAIS interface and FPI results on the samples from industrial partners are demonstrated. he paper concludes in Section 4.
2. Advanced automatic inspection
system
An AAIS is designed to aid human inspectors’ work in the FPI analysis of aircrat parts. he sample images of the FPI tests of aircrat parts and coupons are taken under UV light ater the FPI process. he main functions of the AAIS are divided into four parts: image pre-processing, image segmentation, feature extraction and classiication. Figure 1 shows a lowchart of the AAIS.
2.1 Image pre-processing
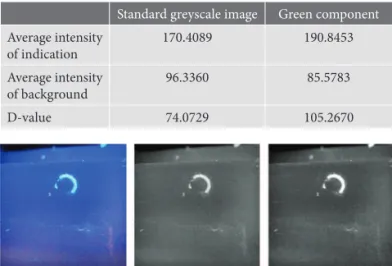
FPI images are standard RGB images with unique colour components. he indications are bright green and the background is comparatively dark. Instead of using the standard RGB to greyscale function (Equation (1)), it is found that the green components from the original RGB image can enhance the green indications in FPI images. he greyscale image results are shown in Figure 2. he comparison of the average intensity from those results is shown in Table 1. As can be seen, for the bright green indications in this research, the green components give better results than the standard greyscale function:
Greyscale value = 0.299 ! R + 0.587 !G + 0.114 ! B ... (1)
Table 1. Comparison of average intensity of indication and background
Standard greyscale image Green component
Average intensity of indication 170.4089 190.8453 Average intensity of background 96.3360 85.5783 D-value 74.0729 105.2670
To further enhance the greyscale image, an intensity transformation function is used. he intensity transformation works on single pixel and can map input intensities according to a given function. he
Figure 1. System flowchart of the advanced automatic inspection system (AAIS)
Figure 2. Original RGB image, standard greyscale image and green component of original image (from left to right)
‘log’ transformation and the ‘gamma’ transformation (Equations (2) and (3)) can easily enhance the intensity range of interest and reduce the inluence of background information[18]. In this case,
the aim is to have fewer details from the background image (lower intensity values) while retaining the indications (higher intensity values). Figure 3 shows the gamma transformation results with γ = 2.
T f x
(
(
, y)
)
= c ! log 1+ f x, y"#(
)
$% ... (2) T f x(
(
, y)
)
= c ! f!(
x, y)
... (3) where c is a constant and f(x,y) is the intensity value of pixel (x,y).In a real application, there may be some noise in the image. here are diferent kinds of noise reduction methods. A low-pass ilter is commonly used, but it may erase some edge information. A median ilter is an efective method for noise reduction and, unlike a low-pass ilter, it keeps the edge information[21]. In this project, a
median ilter is chosen for noise reduction. A 3-by-3 median ilter is deined in Equation (4):
M x
(
, y)
= median z{
kk = 1,2,…,9}
... (4)where zk is the intensity value of pixel (x,y) and its 8-connected neighbour pixels.
he wavelet noise reduction performs well because of its multi-resolution features[20]. A combination of the median ilter and the
wavelet noise reduction can achieve excellent robustness in the noise reduction function.
2.2 Image segmentation
Ater applying the image pre-processing functions, the greyscale images have better contrast without noise. hereater, image segmentation functions can be applied to extract region information. Image segmentation is the technique of dividing a target image into constituent regions. In this paper, image segmentation functions extract the indications from the image background. An Otsu adaptive thresholding with Canny edge detection and erosion-dilation-subtraction operations are presented in this section.
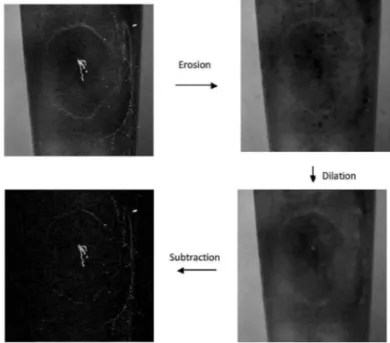
he erosion-dilation-subtraction (EDS) method extracts the background image from the original image irst, and then subtracts it from the original image to get the foreground image[21,22]. Normally,
in image processing, the background image can be obtained from 3D curve itting or surface itting sotware. In this paper, an advanced morphological operation method is applied, which combines the erode operation and dilate operation to eliminate foreground indications and to extract the background image. he erosion operation can thin an object in an image, while the dilation operation can thicken the object. With the appropriate size and shape of operation structure element (SE), the indications can irst be eliminated in the erosion operation, and then the background
image rebuilt using the dilation operation. By these means, the background image can be segmented from the foreground image, while introducing less additional information. Figure 4 shows the EDS operation procedure and the results.
Ater the applied EDS operation, the foreground image is obtained in greyscale. In this greyscale image, the desired indications are present, but also unwanted noise (ie penetration remains on the surface) that will mislead the system. To improve the accuracy, it is necessary to carry out a further thresholding segmentation step to discard the noise while keeping as much of the indications as possible. To do this, the Otsu adaptive threshold method is combined with the Canny edge detection method and two thresholds are set in both grey-value intensity and gradient.
hresholding is very useful in image processing to segment greyscale images into binary images. In this step, thresholding is used to obtain the binary information of indications from the greyscale foreground image. In intensity space, the Otsu adaptive threshold method is based on the histogram analysis of the greyscale image. his method irst assumes a threshold to classify pixels into two intensity groups, and then it computes the class variance and maximises this value. he maximum between-class variance ensures that the threshold can accurately separate pixels into two classes of intensity, ie the foreground indications and the background.
Edge detection is another efective approach in image segmentation. his approach segments the image in gradient space. Typical edge detection methods are Robert, Sobel and Canny edge detection[18,20,26,27]. Compared with the other two methods, Canny
edge detection performs better edge detection thanks to its double thresholding and connectivity analysis. he Canny method irst applies a customisable Gaussian ilter to smooth the image, where the user can choose the ilter parameters according to the size of the object, then it computes the image into a gradient map. Ater selecting two thresholds, TL and TH, the algorithm considers the pixels with gradients higher than TH to be the edge points, gNH, while the pixels with gradients lower than TL are treated as normal points, gNL. Finally, the Canny method is used to check the 8-neighbour connectivity in the pixel group gNM to ind those pixels with gradients higher than TL and lower than TH to connect the isolated edges. Figure 5 shows the inal result from the image segmentation.
Figure 3. Gamma transformation results with γ = 2
Figure 4. EDS operation procedure and result
AEROSPACE NDT
2.3 Feature extraction
In the previous steps, we discussed the image processing and image segmentation functions. By applying those functions, the AAIS can process the original image to obtain the indications in a bitmap image. In this step, feature extraction functions are introduced to measure the indications. he results of this feature extraction will be used in classiication functions and for aiding the human inspector in further detection.
he irst step of feature extraction is the boundary-following process using 8-neighbour detection. hen, the system can measure the object that is encircled by the detected boundary. Most of the detected objects represent potential defects. he useful features are centre position, length and width, area, minimum enclosing rectangle, aspect ratio, perimeter and rectangularity. In this paper, the border tracing, minimum bounding box detection and length, width and aspect ratio are introduced.
2.3.1 Border tracing
Border tracing is used to detect and label each object in the image. he result can be used for further feature extraction processes. In the previous steps, the image processing result has already been obtained in a bitmap image. he value of indication pixels is 1 (white) and the background is 0 (black). To perform the border tracing function, we use the 4-neighbour connection check method to remove all interior pixels and keep only the boundary pixels. Figure 6 shows how the 4-neighbour connection check works. If all 4-connected neighbour pixels of the centre pixel are 1, the centre pixel is considered to be an interior pixel and will be removed by the algorithm.
Border tracing can be performed by an 8-neighbour connection check and is carried out in the following steps:
l Scan for the top-let pixel as the start pixel of each object, Oi . For object Oi , mark the start pixel by giving a new pixel value, i + 1.
l Start from the let neighbour of the detected boundary pixel and perform an 8-neighbour connection check in a clockwise direction. If a new boundary pixel is detected and has a value of 1, record its position and assign a value of i + 1 to it.
l Repeat step 2 until no more new boundary pixels are detected.
l Repeat steps 1, 2 and 3 until all pixels in the target image have been scanned.
In the resultant image, all boundary pixels will be detected. he boundary pixels from object Oi will have its only pixel value i + 1 as a label to distinguish between each object. When the location of boundary pixels are recorded and restored, the chain code is very useful because it represents each position with only eight digits.
2.3.2 Minimum bounding box
Ater applying the boundary following process, the system detects all the objects in the image. he next step is to measure the indication represented by these objects. he minimum bounding box can measure the round and rectangular indications in length, width, centre position and rectangularity. In this step, the minimum enclosing rectangle detection is explained.
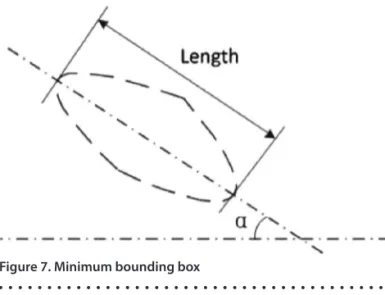
he minimum bounding box is the smallest rectangle that encloses the objects in the bitmap image. It can measure the objects’ centre position, length and width, orientation and rectangularity. As boundary points have been obtained in the previous section, one point can irst be selected as the starting point, the other boundary points scanned and then the distance between them calculated. Aterwards, the algorithm goes to the next starting point. Ater all points have been scanned as starting points, the longest distance between two boundary points can be found. hese two points are endpoints of the main axis of this object and the distance is the length (Figure 7). he remaining boundary points are scanned and the distance between the points to the main axis is calculated, then the longest distance from both sides of the main axis is selected as the width of the minimum bounding box.
Rectangularity is a measurement that relects the shape of the object. It represents the relationship between the area of the object and the area of the minimum bounding box (Equation (5)). It ranges from 0 to 1 and takes on a maximum value of 1 for rectangular defects and π/4 for circular objects. For slender or curved objects, such as cracks, the value is small:
R =AO
AR ... (5) where AO is the area of the object and AR is the area of the minimum bounding box.
Figure 7. Minimum bounding box Figure 5. Result of image segmentation
2.3.3 Length, width and aspect ratio
For the round or rectangular indications, the length is the longest straight-line distance of the indication. It can be measured by the minimum bounding box of the indication, as mentioned in the previous steps. But, in some cases, there may be complex indications, such as a crack whose length is not the same as the minimum bounding box’s length. In this case, the indication represents the path of the crack. To ind the length of this type of indication, one efective way is to generate a skeleton out of the indication using the thin function[18,28].
he thin function is a morphological operation which can thin an object to its skeleton. he thin function erodes the target object by rotating the structure elements, as shown in Figure 8. he algorithm continues performing the erosion function until no further change occurs in the target object. Figure 9 shows the result of the thin function.
From the skeleton image, the system can measure the length of the indication accurately. With the length and area of the indication, the approximate width of the indication can be calculated using Equation (6). he aspect ratio is deined by Equation (7), which is a critical value measuring the sharpness of the indication.
W
A= A L ... (6)
AS= L WA ... (7) where A and L are the area and length of an indication, respectively.
2.4 Classiication
With the features extracted from segmented images, the system can now perform classiication functions. In this speciic problem, there are plenty of types of indication from the sample images, such as typical cracking, dusting, pit, cold shut, hot tear and dross. With the features extracted from the FPI process, it is impossible to classify all the indications into speciic classes. In this paper, a
preliminary classiication is performed to classify the indications into two types and four classes, according to ASTM-E433 ‘Standard reference photographs for liquid penetrant inspection’, reapproved in 2003. ASTM-E433 ‘Standard reference photographs for liquid penetrant inspection’ is a speciic standard set for classifying and characterising indications detectable by the penetrant inspection method, which is adopted in this paper. he detailed classiication criterion is shown in Table 2[25].
Table 2. ASTM-E443 ‘Standard reference photographs for liquid penetrant inspection’
Type Class
1. Neither dimension is greater than three times the other
A. Single
B. Multiple unaligned 2. One of the dimensions is greater
than three times the other
C. Multiple aligned D. Intersection of surfaces
he ASTM-E433 standard classiies indications into two types: Type 1 round/rectangular indications and Type 2 slender indications. We can relate these two types to the extracted feature- aspect ratio S mentioned in the previous section. If S is less than 3 (ie S < 3), the indication is Type 1, otherwise the indication is Type 2. he single and multiple indications classiication is used to detect whether there are several indications in the same user-deined area. In this paper, instead of scanning every part in the image, only the areas in the neighbourhood of each indication are scanned. he algorithm traverses all the indications detected in previous sections. It applies a dilation operation N times to each of them to create the nearby areas and veriies if those areas are connected to each other. If so, those indications are classiied as multiple indications. he number of dilate operations can be chosen by the human supervisor.
Figure 10 shows an example of multiple indication detection. First, the algorithm selects one indication in the top-let picture as the initial object, then performs the dilation operation to create a nearby area for the initial object, as shown in the bottom-right picture. Finally, the resulting neighbourhood area is applied to the input image. If there are any other indications in the area, they will be classiied as multiple indications or group indications.
Figure 8. Structure element of the thin function. X represents pixels not necessary to scan
Figure 9. Result of skeleton extraction with the thin function
Figure 10. ASTM-E433 standard reference photographs for liquid penetrant inspection
AEROSPACE NDT
For Class D, where the indication intersects with the boundary, the algorithm needs to be able to deine the boundary of the part. he results from the previous step (image segmentation) can be referred to. In image segmentation, the foreground and background images are successfully segmented from the input image. In the background image, the boundary of the part can easily be found by applying edge detection. By matching the two images together, the intersections between indications and boundaries can be detected (see Figure 11).
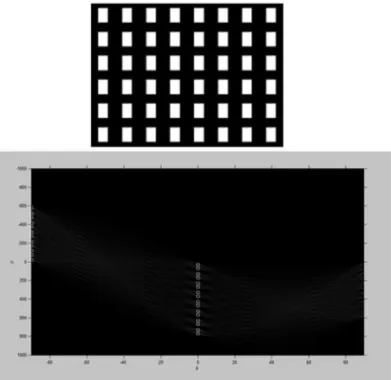
he most challenging classiication in this step is to classify between Class B and Class C, ie to classify the multiple indications into an unaligned or an aligned class. Here, the Hough transform is implemented for line detection. When looking at an image, it is a 2D or 3D matrix in spatial space. It is easy for the human eye to recognise the shapes, though relatively hard for machines. In order to overcome this problem, the Hough transform transforms an image from spatial space to perimeter space to perform particular shape detection. For example, in this paper, the algorithm is expected to detect the close parallel lines in an image. he Hough transform’s solution is to transform this image into m-c space, where m is the slope and c is the intercept. In the x-y space, the points share the same m and c values if they are on the same line. In m-c space, point (mi , ci ) stands for a line in x-y space. If the value at point (mi , ci ) in m-c space is n, that means we have n points on line (mi , ci ) in x-y space. In x-y space, we can detect the line (mi , ci ) (Equation (8)). In a real application, the diiculty lies in that m can be ininity. So, normally, Equation (9) is used to transform x-y space into a polar coordinate space: ρ-θ space, where ρ is the radial coordinate and θ
is the angular coordinate. Figure 12 shows an example of a Hough transform in detecting the long side and the short side of rectangles. In the parameter space, k highlights the points at 0º, which stands for k long side lines.
y = m ! x + c c = "m ! x + y ... (8) ! = x !cos" + y!sin" ... (9) In this paper, the aligned indications are detected by performing Hough line detection from the skeletons extracted in the previous step. By measuring the distance of points in parameter space, the closeness of two linear skeletons can be measured. For some complicated indications which have branches, the indication is divided into branches and then Hough line detection is performed. Figure 13 shows the detection of a branch with the other indications. In this sample, the branch on the top-right image is aligned with the indication at the bottom-right image.
3. Software interface and testing
results
3.1 Software interface
In order to display the testing result and aid the human inspector, a user-friendly sotware interface is designed to show the image processing procedures and classiication results (Figure 14). he interface is developed in Matlab GUIDE.
In the interface, the above-mentioned functions are integrated and the image processing, segmentation, feature extraction and classiication results are shown. On the let of the interface, the image results are shown step by step. On the top-right part of the interface, the feature extraction results are displayed, such as centre position, length and width, area, minimum enclosing rectangle, aspect ratio, perimeter and rectangularity. he bottom-right part shows the classiication results. he interface can process all the images from a given path and obtain the classiication results automatically.
Figure 11. An indication intersected with boundary of part
Figure 12. An example of Hough transform for line detection
Figure 13. Aligned indication detection: a complex case – the indication has several branches
3.2 Testing result
To test the performance of the designed AAIS, two experiments were carried out on diferent datasets. First, the algorithm was tested on 44 FPI images provided by our industrial partner and an attempt was made to ind and classify the cracks. As a result, 223 indications were correctly detected and 21 indications were not detected or incorrectly detected. Among the correctly detected indications, 211 indications were correctly classiied while 12 indications were incorrectly classiied. he inal detection rate was 91.4% and the classiication rate was 94.6%, which is comparable with a human inspector. Second, ield tests were carried out on the coupons with the same material and a similar size of defects to further validate the developed AAIS’s performance in a real situation. he samples and image processing results are shown in Figure 15. he algorithm was tested on six coupons and engine parts from our industrial partner. As a result, all the indications were correctly classiied. In terms of computational cost, usually the average detection time for a human inspector to fulill the detection of a part is 60 min. For the AAIS, the average run time is from 1 s (small defects and two or three defects) to 11 s for complicated and a greater number of defects. he computer’s coniguration is shown as: CPU intel i7 3.40 GHz and 16 GB of RAM. he test results demonstrated that the developed AAIS has signiicantly improved the eiciency of FPI in the aerospace industry.
4. Conclusion
In this paper, an AAIS for a highly eicient and accurate analysis of aircrat parts has been successfully designed. Image processing techniques are implemented to enhance green indications, smooth the image and reduce noise. he image segmentation functions combine morphological operations with the Otsu adaptive threshold method and the Canny edge detection to segment the input image. he image is separated into a background image, a foreground image and an indication bitmap image. he feature extraction function and the classiication function are developed to classify indications into two types and four classes, according to the ASTM-E433 ‘Liquid penetrant inspection’ standard. Finally, a sotware interface is designed and 44 images are tested using the AAIS. his system can aid human inspectors in performing an FPI analysis and efectively measure useful features and classify indications. he results of the advanced automatic inspection system for the FPI analysis of aircrat parts will be combined with the other NDT methods, such as ECT and UT, to further improve
Figure 15. FPI tests on coupon samples
accuracy. In future work, the developed AAIS will be tested on the FPI testing line by our industrial partners to collect more data in order to establish actual reliability and conidence values.
Acknowledgements
his work was supported by NSERC CRD, CRIAQ grant. he authors would also like to acknowledge the technical support from their industrial partners: Pratt & Whitney Canada, L-3 Communications and CNRC.
References
1. D L Davidson, ‘Gas turbine disk-blade attachment crack’, Journal of Failure Analysis and Prevention, 5 (1), pp 55-71, February 2005.
2. B Meher-Homji, ‘Detect, troubleshoot gas-turbine blade failures’, Power, 139 (12), pp 35-38, December 1995.
3. R Viswanathan, ‘An investigation of blade failures in combustion turbines’, Engineering Failure Analysis, 8, pp 493-511, 2001. 4. G Harvey and J Jones, ‘Small turbine blade inspection using
laser strain techniques’, Insight – Non-Destructive Testing and Condition Monitoring, 51 (3), pp 137-139, March 2009. 5. P J Shull, Nondestructive Evaluation: heory, Techniques and
Applications, Marcel Dekker, New York, 2001.
6. C Imbert and K Rampersad, ‘Magnetic particle testing of turbine blades mounted on the turbine rotor shat’, Journal of Testing and Evaluation (JTE), Vol 20, No 4, July 1992.
7. V V Vakhov, I B Veretennikov and V A P’yankov, ‘Automated ultrasonic testing of billets for gas-turbine engine shats’, Russian Journal of Nondestructive Testing, Vol 41, No 3, pp 158-160, 2005.
8. E Jasiūnienė, R Raišutis, R Šliteris, A Voleišis and M Jakas, ‘Ultrasonic NDT of wind turbine blades using contact pulse-echo immersion testing with moving water container’, Ultragarsas (Ultrasound), Vol 63, No 3, pp 28-32, 2008. 9. P I Beda and V M Sapunov, ‘Experience in eddy current testing
of mounting holes in aircrat components’, Russian Journal of Nondestructive Testing, Vol 36, No 4, pp 241-245, 2000. 10. R O McCary and J R M Viertle, ‘Automating an eddy current
test system for in-service inspection of turbine/generator rotor bores’, IEEE Transactions on Magnetics, Vol 24, No 6, pp 2594-2596, November 1988.
11. Y H Wu and C C Hsiao, ‘Reliability assessment of automated eddy current system for turbine blades’, Insight – Non-Destructive Testing and Condition Monitoring, Vol 45, No 5, pp 332-336, May 2003.
12. M A U Khan, ‘Non-destructive testing applications in commercial aircrat maintenance’, 7th European Conference on Non-Destructive Testing, May 1998.
13. T L Adair, D H Wehener, M G Kindrew and H I Winter, ‘Automated luorescent penetrant inspection (FPI) system is triple A’, 1998 IEEE Autotestcon Proceedings, IEEE Systems Readiness Technology Conference: Test Technology for the 21st Century, pp 498-529, 1998.
14. D Patton, G Paz-Pujalt and J Spoonhower, ‘Detecting the presence of failure(s) in existing man-made structures’, US Patent 20020146150 A1, 10 October 2002.
15. P Henrikson, ‘A method and a device for detecting cracks in an object’, US Patent 20110267454 A1, 3 November 2011. 16. P Herveand and V Prejean-Lefevre, ‘Process and apparatus for
automatically characterising, optimising and checking a crack detection analysis method’, US Patent 5570431 A, 29 October
1996. Continued on page 34
NDT IN CIVIL ENGINEERING
31. S Kose, M Guler, H U Bahia and E Masad, ‘Distribution of strains within hot-mix asphalt binders – applying imaging and inite element techniques’, Transportation Research Board, Paper No 00-1391, pp 21-27, 2000.
32. E Masad, N Somadevan, H U Bahia and S Kose, ‘Modelling and experimental measurements of strain distribution in asphalt mixes’, Journal of Transportation Engineering, Vol 127, No 6, pp 477-485, 2001.
33. E Masad, C-W Huang, G Airey and A Muliana, ‘Non-linear viscoelastic analysis of unaged and aged asphalt binders’, Construction and Building Materials, Vol 22, pp 2170-2179, 2008.
34. R Delgadillo, ‘Non-linearity of asphalt binders and their relationship with asphalt mixture permanent deformation’, PhD hesis, University of Wiscosin, Madison, 2008.
35. E T Hagos, ‘he efects of ageing on binder properties of porous asphalt concrete’, MS hesis, Technical University of Delt, he Netherlands, 2008.
36. D E Bray and R K Stanley, Non-Destructive Evaluation – A Tool in Design, Manufacturing, and Service, Revised Edition, CRC Press, New York, 1997.
37. L E Kinsler, A R Frey, A B Coppens and J S Sanders, Fundamentals of Acoustics, hird Editon, John Wiley & Sons, New York, 1984.
38. J Couchman, B Yee and F Chang, ‘Energy partitioning of ultrasonic waves beyond the critical angle lat boundaries’, Ultrasonics, Vol 12, No 2, pp 69-71, 1974.
39. M Breazeale and L Bjorno, ‘Forward and backward displacement of ultrasonic waves relected from a water-sediment interface’, Proc Ultrasonics Intern 77, IPC Science and Technology Press, pp 440-447, 1977.
40. J Couchman and J Bell, ‘Prediction, detection and characterisation of a fast surface wave produced near the irst critical angle’, Ultrasonics, Vol 16, No 6, pp 272-274, 1978. 41. L Basatskaya and I Ermolov, ‘heoretical study of ultrasonic
longitudinal subsurface waves in solid media’, Soviet Journal of Non-Destructive Testing, Vol 16, pp 524-530, 1981.
42. A Pilarski and J Rose, ‘Utility of subsurface longitudinal waves in composite material characterisation’, Ultrasonics, Vol 27, pp 226-233, 1989.
43. K Langenberg, P Fellinger and R Marklein, ‘On the nature of the so-called subsurface longitudinal wave and/or the subsurface longitudinal ‘creeping’ wave’, Research in Non-Destructive Evaluation, Vol 2, pp 59-81, 1990.
44. P Junghans and D Bray, ‘Beam characteristics of high-angle longitudinal wave probes’, NDE: Applications, Advanced Methods, and Codes and Standards, R N Pangborn (Ed), Proceedings of the Pressure Vessels and Piping Conference, Vol 216 of PVP, Vol 9 of NDE, ASME, pp 39-44, 1991.
45. T Leon-Salamanca and D Bray, ‘Residual stress measurement in steel plates and welds using critically-refracted longitudinal (LCR) waves’, Research in Non-Destructive Evaluation, Vol 7, pp 169-184, 1996.
46. D Bray and M Dietrich, ‘Stress evaluation in high-speed rotating machinery with the LCR ultrasonic technique’, Proceedings of the 26th Turbo Machinery Symposium, pp 143-149, 1997. 47. D Bray and W Tang, ‘Subsurface stress evaluation in steel plates
and bars using the LCR ultrasonic wave’, Nuclear Engineering and Design, Vol 207, pp 231-240, 2001.
48. S Chaki, W Ke and H Demouveau, ‘Numerical and experimental analysis of the critically-refracted longitudinal beam’, Ultrasonics, Vol 53, pp 65-69, 2013.
49. A F Braham, W G Buttlar, T Clyne, M Marasteanu and M Turos, ‘he efect of long-term laboratory ageing on asphalt concrete fracture energy’, Journal of the Association of Asphalt Paving Technologists, Vol 78, pp 417-454, 2009.
50. M E McGovern, B Behnia, W G Buttlar and H Reis, ‘Characterisation of oxidative ageing in asphalt concrete – Part 1: Ultrasonic velocity and attenuation measurements and acoustic emission response under thermal cooling’, Insight, Vol 55, No 11, pp 596-604, 2013.
51. M E McGovern, B Behnia, W G Buttlar and H Reis, ‘Characterisation of oxidative ageing in asphalt concrete – Part 2: Complex moduli estimation’, Insight, Vol 55, No 11, pp 605-609, 2013.
52. M Marasteanu, A Zoka, M Turos, X Li, R Velasquez, X Li, C Williams, J Bausano, W Buttlar, G Paulino, A Braham, E Dave, J Ojo, H Bahia, A Gallistel and J McGraw, ‘Investigation of low-temperature cracking in asphalt pavements’, Report No 776, Minnesota Department of Transportation, Research Services MS 330, St Paul, MN 55155, USA, 2007.
Continued from page 24
Design of an advanced automatic inspection
system for aircraft parts based on luorescent
penetrant inspection analysis
J Zheng, W F Xie, M Viens, L Birglen and I Mantegh 17. G W Budd, ‘Surface inspection technology for the detection
of porosity and surface imperfections on machined metal surfaces’, US Patent 7394530 B2, 1 July 2008.
18. R C Gonzalez, Digital Image Processing, hird Edition, Publishing House of Electronics Industry, China, 2011. 19. S Nashat, A Abdullah and M Z Abdullah, ‘A robust crack
detection method for non-uniform distributions of coloured and textured image’, IEEE International Conference on Imaging Systems and Techniques, pp 98-103, May 2011.
20. X H Liu, L Xu, C J Xiao, M J Cao and J Xiao, ‘Identifying the crack of silicon solar cells based on Matlab image processing’, Journal of Shanghai Jiaotong University, 44 (7), pp 925-929, July 2010. 21. G Wang and T W Liao, ‘Automatic identiication of diferent
types of welding defects in radiographic images’, NDT&E International, 35, pp 519-528, 2002.
22. Y Tian, D Du, G R Cai, L Wang and H Zhang, ‘Automatic defect detection in X-ray images using image data fusion’, Tsinghua Science and Technology, 11 (6), pp 720-724, December 2006. 23. N Otsu, ‘A threshold selection method from grey-level
histograms’, IEEE Transactions on Systems, Man and Cybernetics, 9 (1), pp 62-66, 1979.
24. ASTM E433-71, ‘Standard reference photographs for liquid penetrant inspection’, 2003.
25. ASTM SE-165, ‘Methods for liquid penetrant examination’. 26. H Mu, L Li, L Yu, M Zhang and D Qi, ‘Detection and
classiication of wood defects by ANN’, Proceedings of the 2006 IEEE International Conference on Mechatronics and Automation, pp 2235-2240, June 2006.
27. S K Ho, R M White and J Lucas, ‘A vision system for automated crack detection in welds’, Meas Sci Technol, 1, pp 287-294, 1990. 28. Y L Luo, P S Qu and W H Dong, ‘Fault diagnosis of aero engine
based on digital image processing’, Control and Decision Conference 2008, pp 3572-3575, 2008.