HAL Id: tel-03168259
https://tel.archives-ouvertes.fr/tel-03168259
Submitted on 12 Mar 2021
HAL is a multi-disciplinary open access
archive for the deposit and dissemination of sci-entific research documents, whether they are pub-lished or not. The documents may come from teaching and research institutions in France or abroad, or from public or private research centers.
L’archive ouverte pluridisciplinaire HAL, est destinée au dépôt et à la diffusion de documents scientifiques de niveau recherche, publiés ou non, émanant des établissements d’enseignement et de recherche français ou étrangers, des laboratoires publics ou privés.
Luis Estevez Bauluz
To cite this version:
Luis Estevez Bauluz. Three Essays on the Long-term Accumulation of Wealth. Economics and Finance. Université Paris sciences et lettres, 2018. English. �NNT : 2018PSLEH137�. �tel-03168259�
THÈSE DE DOCTORAT
de l’Université de recherche Paris Sciences et Lettres
PSL Research University
Préparée à l’Ecole des hautes études en sciences sociales
Three Essays on the Long-term Accumulation of Wealth
Trois Essais sur l’accumulation de la richesse à long terme
Soutenue par Luis
ESTEVEZ
BAULUZ
le 28 novembre 2018
h
COMPOSITION DU JURY :
M. SCHULARICK Moritz
Université de Bonn, Rapporteur
M. ZUCMAN Gabriel
UC Berkeley, Rapporteur
M. ALVAREDO Facundo
EHESS - PSE, Membre du jury
M. MONNET Éric
Banque de France - PSE, Membre du jury
M. PIKETTY Thomas
EHESS - PSE, Membre du jury
M. PRADOS DE LA ESCOSURA Leandro
Université Carlos III de Madrid, Membre du jury
Ecole doctorale
n°
286ECOLE DOCTORALE DE L’EHESS
Spécialité
Sciences Économiques
Dirigée par Thomas PIKETTY
Codirigée par Facundo ALVAREDO
Acknowledgements
This thesis has been possible thanks to many people that have accompanied and supported me throughout these years.
I would like to warmly thank Thomas Piketty. He has been an excellent director, always available, patient and supportive. His approach to doing research, rigorous and centered in having clear the fundamental facts around any topic analyzed, has been a great influence for me. I would also like to express my great gratitude to Facundo Alvaredo, who has always followed me closely and guided me in any aspect related with my thesis. I further thank my co-authors Miguel Artola Blanco and Clara Martínez-Toledano. Working together has been a truly enriching experience and this thesis would have not been completed without them. This thesis owes a lot to numerous exchanges with other researchers and students, Vanda Almeida, Brais Álvarez, Thomas Blanchet, Eva Benages, Asma Benhenda, Paul Brandily, Alejandro Buesa, Andrea Camilli, Felipe Carozzi, Emma Duchini, Gabrielle Fack, Martín Fernández Sánchez, Nacho Flores Beale, Sebastián Franco, Laurent Gobillon, Nacho González, Crisitina Herghelegiu, Miren Lafourcade, Clément Malgouyres, Éric Monnet, José Montalbán, Héctor Moreno, Filip Novokmet, Jorge Onrubia, Cem Özgüzel, Rosa Sanchís-Guarner, Aurélie Sotura, Lennart Stern, Leandro Prados de la Escosura, Moritz Schularick, Clementine Van Effenterre, Daniel Waldenström, Li Yang, Gabriel Zucman and numerous individuals from the World Inequality Lab and the Paris School of Economics. I am particularly grateful to Sylvie Lambert for her support and attention at different stages of my time at PSE, as well as to Weronika Leduc, Pauline Marmin and Véronique Guillotin for their assistance and competence. Thanks also to the administrative team, students and professors of the EUI for welcoming me as a visiting student and offering excellent research conditions and a vibrant environment to further develop my studies. Special acknowledgments go to Abelardo Fernández Bagues, Juan José Dolado and José Manuel Campa. Deciding to pursue a research career has been, to a large extent, thanks to their encouragement in my initial years as a student.
Finally, I thank my family and friends, for their unconditional support and patience. Special thanks go to David, Lobo, Elsa, Pati, Sebas, María, Emma and Ana. Without their support this thesis would have been simply not possible.
Table of contents
Acknowledgements . . . vi
Main Introduction 2 1 Wealth in Spain, 1900-2017: A Country of Two Lands 11 Introduction . . . 13
1.1 Literature Review . . . 15
1.1.1 Long-run evolution of national wealth . . . 15
1.1.2 Determinants of the increase in housing prices since the late nineties . . 18
1.2 Concepts, methodology, and empirical estimate . . . 19
1.2.1 Non-financial assets . . . 24 1.2.2 Financial assets . . . 26 1.3 Results . . . 29 1.3.1 Personal wealth . . . 29 1.3.2 Public wealth . . . 32 1.3.3 National wealth . . . 33
1.4 International capital flows, credit standards, and housing prices . . . 37
1.5 Conclusion . . . 43
Tables and Figures . . . 45
Appendix . . . 67
A Introduction . . . 67
B Domestic assets . . . 71
C Personal wealth . . . 83
D General Government wealth . . . 106
E Corporate wealth . . . 112
F Foreign wealth . . . 115
G Income and savings . . . 117
H Decomposition of wealth accumulation . . . 120
I Robustness checks . . . 124
J Appendix figures and tables . . . 132
2 From Manufacturing to Services: The impact of Structural Change on the value of Housing 153 Introduction . . . 155
2.1 New stylized facts . . . 158
2.1.1 Structural change and spatial concentration . . . 159
2.1.2 Housing: land vs structure decomposition . . . 163
2.2 Model . . . 167
2.2.1 Setup . . . 169
2.2.2 Equilibrium . . . 172
2.2.3 Comparative statics: negative labor demand shock in city a . . . 173
2.2.4 The role of aggregate concentration . . . 176
2.3 Local house-income ratios in England and Wales . . . 177
2.3.1 Descriptive analysis . . . 180
2.3.2 Regression analysis . . . 181
2.4 Conclusion . . . 185
Tables and Figures . . . 187
Appendix . . . 214
A Introduction . . . 214
B Value added and population data . . . 214
C Definitions of urban areas . . . 219
D National housing wealth decomposition: land vs structure . . . 222
E Cross-country fixed-effects regressions . . . 224
F Local house prices in England and Wales . . . 226
3 Revised national income and wealth series: Australia, Canada, France, Ger-many, Italy, Japan, UK and USA 229 Introduction . . . 231
3.1 Conceptual differences between old and new series at WID.world: R&D, natural capital and national housing . . . 232
3.1.1 Research and development . . . 232
3.1.2 Natural capital . . . 234
3.1.3 National housing . . . 236
3.2 New results: comparing the old and the new series . . . 237
3.2.1 Macro wealth . . . 237
3.2.2 National income: capital-labor shares . . . 238
3.3 Splicing procedure and country specific notes . . . 239
3.3.1 Australia . . . 240 3.3.2 Canada . . . 243 3.3.3 France . . . 247 3.3.4 Germany . . . 251 3.3.5 Italy . . . 258 3.3.6 Japan . . . 263 3.3.7 United Kingdom . . . 269 3.3.8 United States . . . 277
Tables and Figures . . . 279
References 327
List of tables 353
Main Introduction
Until recent years, national wealth was displaced from the center of macroeconomic analysis. Instead, the main focus of the profession was on real income growth and its fluctuations. It can be argued that two factors influenced this emphasis: i) The macroeconomics discipline itself developed during the decades following the World War II – years that were characterized by an intense growth in incomes per capita and the decline of the rentier society in Western countries; ii) Some limited evidence suggested the constancy of wealth-income ratios over the path of development (Kaldor(1961)). As a result, not only the economics profession but also national statistical agencies and the international system of national accounts (SNA), did not develop tools to measure countries’ wealth in a systematic manner until recently (SNA-93; SNA-2008).
Yet, wealth is gaining an increasing attention from both the academic community and the public opinion. Wild swings in asset prices, the significance of cross border positions and the global increase in inequalities –to name just three recent significant economic trends– point to the importance of studying wealth aggregates. Thus, constructing and strengthening national wealth statistics based on sectoral balance sheets has being the object of an increasing concern from various institutions ((Financial Stability Board and International Monetary Fund, 2009, pg. 8)). Moreover, Piketty and Zucman (2014a) work has attracted renewed attention on the importance of understanding the evolution of wealth. Using long-run data for a number of rich countries, they show that the relation between wealth and income is not constant over time. On the contrary, wealth-to-income ratios followed a strong U-shaped evolution over the twentieth century, most prominently in Europe1. Furthermore, the decomposition of national
wealth into different assets (financial assets, natural resources, physical capital) and owners (private, public, foreigners) reveals a profound transformation of productive systems and of
the institutions involved in countries’ development.
These results have had a strong impact on how we understand the economic transformation of advanced countries and have incentivized a fast-growing literature on the long-term dynamics of national wealth, essentially along two areas. On the one hand, new research has emerged to analyze the historical evolution of wealth in countries different to those analyzed by Piketty and Zucman(2014a):Waldenström (2017) tracks the evolution of wealth since 1810 in Sweden,
Orthofer (2015) analyzes South African wealth since 1975,Charalampidis (2016) the national wealth in Greece,Piketty, Yang, and Zucman (2017) study China’s wealth, Novokmet (2017) wealth in the Czeck Lands, Novokmet, Piketty, and Zucman(2018) track the evolution of wealth in Russia, and ? studies national wealth in India. On the other hand, a number of studies focuses on the drivers of the upsurge of wealth-income ratios over the last decades. In particular, a single asset, namely housing, seems responsible for a large part of the recent rise of wealth-income ratios ((Piketty and Zucman,2014a, table II);Bonnet, Bono, Chapelle, Wasmer, et al. (2014);Rognlie (2014)), thus requiring specific attention (Borri and Reichlin
(2018); Grossman and Steger (2017);Knoll, Schularick, and Steger (2017)).
This dissertation builds on this literature and presents three empirical investigations to shed light on the previous issues: chapter 1 investigates the long-run evolution of wealth in Spain, chapter 2connects the upsurge in housing wealth with the transformation of the productive system, and chapter 3 revises and extends the empirical work of Piketty and Zucman (2014a) in light of the most recent accounting standards.
The first chapter is a joint work with Miguel Artola Blanco and Clara Martínez-Toledano, and tracks for the first time the historical evolution of Spanish national wealth since the beginning of the twentieth century. The aim is to analyze and document the long-term
national wealth in the richest European countries and USA during the 18th, 19th and early 20th centuries. Although the central decades were characterized by a lack of these types of studies, there were some notable efforts to asses the evolution of wealth. Among these stands the research pioneered by Raymond W. Goldsmith, who carefully reconstructed the national wealth of the USA (Goldsmith (1955); Goldsmith, Lipsey, and
dynamics of wealth, with a particular focus on the evolution and determinants of the recent housing boom and bust. We present two long-run series. The first, based on a market value approach, provides the net wealth for the personal and government sector following a census method. We construct a complete and detailed balance sheet including non-financial, financial and offshore assets. The second consists in a book value approach, in which national wealth is derived by calculating the value of domestic produced assets through the perpetual inventory method, non-produced assets through a census-like method, plus the net foreign position. One of the advantages of this last approach is that it allows to decompose housing wealth into buildings and underlying land, which is key to understand the forces driving up the value of dwellings in the last decades. Furthermore, we decompose the accumulation of national wealth into a volume effect (through savings) and a price effect (capital gains/losses), but we go beyond previous studies and differentiate between accumulation in housing and non-housing assets. To our knowledge, this is the first study comparing the evolution of both measures of national wealth for a period covering more than a century.
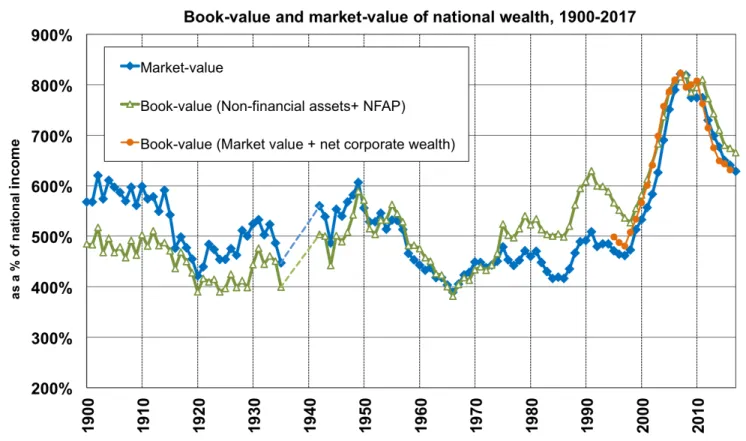
The key result is that Spain has followed a J-shaped evolution in its national wealth-to-income ratio during the twentieth century that differs from the U-shaped trends observed in other developed countries (Piketty and Zucman(2014a), Waldenström (2017)). Both the market and book value national wealth to income ratios of Spain stood for most of its history in a relatively close range (between 400 and 600%) until the housing boom of the early 2000s led to an unprecedented rise to almost 800% in 2007. In this manner, Spain’s national wealth to income ratio was the highest of all countries with available records in the early twenty-first century. What makes Spain different?
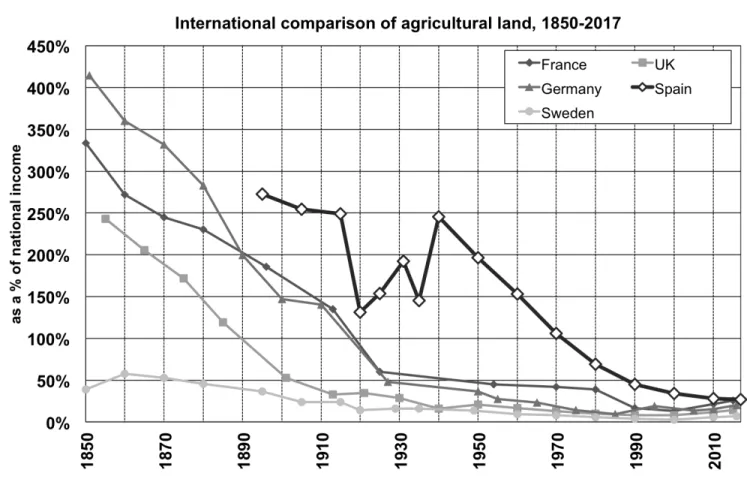
First, we document that the shift from high agricultural land value to high urban value, which happened in other advanced countries, was particularly fast in Spain. Agricultural land constituted the most important wealth component in the early twentieth century, and urban land value became so in the early twenty-first century. Second, Spain was heavily dependent on foreign finance since the late nineties. In fact, its net foreign asset deterioration was the largest among developed countries, even surpassing the US levels. Third, we also present
evidence that in Spain, contrary to other rich countries, capital gains based on a sustained increase in the relative price of assets were fundamental for wealth accumulation during the very long term, especially since the 1950s. Our results point to housing as the most important driver, accounting for 83% of total capital gains over the 1950-2010 period. Finally, we explore the role played by immigration in explaining the sharp rise in the value of urban land during the 2000s using our new series of housing wealth decomposed between land and structure. Our results show that immigration explains 46% of the increase in urban land over the period 2001-2012 and approximately one half of capital gains.
The second chapter investigates the upsurge in housing wealth-to-income ratios by focusing on a different channel to those previously investigated by the academic literature: the change in the productive system experienced by rich countries, from manufacturing-oriented economies towards service-intensive ones. I hypothesize that rising housing values are the result of combining two factors. First, structural change may have led to higher regional concentration of economic activity over few places, due to the trend for services to locate together and for manufacturing to disperse (Desmet and Rossi-Hansberg (2009);Desmet and Rossi-Hansberg
(2014)). Second, I observe that structural change accelerates when manufacturing-specialized regions are exposed to international competition (Coricelli and Ravasan (2017); Święcki
(2017)). With service-cities depending more on location than on traditional capital for their productive activities (Baldwin (2017)), when manufacturing regions decline this may lead to a fast appreciation of house prices in service-successful ones. While these two factors are not necessarily exclusive, both focus on different aspects: the first one on the national concentration of economic activity, the second one on the decline of manufacturing regions and the emergence of service ones (irrespective of how aggregate concentration is). Therefore, I investigate the two separately. By contrast with previous research, I bring in new data, in addition to using theory, to explore the structural change hypothesis.
This second chapter is structured in three parts. In the first part, I investigate the link between the evolution of housing wealth and the concentration of economic activity in seven rich and regionally large economies: France, Italy, Germany, UK, Spain, USA and Japan. I do
this by establishing a new set of stylized facts, which I then connect between them. I start by asking whether the rise of housing wealth is driven by higher urban land values or larger quantity of dwellings. While this is a relevant question to any theory dealing with the rising value of housing, no previous research has shown this decomposition from a cross-country perspective. I find that, indeed, the observed increase in housing wealth since 1970 is largely the result of higher land values. This is consistent with Knoll, Schularick, and Steger (2017), where they focus on house prices (and not on the combination of prices and quantities) and find that the appreciation of these prices over the last decades was largely the result of more expensive urban land.
As a second stylized fact, I compare the regional concentration of economic activity across these seven countries, using definitions of urban areas that are comparable across them. I find that, in most countries, regional concentration of economic activity increased over the last decades, and that this was, to a large extent, because market-oriented services concentrated more, with manufacturing showing the opposite pattern. Yet, this evolution was not homogeneous across countries. In particular, those countries with a more monocentric structure (i.e. France, UK or Spain) saw larger increases in regional concentration than those with a more polycentric one (i.e. Germany or the USA). Interestingly, those countries that concentrated more also increased their housing-income ratios by more. This result is fully consistent with the theoretical argument (higher regional concentration leading to higher demand for housing over few places, hence raising housing values) and is statistically supported by a set of cross-country fixed-effects regressions.
The second part of the project is a theoretical exercise to shed light on the two factors investigated. To do this, I adapt Moretti (2011)’s spatial equilibrium model of the labor and the housing markets to account for two stylized facts: i) The decline of manufacturing regions and the emergence of service ones; ii) The rise of housing prices (or rents) at a faster pace than incomes. Once I adapt Moretti’s model to have cities specialized in services and manufacturing, a negative shock to the manufacturing region produces an increase in local housing rents-to-wages (a proxy for housing-income ratios) that is substantially stronger in
my model when compared to a similar shock in the original version of Moretti. I also discuss how to interpret the model to account for the main finding in part I: that those countries that concentrated more also increased their house-income ratios by more.
The third part of the project explores, empirically, the second factor: the decline of manufacturing regions and its impact on local house-income ratios (both in manufacturing and service cities). To do this I use a panel of 62 urban areas in England and Wales with annual data between 1995 and 2015. To the best of my knowledge, this is the first study exploring how macro trends in house-to-income ratios emerge from the local level. I find that the national increase in the house-to-income ratio over this period was characterized by an important upswing in the dispersion of house prices across cities (with the variation of incomes per capita rising much more moderately). Using a descriptive approach, I find that the best predictor of how house prices grew across cities is the local specialization of urban areas, with manufacturing cities showing lower increases in house prices. I then test the prediction of the model and analyze how the aggregate decline in manufacturing value added had a differential impact on local house prices, comparing manufacturing regions with service ones. I estimate that around one quarter of the dispersion in house price growth between these regions is explained by structural change.
The third chapter has a methodological focus. In light of the latest accounting standards, I update the wealth and income macro series used in Piketty and Zucman (2014a), which correspond with eight countries: Australia, Canada, France, Germany, Italy, Japan, UK and USA. All series in Piketty and Zucman (2014) ended in 2010 and followed the 1993 international accounting guidelines2. However, since the publication of their paper most countries have adapted the latest system of national accounts (SNA-2008), which incorporates conceptual corrections to the treatment of some assets. Notably, Research and Development –an important component in today’s knowledge economies– was not previously considered as an asset but this has changed in the latest accounts. Furthermore, since the writing of Piketty and Zucman (2014a)’s paper, the World Inequality Database (WID.world) has evolved in
2. The only exception is Australia, which has already adapted to the latest SNA-2008 standards by the time in which Piketty and Zucman(2014a) wrote their paper.
a unified framework to compute macro wealth accounts across countries. Besides adopting the latest SNA guidelines, WID.world presents two main novelties: the inclusion of natural capital (i.e. forestry land, mineral and energy resources) within the concept of national wealth and the differentiation of housing owned by other sectors than households, in an attempt to measure national housing wealth in addition to privately-owned one.
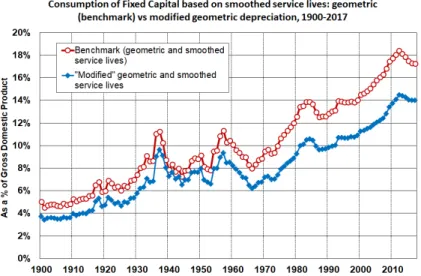
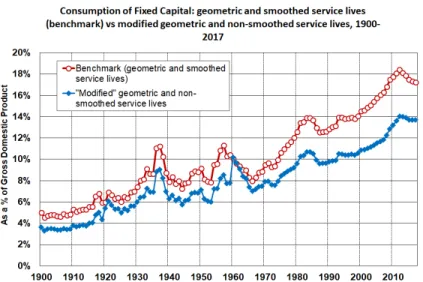
I show that adopting the new SNA does not change in a significant way previous estimates of national wealth. However, when looking at incomes, I find suggestive evidence pointing to an increase in gross capital income due to R&D being recognised as capital investment. Yet, given the high rates of depreciation of R&D assets, net capital investment and net capital incomes do not seem affected by this change in a significant manner. Natural resources, however, do affect significantly the values of national wealth given the large volume of these assets in certain countries (i.e. Australia or Canada). I highlight the uneven progress made by official statistics to estimate in a consistent manner the value of natural capital, with this being an area that requires further attention, both from academics and official statisticians. As for national housing wealth, series show the limited importance of other sectors than the private, but this weight varies across countries and over time. In particular, up to 20% of national housing is not privately-owned in countries like France or Germany, with the non-private involvement in housing markets declining in recent decades. This evolution is in line with some common policies followed by public sectors of advanced economies since the eighties (i.e. the trend for privatizing publicly-fostered dwellings).
All in all, this thesis highlights the fundamental role of wealth to understand the long-term transformation of countries. It underlines the complex nature of the wealth accumulation process, characterized by various forces (different types of investment, swings in asset prices, policies shaping asset markets, etc.), and the need for a better measurement of national wealth aggregates, still an area where national accounts can make important progress.
Chapter 1
Wealth in Spain, 1900-2017: A
Country of Two Lands
1
1. This chapter is based on a joint work with Miguel Artola Blanco and Clara Martínez-Toledano. We thank Facundo Alvaredo, Carlos Barciela, Eva Benages, Thomas Blanchet, Olympia Bover, Juan Carmona, Francisco Comín, Vicent Cucarella, Stefan Houpt, Elena Martínez, Jorge Martínez, Enrique Martínez-García, Pedro Pablo Ortúñez, Leandro Prados de la Escosura, Thomas Piketty, Daniel Waldenström, and Gabriel Zucman for their helpful comments, as well as participants at the 7th meeting of the Spanish Economic History Association and seminars at Paris School of Economics, London School of Economics, European University Institute, 16th Trento Summer School, University of Zaragoza, Macrohistory Lab Bonn and IVIE. We acknowledge financial support from INET, ESRC-DFID (grant ES/I033114/1), and the European Research Council (grant 340831). Luis Estévez Bauluz acknowledges financial support from Fundación Ramón Areces and Clara Martínez-Toledano acknowledges financial support from Fundación Ramón Areces and Bank of Spain at different stages of the project.
Abstract
This study reconstructs Spain’s national wealth from 1900 to 2017. Combining new sources with existing accounts, we estimate the wealth of both private and government sectors and use a new asset-specific decomposition of the long-run accumulation of wealth. We find that the national wealth to income ratio stood during the 20th century in a relatively close range -between 400 and 600%- until the housing boom of the early 2000s led to an unprecedented rise to 800% in 2007. Our results highlight the importance of land, housing capital gains and international capital flows as key elements in the accumulation of wealth.
JEL codes: D3, E2, F3
Keywords: Wealth-income ratios; Historical balance sheets; Housing; Net foreign assets; Economic development.
Introduction
Wealth is gaining increasing attention from both the academic community and public opinion. Wild swings in asset prices, the significance of cross-border positions within the Euro area and the global increase in inequalities–to name just three recent significant eco-nomic trends–point to the importance of studying wealth aggregates. Thus, constructing and strengthening national wealth statistics based on sectoral balance sheets has been the object of increasing attention from various institutions (Financial Stability Board and Inter-national Monetary Fund (2009), p8). In this sense, Spain is a country that clearly deserves internationally scholarly attention. Since entering the Eurozone in the late 1990s, the Spanish economy underwent a large housing bubble followed by an equally huge bust. The country also experienced a sharp deterioration in its net foreign asset position and a more recent rise in public indebtedness. Although academics and the media have been quick to analyze this process, the truth is that many studies are limited by the lack of a complete set of national balance sheets. Additionally, the absence of long-run series makes it more difficult to determine the historical significance of recent developments.
This study tracks for the first time the historical evolution of Spanish national wealth since the beginning of the twentieth century. The aim is to analyse and document the long-term dynamics of wealth, with a particular focus on the evolution and determinants of the recent housing boom and bust. We present two long-run series. The first, based on a market value approach, provides the net wealth for the personal and government sector following a census method. Following this approach, we construct a complete and detailed balance sheet including non-financial, financial and offshore assets. The second consists in a book value approach, in which national wealth is derived by calculating the value of domestic produced assets through the perpetual inventory method, non-produced assets through a census-like method, plus the net foreign position. One of the advantages of this last approach is that it allows to decompose housing wealth into buildings and underlying land, which is key to understand the forces driving up the value of dwellings in the last decades. To our knowledge, this is the first study
comparing the evolution of both measures of national wealth for a period covering more than a century. Furthermore, we decompose the accumulation of national wealth into a volume effect (through savings) and a price effect (capital gains/losses), but we go beyond previous studies and differentiate between accumulation in housing and non-housing assets.
Our main finding is that Spain has followed a J-shaped evolution in its national wealth-to-income ratio during the twentieth century that differs from the U-shaped trends observed in other developed countries (Piketty and Zucman (2014a),Waldenström (2017)). Both the market and book value national wealth to income ratios of Spain stood for most of its history in a relatively close range -between 400 and 600%- until the housing boom of the early 2000s led to an unprecedented rise to almost 800% in 2007. In this manner, Spain’s national wealth to income ratio was the highest of all countries with available records in the early twenty-first century. The singular evolution of wealth in Spain is explained by different peculiarities.
First, we document that the shift from high agricultural land value to high urban value, which happened in other advanced countries, was particularly fast in Spain. Agricultural land constituted the most important wealth component in the early twentieth century, and urban land value became so in the early twenty-first century. Second, we also present evidence that in Spain, contrary to other rich countries, capital gains based on a sustained increase in the relative price of assets were fundamental for wealth accumulation during the very long term, especially since the 1950s. Our results point to housing as the most important driver, accounting for 83% and 86% of total capital gains over the 1950-2017 and 1980-2017 period, respectively. Third, Spain was heavily dependent on foreign finance since the late nineties, namely, its increase in net foreign liabilities was the largest among developed countries. We present new empirical evidence that illustrates how the private sector contributed to the large fall in net foreign assets, most importantly through the issuance of debt securities by Spanish monetary institutions. This process in turn fostered an increase in household indebtedness and an unprecedented housing boom. We carry an empirical analysis that supports the hypothesis that international capital flows where significantly related to house prices in Spain during the 2000s even when controlling for financial conditions, most importantly falling interest
rates and a relaxation of credit standards. Hence, together with changing demographics and monetary policy, access to international credit by Spanish credit institutions seems to have played a significant role on the evolution of the real estate market in Spain.
The rest of the paper proceeds as follows. Section II discusses previous research on other countries and Spain. In Section III, we briefly introduce the key concepts, methods, and sources employed. Section IV presents the most important long-term trends in the evolution of wealth aggregates and puts the Spanish case in an international perspective. In Section V we carry a quantitative analysis that relates foreign capital flows with the growth in household credit and the evolution of the real estate market. Finally, Section VII concludes. Appendix A and B provide all figures and tables, respectively. The paper has a companion methodological appendix ("Spain Wealth Appendix") and the complete set of results is provided in an Excel file ("Spain Wealth Database").
1.1
Literature Review
1.1.1
Long-run evolution of national wealth
The study of wealth based on the national accounts framework is a relatively new phenome-non. The 1993 U.N. System of National Accounts (SNA) first introduced an international set of guidelines to compute national wealth through an estimation of sectoral balance sheets, which include all assets and liabilities2. Since then, statistical offices in most advanced economies
and a few developing countries have produced comprehensive wealth estimates. Progress is still uneven, with some countries providing a very complete and long set of national balance sheets, while others offering only partial results.
This slow development occurred despite research on wealth gaining an increasing interest among scholars and the public. One major stimulus has come through the study of the
2. The SNA-1993 (Commission of the European Communities and Inter-Secretariat Working Group on
National Accounts (1993)), was subsequently revised in the SNA-2008 (United Nations et al. 2009). The
European Union adapted these accounting standards by creating ESA-1995 (European Union(1996)) and ESA-2010 (European Union(2013)).
evolution, composition, and distributional patterns of household wealth. Davies, Sandström, Shorrocks, and Wolff (2011) estimated household wealth for 39 economies for 2000, using sectoral balance sheets and survey data, which was extended to 2000-2016 using the Global Wealth Report series edited by Shorrocks, Davies, and Lluberas (2015). The other major impetus in wealth research has come through the workPiketty(2014) andPiketty and Zucman
(2014a). Piketty and Zucman(2014a) presented a new study on the long-term dynamics of the wealth-to-income ratios for a set of advance countries adopting the modern SNA guidelines with previous contemporary estimates. Their key finding is that the relationship between wealth and income has not been stable over time. On the contrary, wealth-to-income ratios followed a strong U-shaped evolution over the twentieth century, most prominently in Europe.
Together, these results have had a strong impact on how we understand the economic transformation of advanced countries, and incentivized researchers to reconstruct the dynamics of national wealth in other countries taking a long-term perspective. We are aware of the reconstruction of the Swedish national wealth since 1810 (Waldenström (2017)), an analysis of South Africa since 1975 (Orthofer (2015)), a study on the national wealth of Greece (Charalampidis (2016)), a study of China’s wealth (Piketty, Yang, and Zucman (2017)) and
another study on the national wealth in India (Kumar(2018)).
International scholars analyzing wealth normally point to Spain as a missing case ( Gold-smith (1985), Piketty and Zucman (2014a)), although in truth, there are some existing relevant studies. First, some tentative estimates were made at the beginning of the twentieth century (for example, Barthe (1917), Banco Urquijo (1924),Vandellós (1925)), although as
Velarde Fuertes (1968) already pointed out, these results are plagued by important inaccu-racies and generally lacked methodological rigor. Second, when Spain started to develop its national accounts, a group of researchers at the Universidad de Deusto (1968) conducted an impressive wealth census for 1965 that covered all non-financial assets (agricultural land, livestock, housing, business assets, consumer durables, etc.) in great depth. Each asset class was studied by a group of scholars, who used various calculation procedures, such as the perpetual inventory method, multiplying wealth quantities by market prices or updating
production costs by considering capital depreciation and changes in asset prices. Goldsmith
(1970) argued that it would have been preferable to use a more precise and uniform method, although all researchers have since agreed that the University of Deusto’s estimates are broadly reliable ((Carreras, Prados de la Escosura, and Rosés, 2005, p1317)).
Since the 1980s, the literature on Spain has grown impressively. On the one hand, a set of academics have developed new series for the capital stock based on the modern procedures of the perpetual inventory method. The first studies following a long-term approach were conducted by Myró (1983) and Cubel Montesinos and Palafox (1997), which have been recently complemented by a more precise analysis by Prados de la Escosura and Rosés (2010). Similarly, researchers of the Ministry of Finance and the IVIE made a very detailed estimation of the capital stock since 1964 (Dabán Sánchez, Escribá Pérez, Murgui García, and Díaz
(2002), Mas Ivars, Perez García, and Uriel Jiménez (2015)), while Mas Ivars, Pérez García, Uriel Jiménez, Benages Candau, and Cucarella Tormo (2015)’s study of public capital starts in 1900. Although these works provide an invaluable point of reference, none actually refers to the wealth of the country, as non-produced assets (i.e., land and subsoil assets) are excluded by definition. Additionally, these studies do not consider foreign wealth.
The other major development occurred in the mid-1980s after the Bank of Spain started to develop a modern system of financial accounts that records all financial assets and liabilities. This set of results later incentivized the development of some complementary sources on wealth aggregates, such as various estimates of the value of residential buildings and the creation of the Survey of Household Finances in 2002. Using these records,Naredo, Carpintero, and Marcos (2008) built the first comprehensive balance sheet for the different institutional sectors in Spain from 1995 to 2007. However, as we detail in the following section, some assets–most importantly, dwellings–are substantially overvalued. Our study aims to provide more precise estimates and to extend the series to the beginning of the twentieth century.
1.1.2
Determinants of the increase in housing prices since the late
nineties
The recent rise in wealth-income ratios has been mostly related to the increase in housing assets ((Piketty and Zucman, 2014a, Table II)), thereby deserving specific attention (Rognlie
(2014),Bonnet, Bono, Chapelle, Wasmer, et al. (2014), Grossman and Steger(2017)). This literature connects with the scholars’ increasing interest on rising house prices (Mankiw and Weil (1989), Favara and Imbs (2015), Saiz (2010), Glaeser, Gyourko, and Saks (2005),
Gyourko, Mayer, and Sinai (2013)). Academics have also started to analyse the long-term evolution of housing markets, an area which had been neglected for long. Davis and Heathcote
(2007) carried a pioneering study that tracked the long-run value of dwellings in the US by decomposing it into land and structure. More recently, Knoll, Schularick, and Steger (2017) have documented the long-term evolution of house prices in 14 countries, showing that land prices are the key factor to understand these dynamics.
Still, the main debate concerns explaining the most recent rise in housing prices. Scholars have pointed to different mechanism, and many seem to apply to the Spanish housing bubble of the 1999-2007 years. A first strand of the literature has focused on the positive impact of population increases on housing prices (Mankiw and Weil (1989), Combes, Duranton, and Gobillon (2018)). In Spain, the increase of the foreign-born population (from 2% of the working-age population in 2000 to 14% in 2008) seems as one of the principal causes behind the increase in housing prices. Gonzalez and Ortega (2013) and Sanchis-Guarner
(2017) quantify this effect and find that between one third and one half of the increase in house prices during the 2000s is explained by foreigners arriving to Spain.
A second set of scholars have related changes in the credit market -through loose monetary conditions and soft lending standards- with the housing bubble. For example,Jordà, Schularick, and Taylor (2015) show the causal relationship between loose monetary conditions and the rise in housing prices through the expansion in mortgage credit. The authors argue that Spain during the 2000s is a good case study to analyse, given the significant difference between the
Taylor rule policy rate and the actual interest rate set by the ECB.Jiménez, Ongena, Peydró, and Saurina(2012) andAkin, Montalvo, Villar, Peydró, and Raya(2014) also present evidence of too soft lending standards and excessive risk-taking by financial institutions during the Spanish housing bubble.
Following a different perspective, other scholars have emphasized the importance of foreign capital flows and housing booms (Sá, Towbin, and Wieladek (2014)). Research has been especially prominent in the USA (Bernanke (2005), Himmelberg, Mayer, and Sinai(2005),
Favilukis, Kohn, Ludvigson, and Van Nieuwerburgh (2012), Ferrero (2015)), but more limited in European countries. Most analysis for the eurozone point to current account imbalances (Belke and Dreger (2011)), and the relationship between debt inflows and domestic credit growth (Hale and Obstfeld (2016), Lane and McQuade (2014)). However, the literature for Europe fails to analyze the impact on housing prices. In Spain,Fernández-Villaverde, Garicano, and Santos(2013) point that, as the country adopted the euro, it received large flows of capital that prompted a credit bubble and delayed the implementation of necessary economic reforms. In a similar manner, Jimeno and Santos (2014) argue that inflows of foreign capital made the Spanish economy more dependent upon non-tradable activities (construction, low-skill services, etc.), small-firms with low productivity potential, and a banking system that, due to its relative large size, was increasing the speculative cycle in real estate. Nonetheless, these studies only briefly document the importance of capital flows without carrying a detailed analysis of the channel nor quantifying its importance. In section V we build upon the work carried by this last group of scholars and carry a descriptive and quantitative analysis that relates foreign capital flows with the growth in household credit and the evolution of the real estate market.
1.2
Concepts, methodology, and empirical estimate
In this study, we use the concepts of national income and wealth from the international system accounts (SNA 2008, ESA 2010). Wealth is calculated by providing, for a particular
point in time, a balance sheet that records the value of assets economically owned and liabilities owed by an institutional unit or group of units at prevailing market prices. At the country level, national wealth can be defined by two related but different measures. The first follows what Piketty and Zucman (2014a) call the "market value of wealth", which sums personal and government net wealth. In this definition, corporate capital is mostly captured by the market value of equity holdings owned by households and the government. This approach differs from SNA standards, referred to by Piketty and Zucman as the "book value of wealth", which is the sum of the non-financial assets of all domestic sectors and all resident sectors plus net foreign wealth. Given that net foreign wealth is the sum of financial assets net of the liabilities of the three resident sectors, then the difference between both definitions can be traced to the corporate sector. The distinction between the two definitions is corporate wealth (or residual corporate wealth), which is the difference between corporations’ book value of equity and its market value.. Hence, both definitions converge when corporate wealth is zero, or, similarly, when Tobin’s Q equals one.
Wealth stocks and its subcomponents can be measured using different approaches. Ge-nerally, SNA advises computing wealth based on observed quantities and market prices (a census-like method), and to use alternative approaches when this method is not viable. In this study, we stick to this guideline and compute most wealth aggregates on this basis. All our estimates for financial assets and liabilities, as well as for agricultural land and housing wealth, follow the census approach. Alternatively, we apply the perpetual inventory method and the capitalization technique to measure the remaining wealth aggregates.
This study reconstructs national wealth in the most complete and comprehensive manner by using three different perspectives. First, we compute national wealth at market value for 1900-2017 by calculating household and government net worth position. For both sectors, we estimate financial wealth–financial claims net of liabilities–to which we add non-financial assets. Households’ non-financial assets are decomposed into three categories: housing (which includes the value of both the structure and the underlying land), agricultural land, and unincorporated business assets different from agricultural land. Similarly, for the government
sector, we decompose non-financial assets into produced assets (buildings, buildings and constructions, machinery and equipment), land underlying public buildings, and forestland owned by local authorities.
Secondly, we compute the book value of national wealth for 1900-2017 by aggregating all types of non-financial assets in the Spanish economy, to which we add the net foreign wealth. The estimate is done regardless of the sector owning them, and we decompose these assets into the following groups: Housing, non-residential buildings, buildings and constructions, machinery and equipment, transport equipment, inventories, and natural resources (agricultural land and sub-soil assets). For both residential and non-residential buildings, we differentiate between the value of the building and the underlying land. Finally, from 1995 onwards, we also calculate the book value of national wealth using a second definition that computes the balance sheet of corporations, both financial and non-financial entities, and adding their net wealth to the market value definition of national wealth.
As a general rule, our estimation procedure starts by accounting for the total value of a given asset in Spain (i.e., equity), which we then distribute into the different sectors owning it. For the most recent period of 1970 onwards, this approach is simple because most of the information employed already follows this decomposition. For the historical period, however, we need to determine the sector owning a particular asset, something that would be easier for those assets predominantly owned by a single sector (i.e., household-owned dwellings).
Finally, in addition to building sectoral balance sheets and different measures of national wealth, we also present a decomposition of the accumulation of national wealth into a volume effect (through saving) and a relative price effect (through capital gains or losses) in both multiplicative and additive forms. We do this by following the methodology proposed by
Piketty and Zucman (2014a) in the appendix of their paper, which relates the accumulation of national saving to the evolution of national wealth and finds the capital gains component as a residual.
can be specified as follows:
Wt+1 = (Wt+ St)(1 + qt), (1.1)
where Wt and Wt+1 are national wealth at times t and t + 1, respectively; St is the
net-of-depreciation national saving over year t; and (1 + qt) is the residual component that captures
increases in the relative price of wealth with respect to consumption goods. To track the evolution of the wealth-to-income ratio (β), we then divide the previous equation by Yt+1 and
obtain:
βt+1 = βt
(1 + qt)(1 + gwt)
1 + gt
, (1.2)
where 1 + gt= Yt+1Yt , 1 + gwt = 1 + sβtt and st stands for the net-of-depreciation saving rate of Yt in year t.
In addition, we go one step beyond, and conduct this decomposition for housing and non-housing wealth. To do this, we start from the definition of national wealth as the sum of domestic non-financial assets plus net foreign wealth: WN = AN F + N F W , which we further
decompose into housing and non-housing wealth: WN = WH + WN H. In this expression,
housing wealth is the market value of dwellings, while non-housing wealth is the sum of other types of capital and net foreign wealth. Similarly, we decompose national savings into domestic investment (net of depreciation) and foreign savings: SN = I + SF, which then we decompose
into housing investment and non-housing national savings: SN = IH + SN H. Consequently,
each component of national savings is mapped to its corresponding component in national wealth. We run equation (1.3) separately for each of these two components of national wealth:
βi,t+1= βi,t
(1 + qi,t)(1 + gwi,t)
1 + gi,t
, (1.3)
where i stands for housing or non-housing national wealth.3
3. Ideally, we would have liked to further decompose non-housing wealth into other types of capital and net foreign wealth. However, the multiplicative decomposition of wealth accumulation is based on the geometric averages of growth rates, which are only meaningful when wealth stocks take positive values. This is not the
On the other hand, the additive decomposition between two given years (t and t + 1), can be specified as follows:
Wt+1= Wt+ St,t+1+ KGt,t+1, (1.4)
where Wt and Wt+1 are national wealth at times t and t + 1, respectively; St,t+1 is the total
savings flow between years t and t + 1; and KGt,t+1 is the total capital gains or losses between
years t and t + 1. To track the evolution of the wealth-to-income ratio (β), we then divide the previous equation by Yt+1 and obtain:
βt+1 = βini+ βsav+ βkg (1.5)
where βini = YWt
t+1 is the component coming from initial wealth, and βsav =
St,t+1
Yt+1 and
βkg = KGYt+1t,t+1 are the components coming from savings flows and capital gains or losses,
respectively.
Furthermore, in line with the multiplicative form, we go one step beyond and carry this decomposition for housing, other types of capital, and foreign wealth.4 The additive
decomposition has the advantage of allowing us to disentangle the fraction of savings and capital gains that each component represents in the total, which is very relevant in explaining the accumulation of national wealth in Spain over time. Thus, we run equation (1.6) separately for each of these three components of national wealth:
βi,t+1= βi,ini+ βi,sav+ βi,kg (1.6)
where i stands for housing, other types of capital, or foreign wealth.
While the results from this study use the market value definition of national wealth, in the methodological appendix (Tables 1-4), we present the same analysis under the book value definition and the results are quite similar.
case for net foreign wealth in Spain.
4. Note that in this case, we do not have the limitations mentioned for the multiplicative decomposition and can split non-housing wealth between other types of capital and foreign wealth.
1.2.1
Non-financial assets
When computing non-financial assets, we follow a different approach for produced assets (buildings, machinery, and equipment) from that for non-produced assets (land and other natural resources). Agricultural land and housing, which clearly constitute the two most important asset components in the long run, are estimated through the census method, which multiplies the observed quantities (land areas or housing stock) by representative unit prices. For each period, we gathered the most refined data on prices to consider variations due to regional differences and diversity of uses (for example, differentiating by crop types in agriculture, or between price-regulated houses versus non-regulated ones). In this basic procedure, both wealth aggregates include the value of the underlying land and produced assets (cultivated crops and dwellings, respectively) Instead of using the housing wealth series from the Bank of Spain, we combine and adjust the different available sources on housing prices (Bank of Spain, IVIE, and the Ministry of Public Works) to produce a more precise estimate. Our housing wealth series is somewhat lower than that obtained by the Bank of Spain (Indicadores del Mercado de la Vivienda), Pérez and Uriel Jiménez (2012) and Naredo, Carpintero, and Marcos (2008), but the trend is the same.
In a second step, and following ESA standards (European Union (2013), p76), we estimate the stock of all produced assets in Spain based on the perpetual inventory method. This method requires an initial value for the stock of an asset, the service life of this asset type, together with investment flows and investment prices. In practice, we implement the perpetual inventory method for 1850-2017 using data on investment flows and investment prices for five groups of assets: dwellings, other constructions, machinery and equipment, transport equipment, and inventories. However, we only provide results from 1901 onwards, the period for which we can also estimate non-produced assets.
We are not the first to use this type of approach to reconstruct produced assets in Spain, and we benefited greatly from previous analyses. Most notably, Prados de la Escosura and Rosés (2010) estimate the stock of produced assets for four fixed-assets for 1850-2000, while
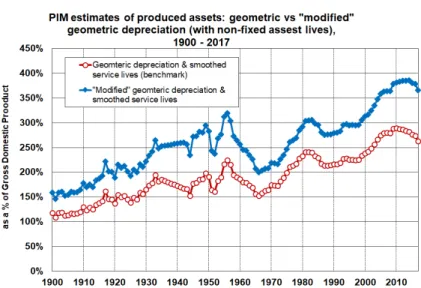
institute (Mas, Pérez García, and Uriel(2005), Cucarella and Mas Ivars(2009),Mas Ivars, Pérez García, Uriel Jiménez, Benages Candau, and Cucarella Tormo (2015)) decompose this stock into 17 categories from 1964 onwards. However, we compute our own estimate for two reasons: first, to incorporate the latest recommendations from the OECD (2009) on the use of geometric patterns of depreciation (which differ from Roses and Prados de la Escosura’s approach), and second, to include the most recent data on Spain’s historical national accounts from Prados de la Escosura (2017), which revised its previous series (Prados de la Escosura
(2003)) with a new interpolation method. As a robustness check, we present the series of produced assets using the same depreciation pattern as Prados de la Escosura and Rosés
(2010) in the methodological appendix. Overall, both approaches follow a similar trend, but the levels are about 25% lower in our benchmark series. Nonetheless, when computing the total book value of national wealth, both approaches show very close levels5.
The only assets that cannot be calculated by either the census-like estimate or the perpetual inventory method are mineral reserves. Historically, their importance for the Spanish case has been very limited compared to other countries, as the value-added from extractive industries has always been below 2% of GDP. Unfortunately, no data exists on the volume of subsoil assets for the present or the past, and so we calculate their value through a net price method, as proposed by Statistics Canada (2006). In this approach, the annual resource rent of extractive industries is capitalized by the depletion ratio. The resource rent has been obtained by deducting from gross value added the value of labour inputs, depreciation of produced assets and the imputed return on the capital stock. This procedure is a second-best estimate, although given the low levels of natural resources in Spain any inaccuracy should have a negligible effect on the top-line estimates on national wealth.
The third step is to estimate (or disentangle) the value of the land underlying buildings. Following OECD and Eurostat (2015) recommendations, we start by decomposing our
census-5. In the methodological appendix we present a set of robustness checks comparing our depreciation pattern with the alternative pattern used inPrados de la Escosura and Rosés (2010). We also compare our series of depreciation with those of the official national accounts. Overall, our series are very close to the official national accounts, with those using the alternative pattern showing lower levels. This reassures us on the convenience of using our depreciation pattern in the book-value national wealth series of the paper.
like estimate of housing using the residual approach. This is the same procedure followed by Davis and Heathcote (2007) to decompose the value of housing in the US for 1930-2000. Through this method, we calculate the value of land by deducting dwellings from the total value of the housing stock. Next, we compute the value of land underlying non-residential buildings, for which we count using an estimate of its structure obtained from the perpetual inventory method. We do this based on recent cadastral records of the total value of residential and non-residential buildings, which allows us to impute the relative weight of land in non-residential buildings with respect to residential ones.
In a fourth step, we determine the ownership by different institutional sectors on the stock of non-financial assets. We start by imputing households’ share over the two most important assets of agricultural land and housing directly based on administrative records. We then calculate the unincorporated business assets owned by the household sector, taking as a starting point the results of the Survey of Household Finances (Bank of Spain 2002-2014), and then upgrading the declared values to account for undervaluation and top-coding. We extend the results until the early 1980s by assuming a similar evolution as the assets of non-financial corporations (Bank of Spain 1982-2014). For the public sector, we use Mas Ivars, Pérez García, Uriel Jiménez, Benages Candau, and Cucarella Tormo (2015)’s series on government produced assets, and add the value of the underlying land and forests. In principle, all other non-financial assets are attributed to the corporate sector as a residual. Nonetheless, as noted previously, after 1995, we can also reconstruct the market value of non-financial assets owned by Spanish corporations using data from the Central Balance Sheet Data Office of the Bank of Spain.
1.2.2
Financial assets
Providing consistent series on the net financial wealth for the public, personal, and foreign sectors since the early twentieth century was done using different sources. For all three sectors, reconstructing financial assets and liabilities from 1970 to the present is mostly a straightforward exercise based on the reported figures in the Financial Accounts of the Bank of Spain. Our main adjustment, as we detail below, is by providing the first complete estimate
of offshore wealth.
Reconstructing the financial position for the rest of the twentieth century is a far more complex process given the lack of consistent estimates. Our calculations for the personal sector are based on a two-fold operation. First, we calculate the aggregate market value of each asset type, something that is simpler for claims (currency, deposits, loans, etc.) assessed at their nominal value than for other assets (bonds and shares) that are valued at the prevailing market prices. The second step involves computing households’ share by deducting the holdings of other institutional sectors (mostly corporations or the public sector) using a wide variety of auxiliary accounts (financial yearbooks, balance sheets of banking and insurance companies, government accounts, etc.).
To derive offshore wealth, we mainly use data from Zucman(2013, 2014) for 1999-2014 and the unique information recorded since 2012 by tax authorities on the assets held abroad by Spanish residents, classified by asset type (real estate, stocks, investment funds, deposits, etc.) and country of location. We then extrapolate the series backwards in time using the total value of offshore wealth, which flourished during the 1991 tax amnesty, and also by including the estimates on financial assets held in offshore havens provided by Zucman (2015). Nonetheless, due to the uncertainties related to these calculations, we do not include offshore assets in our benchmark series and only present them when decomposing total financial assets and the net foreign asset position.
Overall, our results on households’ financial position benefited greatly from the immense research by previous scholars and to the relative high quality of some Spanish historical sources. For example, two outstanding examples of very detailed sources that are normally unavailable in other countries are the statistics on corporate capital and the aggregate balance sheet of the banking sector published since the early 1920s. Additionally, Spain’s relative underdevelopment, and the fact that the country became increasingly detached from the world economy since the First World War made our calculations simpler. In many ways, it is easier to estimate household financial wealth in the past than in the present since the ownership structure is simpler, with less financial intermediation and cross-border positions.
Nonetheless, some problems remain in place. While the volume levels for each financial asset are generally well-covered, the depth and representativeness of market prices are below the desired level in some cases. One of the clearest cases occurs with equity holdings, which include shares traded through stock markets and those that are not. Quoted shares can be valued at their prevailing market prices in the Madrid Stock Exchange, but for non-listed firms, the standard procedure is to apply a valuation ratio observed in the stock market (for example, the dividend yield) to non-listed companies, and then apply a discount factor to consider illiquidity and risk premia. Due to the absence of observations on this last component, we have applied a standard 20% discount as an upper side estimate based on recent comparative studies (Amihud and Mendelson (1986);Amihud, Hameed, Kang, and Zhang(2015)). In the future, more research could be done in this area.
Estimates for the government sector before 1970 are much easier to produce. We proxy public net financial wealth by computing in the asset side of all state-owned equity holdings (e.g., the public railway company RENFE) and deducting as liabilities the market value of public debt. Computing Spain’s net foreign wealth prior to 1970 cannot be done through the census-like method given the scarcity of sources, and so we accumulate the current account balance and add the variation in foreign exchange reserves. This is a relatively widespread procedure since a surplus in the current account makes a country a net creditor to the rest of the world (and vice versa). The main drawback of this method is that it does not capture the relative change in assets prices owned by both residents and non-residents. Besides, it is always challenging to establish a starting point for the net foreign asset position. In this paper, we have computed directly the net foreign asset position in 1900, and used the census-like estimate provided by the Bank of Spain on the net foreign assets for 1932 to 1934. For the years in between, we use the data on the current account provided byPrados de la Escosura
(2010) and make a final adjustment to match the results with the net foreign asset position reported for 1970.
1.3
Results
This section starts documenting the most important long-term trends in the evolution of personal (Section 1.3.1) and public wealth (Section 1.3.2) and continues presenting the key findings on the evolution of national wealth taking an international perspective (Section 1.3.3). In line with previous literature, we report most results as a share of national income. In this way, stocks are more easily interpretable in real terms and relative to the total income of Spanish residents.
1.3.1
Personal wealth
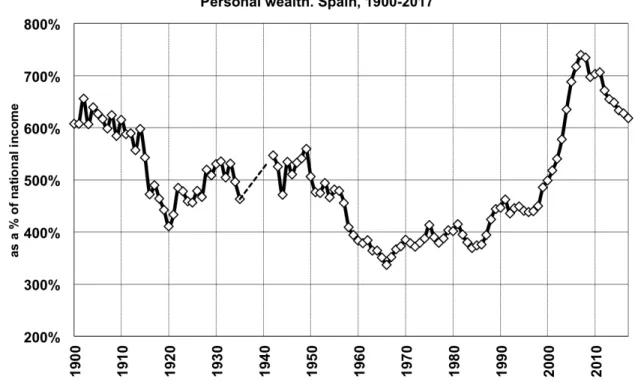
Figure1.1 presents the ratio between personal wealth to national income since 1900. The results indicate that, for most of the sample period, the wealth of Spanish households usually stood between four and five times national income, although the recent economic boom led this ratio to record levels of nearly 700%. The main turning points of this uneven process of wealth growth and decline are easy to spot. The personal wealth-to-income ratio stood at a relatively high level (around 6 times the national income) in the period before 1914, but economic growth fuelled by Spanish neutrality during the First World War, combined with a short period of high inflation, led to a significant decline in the relative importance of wealth. From 1920 to 1935, the oscillations in net worth largely reflected the general evolution of the economy and the performance of asset prices. Wealth grew significantly during the twenties, but households suffered a significant shock in their balance sheets during the tumultuous 1930s. Then, the ratio between personal wealth to national income increased sharply after the Civil War. This paradox occurs because from 1935 to 1940, Spanish real national income fell precipitously (c. 16%), but wealth remained almost constant, as destruction was compensated for by the rise in land prices.
However, in a short time, the personal wealth to income ratio declined steadily and remained at their lowest levels in the late 1950s and 1960s. Thus, in a period of rapid industrialization, income and wealth grew mostly at the same pace, and it was only in the late
1960s and early 1970s, when there was a short upswing in asset prices, that rapidly reverted with the economic crisis of the late 1970s. Finally, from the mid-1980s, and especially during the housing boom after the turn of the century, personal wealth started to grow dramatically until it reached an unprecedented level (740%) in 2007. In 2017, the most recent year with available data, the personal wealth to national income ratio stood at 619%, a level similar to that in 2004 (635%). After suffering the most severe economic crisis in more than seventy years, the wealth of Spanish households remains at relative high levels.
The analysis of the personal wealth composition provides several key factors to explain this evolution (Figure 1.2). Overall, one of the most surprising facts is that non-financial assets, in particular, agricultural and housing land, have always represented the bulk of households’ assets. In aggregate, real assets constituted 76% of gross assets in 1900 and 69% in 2017. Behind this seeming continuity there is a profound transformation. In the first decades of the century, the composition of Spanish personal wealth followed the conditions of an underdeveloped economy, as agricultural land and farm capital (livestock and machinery) were the main assets that individuals owned. Until the 1950s, the most important changes in the ratio of wealth to national income occurred as a by-product of the change in the relative share of agriculture in the economy and due to the evolution of land prices. However, the irreversible decline of agriculture that finally occurred in Spain from the mid-1950s onwards was matched, in a very short time, by successive real estate boom cycles that made housing the main component of private wealth. As Figure 1.2 shows, it is not the replacement cost of dwellings but the land underlying them that mostly determined the evolution of housing in the post-war decades. From this perspective, the evolution of Spanish household wealth over the twentieth century can be described as the transition from agricultural to residential land.
The significant weight of real assets should not conceal the equally remarkable trans-formation in the composition of households’ financial assets (Figure 1.3). Until the Civil War, debt securities were the most important claim, with a share that fluctuated around 40 to 60% of gross financial assets. This fact attests not only to the prominence of public debt and railway debentures in relation to equity shares in capital markets (Hoyo Aparicio
(2007)), but also implicitly to the investment preferences of wealthy families. Considering that wealth (particularly financial assets) was heavily concentrated (Alvaredo and Artola Blanco
(2017)), and given that the banking system was largely underdeveloped and lacked any form of deposit insurance, it seemed normal for rich households to lend directly to the government or corporations. Unsurprisingly, the high inflation since 1936 constituted a major wealth shock, as the value of most fixed income securities was rapidly wiped out.
From the 1960s onwards, the composition of personal financial assets in Spain started to resemble the conditions of a developed country. Banking deposits became the most widespread tool for channeling households’ savings and stock market fluctuations started to have a sizable impact on the net worth of families. In fact, three noticeable trends are worth pointing out. First, after the end of Franco’s regime in 1978, Spain experienced a process of Financialization, which led to an increasing comovement between financial and non-financial assets. The interrelationship across housing and stocks has already been documented at a global scale (Jorda, Knoll, Kuvshinov, Schularick, and Taylor (2017)). Second, the process of Financialization also led an exponential rise in offshore assets. In 2012, offshore assets amounted to 195 billion Euros, that is, 23% of both national income and net personal financial wealth. Interestingly, this estimate is higher than the 8% obtained by Zucman (2013) for all world countries. Hence, offshore assets constitute a non-negligible part of the portfolio of households in Spain and must be considered when analyzing the long-run evolution of wealth. This rise in offshore assets, together with the increase in the value of dwellings, have contributed to keep nearly the same levels of wealth concentration in the 1980s in the 2000s (Martínez-Toledano(2017)). Third, in Spain, pension assets have had an almost residual weight until the present day. The rise of an unfunded social security system since late Francoism, combined with an everlasting housing boom, has undoubtedly influenced how households accumulated and invested wealth.
Figure 1.4 shows the share of household liabilities as a percentage of national income. By any standard, private indebtedness stood at very low levels during the first half of the twentieth century (i.e., below 20% of national income), something that seems at odds with
the fact that household balance sheets were relatively strong, and therefore individuals could have increased their leverage for investment purposes. However, as many contemporaries and historians already pointed out (Carmona and Simpson (2003)), the main private asset at that time (agricultural land) was scarcely used as collateral to obtain a loan, given the associated high transaction costs. After the 1950s there was a radical shift in this situation. The development of household credit has been closely connected with the real estate cycle, as each boom (the mid-1960s, late 80s, and 1999-2007) has fostered the growth of household debt to increasingly higher levels.
1.3.2
Public wealth
As it is well known, state finances are different from those of private agents as the government can rapidly increase its debt and have a negative net worth position for a long period of time. Figure 1.5 presents the liabilities and net worth of the Spanish government as a percentage of national income. Both measures tend to follow similar trends, indicating that changes in the debt stock were the main driving force behind the evolution of government wealth. At the start of the twentieth century, public debt stood at very high levels due to the dire state of Treasury finances, and, in particular, to chronic deficits, the loss of the last remnants of the colonial empire (Cuba and the Philippines became independent in 1898), and creditors’ demands for high interest rates following various default events (Comín(2012)). Public liabilities gradually decreased thereafter, favored by a reduction in the debt burden through tax increases and inflation during the First World War. Later, during Franco’s dictatorship (1939-1975), the government balance sheet improved sharply, mostly driven by the irresistible decline in the debt burden caused by financial repression and inflation (Comín
(2015)). The last decades were marked by a two-fold increase in public debt, first during the 1980s and early 1990s, and second after the recent economic crisis. Public liabilities in relation to national income (164% in 2017) currently stand at their highest point since the late nineteenth century.