HAL Id: hal-03065348
https://hal.archives-ouvertes.fr/hal-03065348
Submitted on 14 Dec 2020HAL is a multi-disciplinary open access archive for the deposit and dissemination of sci-entific research documents, whether they are pub-lished or not. The documents may come from teaching and research institutions in France or abroad, or from public or private research centers.
L’archive ouverte pluridisciplinaire HAL, est destinée au dépôt et à la diffusion de documents scientifiques de niveau recherche, publiés ou non, émanant des établissements d’enseignement et de recherche français ou étrangers, des laboratoires publics ou privés.
François Costard, L Dupeyrat, A Séjourné, F Bouchard, A Fedorov, B
Saint-Bézar
To cite this version:
François Costard, L Dupeyrat, A Séjourné, F Bouchard, A Fedorov, et al.. Retrogressive thaw slumps on ice-rich permafrost under degradation: Results from a large-scale laboratory simulation. Geophys-ical Research Letters, American GeophysGeophys-ical Union, In press. �hal-03065348�
Retrogressive thaw slumps on ice-rich permafrost under degradation:
1
Results from a large-scale laboratory simulation
2
F. Costard1, L. Dupeyrat1, A. Séjourné1, F. Bouchard1, A. Fedorov2, and B.
Saint-3
Bézar1
4
5
1Géosciences Paris-Saclay (GEOPS), CNRS/Université Paris-Saclay, Orsay, France, 6
2Melnikov Permafrost Institute, Russian Academy of Sciences, Yakutsk, Russia 7
8
Corresponding author: François Costard ([email protected])
9
Key Points:
10
Retrogressive thaw slumps (RTS) result from the thermal destabilization of
ice-11
rich permafrost as a consequence of increasing subsurface temperature
12
Experimental RTS were designed to simulate the thawing of ice-rich permafrost
13
with vertical and horizontal ice layers
14
Our laboratory simulations show how ground ice heterogeneities influence RTS
15
development
16 17
Abstract
18
In the ice-rich permafrost of the Arctic regions, thermokarst erosion on slopes induces the
19
formation of large-scale retrogressive thaw slumps (RTS). They have significant
20
geomorphological, hydrological and biogeochemical impacts on the landscape. Further research
21
is thus needed to better understand the respective effect of ice content and permafrost
22
heterogeneities on the dynamics of these erosional features. Here we present results of a full-scale
23
physical modelling of RTS development in a cold room. The experimental setup was designed to
24
simulate and compare two ground-ice settings (ice wedges, icy layers) with the thawing of
ice-25
poor permafrost (i.e.,reference model). Our results show that the melting of the icy layers induces
26
a loss of decohesion of the overlapping frozen soil. The heterogeneous frozen soil with ice
27
wedges needs a longer time until degradation, but undergoes a stronger and faster decohesion of
28
its structure during the thawing phase.
29 30
1 Introduction
31
Over the last few years, various studies have documented significant impacts of recent
32
global warming across the Arctic since the mid-twentieth century, with a preferential thermal
33
degradation of ice-rich permafrost and the related release of previously sequestered carbon (e.g.,
34
Grosse et al., 2011; Romanovsky et al., 2010). These studies indicate a sensitivity of cold Arctic
35
permafrost to climate-driven thermokarst (thaw) initiation (Olefeldt et al., 2016). The
36
development of thermokarst results from the thermal destabilization of ice-rich permafrost as a
37
consequence of the increase in subsurface temperature (Soloviev, 1973; French, 2017). Over the
38
last decades, this ice-rich permafrost has been highly vulnerable and prone to extensive
39
degradation within the continuous permafrost zone of Eurasia and North America (Olefeldt et al.,
40
2016; Lewkowicz and Way, 2019).
41
Retrogressive thaw slumps (RTS) represent a dynamic form of thermokarst. They expand
42
inland by melting of exposed ground ice in the headwall to form landslide-like U-shaped scars
43
(Lantuit and Pollard., 2008). In the western Canadian Arctic, widespread permafrost degradation
44
accompanied by active RTS development is mostly observed in ice-rich formerly glaciated
45
landscapes (Olefeldt et al. 2016, Rudy et al., 2017; Murton et al., 2017; Kokelj et al., 2017; Nitze
46
et al., 2018). These ice-rich areas contain buried glacier ice that has been preserved under
47
permafrost conditions (Rudy et al., 2017). They are present in the form of horizontal massive ice
layers. In Eastern Siberia, RTS are mostly developed in the Yedoma (Pleistocene-aged) ice
49
complex area (Opel et al., 2019). In central Yakutia (CY), the upper section of permafrost
50
contains Pleistocene ice-rich sediments, up to 20–50 m in thickness, containing ~70-80 % of ice
51
by volume (Soloviev, 1973; Schirrmeister et al., 2020). The Yedoma ice complex is dominated
52
by huge ice wedges up to a few meters wide and 15-25 meters high within sandy deposits (Opel
53
et al., 2019; Shepelev et al., 2020). In some places, these large-scale ice wedges can be
54
continuous and form a massive horizontal ice layer at the base (Opel et al., 2019). In CY, RTS
55
are smaller than in the High Arctic. Amphitheater-shaped slump hollows are 30-50 m wide and
56
are characterized by (1) their concave profile of collapsed banks and (2) highly-degraded conical
57
polygons (Figure 1) with wide troughs referred to as “baydjarakhs” (Soloviev, 1979). This
ice-58
rich permafrost is characterized by its medium and/or fine sand (D50 200 – 300 µm) and silty 59
material (D50 18 – 30 µm) of Quaternary lacustrine or aeolian (loessic) origin (Schirrmeister et 60
al., 2020; Soloviev, 1973). These sediments contain ~30–40% of ice by volume, in addition to
61
large syngenetic ice wedges (Ulrich et al. 2014; Strauss et al., 2017).
62
Several studies estimated the development of RTS in the High Arctic with extended photo
63
time series (30 years). Headwall retreat rates range from 0.5–1 m yr−1 along thermokarst lakes in
64
the tundra uplands of the Mackenzie Delta, Canada (Lantz and Kokelj, 2008) to an average up to
65
0.68 m.yr−1 and 29.0 m3.m-1.yr-1 on the coast of Herschel Island, Canada, next to the Beaufort Sea 66
(Lantuit and Pollard, 2008; Obu et al., 2016). Headwall retreat rates of up to 13 m yr−1 were
67
recently observed in the western coast of Kolguev Island, Russia (Kizyakov et al., 2013). In CY,
68
the maximal average headwall retreat of these RTS can reach 3.16 m yr−1 for the 2012-2013
69
period (Séjourné et al., 2015), although maximal values of 30 m yr−1 were recorded at the
70
Batagay megaslump in Yakutia (Opel et al., 2019). With a length of more than 1000 m, a width
71
of 800 m and 60 m high headwalls in 2019, this mega-RTS is representative of three typical
72
cryolithological types of permafrost at a single site. It is characterized by its ice-rich Yedoma
73
permafrost close to the surface, underlain by ice-poor sands, while at its base a pure ground-ice
74
layer is present (Shepelev et al., 2020). In close association with the erosion of RTS, small
mud-75
flows settling on gentle slopes are observed from melted ice wedge network and contribute to the
76
transport of sediments, dissolved elements and meltwater from the melting of ice wedges (Figure
77
1a). These RTS liberate both soluble materials and organic carbon accumulated in the
78
sedimentary deposits that are transported by runoff (Vonk et al. 2015; Shakil et al., 2020). The
abrupt thawing of ice-rich permafrost is thus a major issue because of the positive feedback on
80
global climate (Schuur et al., 2008; Turestsky et al, 2020).
81
The possible causes of present-day initiation of thermokarst are numerous but their
82
interrelations are not well understood. According to Ward Jones et al. (2019), record summer
83
warmth in 2011 and 2012 in the Canadian Arctic promoted thermokarst initialization in
84
previously unaffected terrain. Permafrost degradation is always initiated by deepening of the
85
active-layer as a consequence of an increase in subsurface temperature (Fedorov et al., 2014;
86
Fedorov and Konstantinov, 2009). Retrogressive thaw slumps are initiated by a variety of
87
mechanisms that expose ice-rich sediments, including mechanical erosion by fluvial processes,
88
wave action, thermally driven subsidence along the banks, and mass-wasting (Burn and
89
Lewkowicz 1990; Wolfe et al., 2001; Lantuit and Pollard, 2008; Kokelj et al., 2017; Lacelle et
90
al., 2010). According to Segal et al. (2016), climate change, in conjunction with increases in air
91
temperature and precipitation, induces an acceleration of RTS activity. According to Séjourné et
92
al. (2015), RTS in CY mainly occur along the south- to southwest-facing banks of thermokarst
93
lakes due to solar insolation and increased air temperature. However, the timing of this recent
94
increase over the last few decades and its links to climate have not been fully established (Lantuit
95
and Pollard, 2005; Lantz and Kokelj, 2008; Wolfe et al., 2001). Local differences in recent
96
erosion rates across the circumpolar Arctic may be due to a difference in local climate, headwall
97
height, and ice content (Kokelj and Jorgenson, 2013). Other authors suggest that the presence of
98
massive ground ice (ice wedges, massive segregated ice, buried glacier ice) is a precondition for
99
RTS development. (Leibman et al., 2008; Lantuit et al., 2012). While it was observed that RTS in
100
CY develop in Yedoma ice complex terrain with huge syngenetic ice wedges (Figure 1b), the
101
heterogeneous structure of ice-rich permafrost and its subsequent influence on thermokarst
102
degradation has not been analyzed. The relative importance of the main parameters affecting RTS
103
are, however, difficult to assess in the field. Numerous factors work simultaneously, and their
104
interdependence makes their separate analysis difficult. Physical modelling provides a unique
105
tool for a more detailed monitoring compared to field observations.
106
Here, we present results of a full-scale physical modelling of RTS development in a cold
107
room. For this purpose, the experimental RTS were designed to simulate the thawing of ice-rich
108
permafrost with various heterogeneities (ice wedges, icy layers) that were supposed to be
109
representative of RTS development in CY. In a first experimental set-up, we simulated artificial
ice wedges (vertical ice layers), which are common in large parts of continuous permafrost across
111
the Northern Hemisphere (i.e., polygonal landscapes and Yedoma ice complex). In a second
set-112
up, horizontal ice layers mimic a second type of ice-rich permafrost that might find its natural
113
expression in formerly glaciated Arctic landscapes with soft sediments and large masses of
114
segregated ice or buried glacier ice. Each experimental set-up was compared to reference frozen
115
ground with no excess ice. Therefore, this study is representative of three typical cryolithological
116
types of permafrost in unconsolidated material, which cover several hundreds of thousands of
117
km² in the Arctic.
118 119
120
Figure 1: (a) Headwall of retrogressive thaw slumps (RTS) along a thermokarst lake in central
121
Yakutia (Estern Siberia). Permafrost with alluvial sandy loam containing up to 40-50% of ice by volume
122
and syngenetic ice-wedges of 7 m in thickness. (b) The localized melting of ice wedges along the banks
123
of thermokarst lakes forms highly-degraded conical polygons with wide troughs (baydjarakhs). These
124
typical structures are indicative of heterogenous ice-rich permafrost with a preferential erosion along ice
125
wedges.
127
2 Experimental setup
128
Physical modelling of RTS was undertaken using large-scale frozen soils in a
129
temperature-controlled chamber. The major purpose of the experiment was to examine the
130
respective effects of different ground-ice content and type affecting the ground thermal regime
131
and vulnerability to subsidence. We used the cold-room at the GEOPS laboratory (University
132
Paris Saclay, France) dedicated to the physical modelling in periglacial geomorphology. The
133
specificity of our experiments was to simulate the thawing of ice-rich permafrost, compared to
134
the thawing of ice-poor permafrost (i.e., reference conditions). In a first experimental setup
135
(experiment n°1), we worked with artificial ice wedges (vertical ice layers, see SI1), which are
136
common in large parts of continuous permafrost across the Northern Hemisphere (i.e., polygonal
137
landscapes). In a second setup (experiment n°2), we worked with horizontal ice layers mostly
138
typical of formerly glaciated Arctic landscapes with soft sediments and large masses of
139
segregated ice or buried glacier ice (see SI2). Our experiment is composed of a rectangular box of
140
2.5 m x 2.5 m wide and 0.5 m deep in which fine sand (D50 = 200 µm) was saturated with water 141
(Figure 2). Here, we used the grain size distribution of Bayeux sand as an analog to sands from
142
the banks of most RTS in CY. The basal slope was 5° for the release of meltwater overflow
143
during the thawing phase. A foam rubber was placed all around the experiment to ensure thermal
144
insulation. For each experiment, the sediment structure was homogeneous and had a water
145
content of 20% by volume. A well-proven technique was used to create a homogeneous porous
146
medium of more than one ton of saturated soil (Costard et al., 2003). To obtain the optimal
147
porosity at water saturation, we first mixed the sand with water to a wet density of 1.81 g.cm-3
148
corresponding to the “Proctor compaction” technique (Costard et al., 2003). We manually
149
compacted layers of 10 cm each and then put them on top of each other until 0.5 m thickness was
150
reached. Such technique allows a parametric control on a homogeneous block of about 1 ton of
151
already saturated material with a volumetric water content of 20 %. There might be some small
152
interfaces (thin unconformities), but they remain insignificant. In order to evaluate the effect of
153
permafrost heterogeneities on the development of RTS, we artificially built vertical and
154
horizontal ice layers to respectively mimic ice wedges and icy beds (volumetric ice content of
155
100 %). Before the freezing phase, each icy block was installed within the right side of the
156
experiment (see Figures SI1 and SI2). Finally, all the material was frozen in the cold room at
25°C and then progressively reheated at -10°C (Figures SI3 and SI4). This technique allowed us
158
to prepare homogeneous samples with reproducible densities and without ice segregation
159
(Costard et al., 2003). Figures 2, SI1 and SI2 show the homogeneous model S1 (or reference
160
model) on the left, and the heterogeneous model S2, which corresponds to a ice rich permafrost
161
with a total of 30 % ice by volume, on the right. The size, geometry and spacing of these icy
162
blocks within the frozen soil represent a simplification of the natural setting, but the main
163
objective here was to understand the influence of heterogeneities on permafrost degradation from
164
a strictly thermal point of view.
165
166
Figure 2: RTS experiment n°1 (with ice wedges) of 2.5 m x 2.5 wide and 0.5 m height showing on
167
the left side a homogeneous frozen soil and on the right side the same frozen soil (saturated fine sand)
168
with additional artificial ice wedges. The thick vertical brown line on the top of each photo separates left
169
from right part. Active erosion due to the presence of ice wedges is observed on the right side of the
170
experiment. White cables correspond to temperature sensors.
171 172
Figure 2 presents the case of RTS development in an ice-wedge setting with pure ice
173
blocks of 5 cm thick. In experiment n°2, we added horizontal heterogeneities (pure icy layers)
174
instead of ice-wedges (Figure SI2). In that experiment, we artificially built icy layers of 10 cm in
175
thickness and set them up in the right part of the experiment in the cold room (Figure SI2). We
176
used the same protocol as for the experiment n°1 for preparing the frozen soil. The left side of the
177
experiment corresponds to the reference model with saturated and homogeneous frozen ground.
All the models were instrumented using ten temperature sensors (platinum resistance
179
thermometers Pt100 with ±0.1°C accuracy) to survey the freezing and thawing front vs. time. A
180
first series of 5 sensors, spaced every 5 cm, was placed in the homogeneous frozen soil at a depth
181
of 20 cm. A similar series of sensors was placed in the frozen soil with ice heterogeneities
182
(Figures SI1 and SI2). During each simulation, we also analyzed the development of associated
183
degradation landforms using time-lapse photography with a video camera (Figures SI5 and SI6).
184
This allows later analysis of the repeated observation of permafrost degradation. For each
185
experiment, we compared ice-rich permafrost degradation (with a total of 30 % ice by volume)
186
with a reference model (homogeneous permafrost with 20% ice by volume). In these
187
experiments, we assumed that the scale effect was not a limiting factor. Here, we restricted our
188
approach to the relative importance of the heterogeneities (ice wedges, icy layers) and their
189
thermal influence on permafrost degradation.
190 191
3 Results and discussion
192
Our objective was to test not only different scenarios (different types of heterogeneities)
193
but also different environments. Therefore, we tested permafrost thawing with different initial
194
temperatures (-6°C and -10°C) and different warming conditions (slight and severe). Figure
195
3 shows the typical case of a slight warming, whereas Figure 4 presents a more severe scenario
196
(i.e. with a steeper warming phase).
197
For experiments n°1 and n°2, we started to analyze the data recording when all
198
temperatures in the frozen ground were stabilized at around -6°C and -10°C respectively. We
199
performed a systematic measurement of the thermal wave propagation from the ten Pt100 sensors
200
during the warming phase (Datasets SI3 and SI4). Three main stages within that warming phase
201
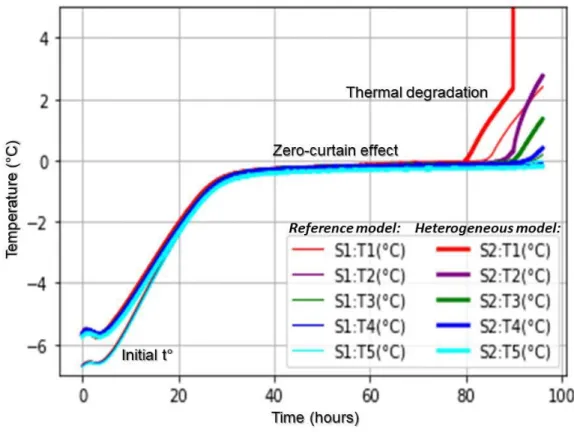
were recorded (Figures 3 and 4): (i) The first stage corresponds to a rapid increase in the
202
temperature monitored for all sensors, within approximately 24 hours, with all sensors reaching
203
0°C. (ii) The second stage corresponds to a period of relatively stable temperatures around 0°C
204
due to the zero-curtain effect (latent heat release). A considerable amount of heat has to warm the
205
ground up to the melting point before ablation can proceed, in agreement with recent
206
investigations on temperature-dependent RTS development (Zwieback et al., 2018). (iii) The
207
third stage starts when sensors record positive temperatures.
In experiment n°1, the reference model (left side of the experiment on Figure 2) showed a
209
relatively slow rise of temperatures (Figure 3). On the contrary, the heterogeneous frozen soil
210
(right side of the experiment on Figure 2) showed a rapid increase of soil temperature, notably
211
faster than the reference model (Figure 3). From a morphological point of view (Figures 2 and
212
SI5), the homogeneous block (reference model) remains stable (without any deformation, even
213
after thawing during the warming phase), while the heterogeneous one shows dramatic evolutions
214
(slumping, subsidence). In experiment n°2 with horizontal heterogeneities (icy layers), again the
215
reference model (homogenous frozen soil) remained mechanically stable without subsidence,
216
even after complete thawing (Figure SI6). On the contrary, the heterogeneous frozen soil with icy
217
layers showed a clear subsidence due to the melting of the excess ice. From a thermal point of
218
view, we can observe a relatively faster warming of the heterogeneous frozen soil and a relatively
219
colder temperature for the reference model (Figure 4). The analysis of the time-lapse
220
photography (Figure SI5) clearly shows the evolution of the individual blocks of permafrost in
221
between ice wedges (i.e., modeled polygon centers) towards a hummocky morphology similar to
222
the development of high-centered polygons (i.e., baydjarakhs). Our experiments clearly show the
223
detachment and vertical subsidence of individual blocks along ice wedges and the subsequent
224
formation of ‘mud’ flow at the basal slope due to the basal concentration of oversaturated
225
sediments (Figure SI5), in agreement with previous laboratory work focused on rainfall-induced
226
slope failures (Tohari et al., 2007).
227 228 229
230
Figure 3: Experimental setup n°1: evolution of temperature in homogeneous frozen soil (thin
231
lines: S1) and heterogeneous frozen soil with artificial ice wedges (bold lines: S2). A first series of 5
232
sensors (S1:T1 to S1:T5), spaced every 5 cm, was placed in the homogeneous frozen soil at a depth of 20
233
cm. A similar series of sensors was placed in permafrost with ice heterogeneities (S2:T1 to S2:T5). In both
234
blocks, the temperature is similar in the first heating stage and in the following zero-curtain effect stage.
235
After melting, greater temperatures are observed in the heterogeneous permafrost compared to the
236
homogeneous one.
237 238
In experiment n°1, the efficient warming in heterogeneous soil can be related to the
239
melting of ice wedges (Figure 2) and the formation of associated voids along the ice wedges that
240
allow for a better heat diffusion within the thawing soil. In fact, during the thawing phase, the
241
progressive melting of ice wedges (excess ice) induces a larger heat capacity of liquid water that
242
enhances temperature increase of the soil. All the experiments showed that ice wedges increase
243
the preferential erosion during the warming phase and supply meltwater to the thawing frozen
244
interface, which accelerates basal slumping. These observations are in agreement with field
245
observations of RTS from Lantuit et al. (2012) and Séjourné et al. (2015). For experiment n°2,
246
the melting of the icy layers induces a loss of cohesion of the overlapping frozen soil (Figure SI6:
video material) and a better warm air circulation within the soil. These results indicate that
248
discontinuities (ice wedges, icy layers) in frozen soils are much more prone to intense thermal
249
degradation (warming and thermokarst development) compared to homogeneous and ice-poor
250
permafrost. Our laboratory results are in agreement with recent investigations along the Batagay
251
thaw slump in Yakutia, where the presence of a basal horizontal ice layer of merged ice wedges
252
is the precondition for its deep incision, while the continuous presence of large ice wedges close
253
to the surface seems to be decisive for its large areal extend and exponential growth (Opel et al.,
254
2019).
255 256
257
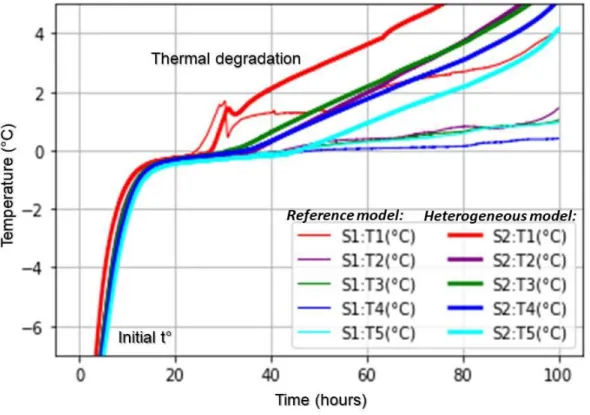
Figure 4: Experimental setup n°2: evolution of temperatures of modelled heterogeneous
258
permafrost (bold lines: S2) with horizontal heterogeneities (icy layers). Thin lines (S1) correspond to the
259
homogeneous frozen soil (reference model).
260 261 262
4 Conclusions
263
The underpinning question of our study was to evaluate the main controlling factors of the
264
formation of retrogressive thaw slumps. Cryogeological (granulometry, ice-content and type) and
265
climatological conditions differ greatly across regions where RTS can be observed. We simulated
266
two major ground-ice settings (ice wedges and buried massive ice) compared to a reference
267
model (low ice content). Therefore, this study is representative of three typical cryolithological
268
types of permafrost, which can be found at one site together (Batagay megaslump in Central
269
Yakutia). Our study allows a normalized view on RTS development assuming equal thermal,
270
volumetric ground-ice and grain size conditions and contributes to a better understanding of the
271
relative contribution of heterogeneities, during permafrost degradation processes. Our laboratory
272
simulations attest the efficiency of heterogeneities that control thermokarst and RTS development
273
by two main mechanisms: (i) the strong decohesion of its structure during the thawing phase and
274
an easier circulation of warm air (Figures 3 and 4), and (ii) the excess of water from the
275
preferential melting in ice-rich permafrost, which increases the slumping effect (Figures SI5 and
276
SI6).
277
We calculated the onset of degradation for each experimental setup using the duration of the
278
zero-curtain effect. The moderate initial temperature and the slight warming phase of model 1
279
(ice wedges, Figure 3) induce a longer onset of degradation than the one for model 2 (icy layers
280
under a severe warming condition, Figure 4). The ice-wedge type needs more time before
281
degradation, but then this degradation occurs more rapidly compared to model 2 (icy layers). Our
282
experimental approach suggests that the ice-wedge setting strongly increases the efficiency of
283
RTS development.
284
This study provides a better understanding of how ground-ice heterogeneities influence
285
RTS development, hence serving as a point of reference for future in situ studies of periglacial
286
geomorphic processes and their impacts on the carbon cycle in the Arctic.
287 288
Acknowledgments
289
Authors are funded by the Labex IPSL, the GDR2012 Arctique : Enjeux pour
290
l’Environnement et les Sociétés and the Agence Nationale de la Recherche (ANR) through the
291
Make Our Planet Great Again (MOPGA) initiative (Programme d’investissements d’avenir –
292
project No. ANR-17-MPGA-0014). Assistance of the Melnikov Permafrost Institute of Yakutsk
for field studies is gratefully acknowledged. All data from our cold chamber at Orsay (Université
294
Paris-Saclay) are presented in the supporting information S1 to S5. These data are also available
295
on the repository PANGAEA Data Archiving & Publication:
296
https://doi.pangaea.de/10.1594/PANGAEA.921498. We thank the Editor, M. Fritz and an
297
anonymous reviewer for their constructive comments and questions, which substantially
298
improved the quality of our manuscript.
299 300
Authors contributions:
301
F.C. conceived, designed and carried out the cold-room experiment. A.S. and F.B.
302
developed the hypothesis and its implications. L.D. created and performed calculations of the
303
thermal database, and B.S.B. and A.F. guided the research effort and discussions. The manuscript
304
was collectively written by F.C., A.S. and F.B. All authors provided input on the manuscript and
305
the broader implications of this work.
306 307
References
308
Burn C. R. & A.G. Lewkowicz (1990), Retrogressive thaw slumps. The Canadian
309
Geographer, 34: 273–276. doi.org/10.1111/j.1541-0064.1990.tb01092.x
310 311
Costard, F., L. Dupeyrat, E. Gautier & E. Carey-Gailhardis (2003), Fluvial thermal
312
erosion investigations along a rapidly eroding river bank: application to the Lena river (central
313
Yakutia). Earth Surface Processes and Landforms, 28, 1349-1359. doi.org/10.1002/esp.592
314 315
Fedorov, A.N. & P. Y. Konstantinov (2009), Response of permafrost landscapes of
316
central Yakutia to current changes of climate, and anthropogenic impacts. Geograph. Nat.
317
Resour., 30. 146-150. doi.org/10.1016/j.gnr.2009.06.010
318 319
Fedorov, A.N., A. Ivanova, R. Park, H. Hiyama, & Y. Iijima (2014), Recent air
320
temperature changes in the permafrost landscapes on northeastern Eurasia. Polar Science, 8(2),
321
114-128. doi.org/10.1016/j.polar.2014.02.001 322
French, H. M. (2017), The Periglacial Environment, 4th ed.Wiley. ISBN:
978-1-119-324
13278-3
325 326
Grosse, G., J. Harden, M. Turetsky, A. D. McGuire, Ph. Camill, C. Tarnocai, S. Frolking,
327
E. A. G. Schuur, T. Jorgenson, S. Marchenko, V. Romanovsky, K. P. Wickland, N. French, M.
328
Waldrop, L. Bourgeau‐Chavez. and R. G. Striegl (2011), Vulnerability of high‐latitude soil
329
organic carbon in North America to disturbance. J. Geophys. Res., 116, G00K06,
330
doi:10.1029/2010JG001507
331 332
IPCC, (2019), IPCC Special Report on the Ocean and Cryosphere in a Changing Climate
333
[H.-O. Pörtner, et al. (eds.)].
334 335
Kizyakov A.I., M. V. Zimin, M. O. Leibman, and N.V. Pravikova (2013), Monitoring of
336
the rate of thermal denudation and thermal abrasion on the western coast of Kolguev Island,
337
using high resolution satellite images. Kriosfera Zemli, 17(4), 36-47. hdl:10013/epic.49210.d001
338 339
Kokelj, S.V. & M. T. Jorgenson (2013), Advances in thermokarst research. PPP, vol. 24
340
issue 2, pp. 108-119. doi.org/10.1002/ppp.1779
341 342
Kokelj, S.V., T. C. Lantz, J. Tunnicliffe, R. Segal & D. Lacelle (2017), Climate-driven
343
thaw of permafrost preserved glacial landscapes, northwestern Canada. Geology. V. 45, No. 2.
344
doi: 10.1130/G38626.1
345 346
Lacelle D., J. Bjornson & B. Lauriol (2010), Climatic and geomorphic factors affecting
347
contemporary (1950–2004) activity of retrogressive thaw slumps on the Aklavik Plateau,
348
Richardson Mountains, NWT, Canada. Permafrost and Periglacial Processes, 21: 1–15. doi :
349
10.1002/ppp.666
350 351
Lantuit, H. & W. H. Pollard (2008), Fifty years of coastal erosion and retrogressive thaw
352
slump activity on Herschel Island, Southern Beaufort Sea, Yukon Territory, Canada.
353
Geomorphology, 95 (1). doi: 10.1016/j.geomorph.2006.07.040
355
Lantuit, H., W. H. Pollard, N. Couture, M. Fritz, L. Schirrmeister, H. Meyer and H.-
356
W. Hubberten (2012), Modern and Late Holocene Retrogressive Thaw Slump Activity on
357
the Yukon Coastal Plain and Herschel Island, Yukon Territory, Canada. PPP, 23, 39-51.
358
doi.org/10.1002/ppp.1731
359 360
Lantz T. C. & S. V. Kokelj (2008), Increasing rates of retrogressive thaw slump activity
361
in the Mackenzie Delta region, N.W.T., Canada. GRL, 35: L06502. doi:10.1029/2007GL032433
362 363
Leibman, M., A. Gubarkov, A. Khomutov, A. Kizyakov, & B. Vanshtein (2008), Coastal
364
processes at the tabular-ground-ice-bearing area, Yugorsky Peninsula, Russia, in: Kane, D.L. and
365
Hinkel, K.M. (eds), Proceedings of the Ninth International Conference on Permafrost, University
366
of Alaska Fairbanks, June 29-July 3 2008, 1037-1042. hdl.handle.net/10013/epic.45563.d001
367 368
Lewkowicz A. G. & R. G. Way (2019), Extremes of summer climate trigger thousands of
369
thermokarst landslides in a High Arctic environment. Nat. Commun. 10 1329.
370
doi.org/10.1038/s41467-019-09314-7
371 372
Murton, J., M. Edwards, A. Lozhkin, P. Anderson, G. Savvinov, N. Bakulina, ... & O.
373
Zanina (2017), Preliminary paleoenvironmental analysis of permafrost deposits at Batagaika
374
megaslump, Yana Uplands, northeast Siberia. Quat. Res. 87, issue 2, 314–330.
375
doi.org/10.1017/qua.2016.15
376 377
Nitze, I., G. Grosse, B. M. Jone, V. E. Romanovsky, & J. Boike (2018), Remote sensing
378
quantifies widespread abundance of permafrost region disturbances across the Arctic and
379
Subarctic. Nature Communications, Vol. 9, 5423. doi.org/10.1038/s41467-018-07663-3
380 381
Obu, A., H. Lantuit, M. Fritz, Wayne H. Pollard, T.Sachs & F.Günther (2016), Relation
382
between planimetric and volumetric measurements of permafrost coast erosion: a case study from
383
Herschel Island, western Canadian Arctic, Polar Res., 35:1, DOI: 10.3402/polar.v35.30313
384 385
Olefeldt, D., S. Goswami, G. Grosse, D. Hayes, G. Hugelius, P. Kuhry, A. D. McGuire,
386
V. E. Romanovsky, A. B. K. Sannel, E. A. G. Schuur, & M. R. Turetsky (2016), Circumpolar
387
distribution and carbon storage of thermokarst landscapes. Nature Communications, vol. 7,
388
13043. doi.org/10.1038/ncomms13043
389 390
Opel, T., J. B. Murton, S. Wetterich, H. Meyer, K. Ashastina, H. Günther, F. Grotheer,
391
G. Mollenhauer, P. P. Danilov, V. Boeskorov, G. N. Savvinov, & L. Schirrmeister (2019), Past
392
climate and continentality inferred from ice wedges at Batagay megaslump in the Northern
393
Hemisphere's most continental region, Yana Highlands, interior Yakutia. Clim. Past, 15, 1443–
394
1461, doi.org/10.5194/cp-15-1443-2019
395 396
Romanovsky, V. E., S. L. Smith, & H. H. Christiansen (2010), Permafrost Thermal State
397
in the Polar Northern Hemisphere during the International Polar Year 2007–2009: a Synthesis.
398
PPP, 21, 106-116. doi.org/10.1002/ppp.689
399 400
Rudy, A., C. A. Lamoureux, S. F. Kokelj, S. V. Smith, I. R., & J. H. England (2017),
401
Accelerating thermokarst transforms ice-cored terrain triggering a downstream cascade to the
402
ocean. GRL Vol. 44, No 21, pp. 11,080-11,087. doi.org/10.1002/2017GL074912
403 404
Schuur, E. A. G., J. Bockheim, J. G. Canadell, E. Euskirchen, C. B. Field, S. V.
405
Goryachkin, S. Hagemann, P. Kuhry, P. M. Lafleur, H. Lee, G. Mazhitova, F. E. Nelson, A.
406
Rinke, V. E. Romanovsky, N. Shiklomanov, C. Tarnocai, S. Venevsky, J. G. Vogel, & S. A.
407
Zimov (2008), Vulnerability of permafrost carbon to climate change: Implications for the global
408
carbon cycle. BioScience, 58(8), 701– 714. doi.org/10.1641/B580807
409 410
Séjourné, A., F. Costard, A. Fedorov, J. Gargani, J. Skorve, & M. Massé (2015),
411
Evolution of the banks of thermokarst lakes in central yakutia due to retrogressive thaw slump
412
activity controlled by insolation. Geomorphology 241, 31–40.
413
doi.org/10.1016/j.geomorph.2015.03.033
414 415
Schirrmeister L., E. Dietze, H. Matthes, G. Gross, J. Strauss, S. Laboor, M. Ulrich, F.
416
Kienast, & S. Wetterich (2020), The genesis of Yedoma Ice Complex permafrost – grain-size
417
endmember modeling analysis from Siberia and Alaska. E&G Quaternary Sci. J., 69, 33–53,
418
2020. doi.org/10.5194/egqsj-69-33-2020
419 420
Segal, R. A., Lantz T. C., & S. V. Kokelj (2016), Acceleration of thaw slump activity in
421
glaciated landscapes of the Western Canadian Arctic. Environmental Research Letters, Vol.
422
11, Number 3. doi.org/10.1088/1748-9326/11/3/034025
423 424 425
Shakil, S., S.E. Tank, S.V. Kokelj, J.E. Vonk, and S. Zolkos (2020). Particulate
426
dominance of organic carbon mobilization from thaw slumps on the Peel Plateau, NT:
427
Quantification and implications for stream systems and permafrost carbon release. Environmental
428
Research Letters. doi.org/10.1088/1748-9326/abac36.
429 430
Shepelev A.G., A. Kizyakov, S. Wetterich, A. Cherepanova, A. Fedorov, I.
431
Syromyatnikov & G. Savvinov (2020), Sub-surface carbon stocks in northern taiga landscapes
432
exposed in the Betagay Megaslump, Yanal upland, Yakutia. Land, 9, 305.
433
doi:10.3390/land9090305
434 435
Soloviev, P. A., (1973), Thermokarst phenomena and landforms due to frost heaving in
436
central Yakutia. Biuletyn Peryglacjalny, 23, 135–155.
437 438
Strauss, L., J. Schirrmeister, G. Grosse, D., Fortier, G. Hugelius, Ch. Knoblauch, V.
439
Romanovsky, Ch. Schädel, Th. Schneider Von Deimling, E. A. G. Schuur, D. Shmelev, M.
440
Ulrich & A. Veremeeva (2017), Deep Yedoma permafrost: A synthesis of depositional
441
characteristics and carbon vulnerability. Earth Science Reviews, vol. 172, 75-86.
442
doi.org/10.1016/j.earscirev.2017.07.007
443 444
Tohari A., M. Nishigaki, & M. Komatsu (2007), Laboratory rainfall-induced slope failure
445
with mosture xcontent measurement. J. Geotechnical and Geoenvironmental Engineering, Vol. 3,
446
issue 5, 575. doi.org/10.1061/(ASCE)1090-0241(2007)133:5(575)
447 448
Turetsky, M. R., B. W. Abbott, M. C. Jones, et al. (2020), Carbon release through abrupt
449
permafrost thaw. Nat. Geosci. 13, 138–143. doi.org/10.1038/s41561-019-0526-0
450 451
Ulrich M, G. Grosse, J. Strauss J. & L Schirrmeister (2014), Quantifying Wedge‐Ice
452
Volumes in Yedoma and Thermokarst Basin Deposits. PPP. Vol. 25, 151-161.
453
doi.org/10.1002/ppp.1810
454 455
Vonk, J.E., S.E. Tank, W.B. Bowden, I. Laurion, W.F. Vincent, P. Alekseychik, M.
456
Amyot, M.F. Billet, J. Canário, R.M. Cory, B.N. Deshpande, M. Helbig, M. Jammet, J. Karlsson,
457
J. Larouche, G. MacMillan, M. Rautio, K.M. Walter Anthony, and K.P. Wickland (2015).
458
Reviews and Syntheses: Effects of permafrost thaw on Arctic aquatic ecosystems.
459
Biogeosciences. 12: 7129-7167. doi:10.5194/bg-12-7129-2015.
460 461
Ward Jones M. K., W. H. Pollard & B. M. Jones (2019), Rapid initialization of
462
retrogressive thaw slumps in the Canadian high Arctic and their response to climate and terrain
463
factors. Environmental Research Letters, Vol. 14, Number 5. doi:10.1088/1748-9326/ab12fd
464 465
Wolfe, S., E. Kotler, & S. Dallimore (2001), Surficial characteristics and the distribution
466
of thaw landforms (1970-1999), shingle point to kay point, yukon territory. Geological Survey of
467
Canada Open File 4115. hdl.handle.net/10.4095/212842
468 469
Zwieback, S., S. V. Kokelj, F. Günther, J.. Boike, J. Grosse, & I. Hajnsek (2018),
Sub-470
seasonal thaw slump mass wasting is not consistently energylimited at the landscape scale, The
471
Cryosphere, 12, 549-564. doi.org/10.5194/tc-12-549-2018
472 473