Measuring Uncertainty at the Regional Level Using
Newspaper Text
Click here for newest version
Christopher Rauh
∗August 21, 2019
Abstract
In this paper I present a methodology to provide uncertainty measures at the regional level in real time using the full bandwidth of news. In order to do so I download vast amounts of newspaper articles, summarize these into topics using unsupervised machine learning, and then show that the resulting topics foreshadow fluctuations in economic indi-cators. Given large regional disparities in economic performance and trends within coun-tries, it is particularly important to have regional measures for a policymaker to tailor policy responses. I use a vector-autoregression model for the case of Canada, a large and diverse country, to show that the generated topics are significantly related to movements in eco-nomic performance indicators, inflation, and the unemployment rate at the national and provincial level. Evidence is provided that a composite index of the generated diverse topics can serve as a measure of uncertainty. Moreover, I show that some topics are gen-eral enough to have homogenous associations across provinces, while others are specific to fluctuations in certain regions.
Keywords: Machine Learning, Latent Dirichlet Allocation, Newspaper Text, Economic Un-certainty, Topic Model, Canada
∗Christopher Rauh: University of Montreal, CIREQ (email: [email protected]). I would
1
Introduction
The developed world was caught by surprise when the great recession unraveled. In order for policymaker to take pre-emptive actions instead of reacting to downturns ex post one requires timely indicators of uncertainty. In the mean time there has been large progress on this ground at the national level. However, countries are generally not homogenous economic units but in-stead are composed of diverse regions with large socio-economic disparities and various levels of reliance on different industries. Moreover, regional diversity is not limited to the economy but might also be characterized by varying levels of fiscal, political, and administrative disag-gregation. Therefore, trends and uncertainty at the regional level might not be highly correlated with trends and uncertainty at the aggregate level. While indicators capturing economic per-formance at the regional level tend to be scarce, we know even less about uncertainty at the regional level.
In this study I present a new methodology to capture economic uncertainty, which can be used, but is not limited, to generating uncertainty measures at the regional level. In order to do so I proceed in three steps. First, I download all articles in a database which contain a specific region’s name in the title. Second, I summarize the vast amounts of newspaper text into topics using the latent Dirichlet allocation (LDA). The LDA is an unsupervised machine learning technique which was developed by Blei, Ng and Jordan (2003). Third, I show that the generated topics foreshadow fluctuations in important economic indicators such as the unemployment rate, manufacturing sales, and inflation at the regional level. Therefore, the estimated measures serve both as a measure of latent uncertainty but can also be used to improve forecasts or nowcasts.
I use the developed methodology to provide measures related to economic fluctuations for Canadian provinces on a monthly basis from 1977 to 2018. To increase confidence in the provided measures, I show that when aggregating the estimated topics at the national level, they still provide a significant relation with economic indicators, similar to the widely used economic
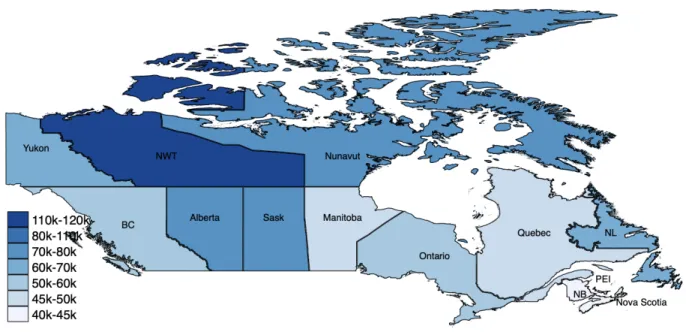
policy uncertainty (EPU) index developed by Baker, Bloom and Davis (2016). The provision of regional measures is a particular appealing case for Canada out of various reasons. As indicated in Figure 1, GDP per capita varied a lot across Canada in 2017. Across provinces GDP per capita ranged from 40,241 CAD in Prince Edward Island (PEI) to 79,353 CAD in 2017, i.e. the richest province has a GDP per capita twice the size of the poorest. The regional economies also rely on very different industries. For instance, New Brunswick relies mainly on services, while Alberta’s economy is heavily reliant on oil. In 2010 Canada had the 3rd largest regional disparities in GDP per capita amongst OECD countries (OECD 2013). The regional differences are not only reflected in levels but also in terms of growth rates. In 2017 GDP per capita only grew by 0.6% in the slowest-growing province (Nova Scotia) compared to 3.2% in the fastest-growing province (Alberta).1 From 1982 to 2017 the correlation of annual GDP growth per capita across province pairs of provinces and territories ranged from -0.18 (between Yukon and Alberta) to 0.89 (between Ontario and Quebec) and averaged 0.28 (see Appendix Table A.1). Within-country dispersions in terms of economic performance and cycles are not specific to Canada. Many countries, such as the US, have diverse regions relying on different industries, natural resources, demographics, and skill mixes of the population. These large differences in economic performance highlight the need for uncertainty measures at the regional level.
The paper contributes to the literature concerned about capturing economic uncertainty us-ing text. Bloom (2009) documents the strong negative impact uncertainty has on economic growth. While the negative impact of uncertainty seems well established, we know much less about measuring and even less about how to predict it. The paper most closely related is the seminal paper by Baker, Bloom and Davis (2016) in which the frequency of a pre-selected list of expressions, such as “economic uncertainty”, in carefully selected articles from national newspapers is used to proxy economic policy uncertainty (EPU) in the US.2In the mean time,
1The difference between the slowest growing territory, Yukon with 0.3%, and the fastest growing territory,
Nunavut with 8.1%, is even larger. We include the three Canadian territories in our analysis when data is available. However, given their sparse populations of just above 40,000 each, data is scarce.
Fig. 1: GDP per capita by province/territory in Canada in 2017
Data source: Statistics Canada.
using the Economist Intelligence Unit the World Uncertainty Index (WUI) has been extended to 143 countries (Ahir, Bloom and Furceri 2018) from 1996 onwards. The approach of using scaled frequency counts of newspaper articles that contain selected terms has also been adapted to capture volatility in equity markets (Baker et al. 2019).3 One difference compared to the before mentioned approaches is that my methodology does not impose ex ante which part of the text is important or related to uncertainty. I use almost the entire text and thereby let the data speak, which provides at least two advantages. First, using the full width of of reporting might allow picking up topics positively related to uncertainty which might not have been obvious ex ante. Second, the broad approach might help discover and exploit stabilizing topics negatively related to uncertainty.
20 countries. Azqueta-Gavaldón (2017) provides an approach to preselect newspaper articles using LDA, thereby reducing the necessity to manually select articles.
3In earlier work, Romer and Romer (2010) use congressional records and presidential speech to infer possible
tax changes and document their negative effect on the economy. Relatedly, Hassan et al. (2017) use conference-call transcripts to gauge firm-level political risk based on the share of conversations devoted to politics. Bloom (2014) provides an overview of the literature on uncertainty. Other approaches rely on indirect measures, i.e. they back out implied risk using DSGE models (e.g. Born and Pfeifer 2014, Fernández-Villaverde et al. 2015). In general, most of the business-cycle literature in macroeconomics relies on so called news shocks, which are not actually related to published news.
The main contribution of this paper is to be the first, to the best of my knowledge, to pro-vide a methodology to capture uncertainty at the regional level, or any other disaggregated level, while other approaches only provide uncertainty measures at the national level. This disaggre-gation is made possible by assigning articles within newspapers to regions, while Baker, Bloom and Davis (2016), for instance, assign newspaper text within a country to that specific country. Given that regional newspapers also cover national topics, using regional newssources would not help overcome the problem. In the related paper by Ahir, Bloom and Furceri (2018) they overcome this problem by using one comprehensive newssource, i.e. the Economist Intelligence Unit. However, the lack of density in articles per country only allows to construct the WUI at an annual rate at the country level. While the presented paper only deals with provinces in Canada, access to other newspaper databases would easily allow the extension to other regions and coun-tries. Given that the main source of data is newstext, another advantage is that uncertainty or performance measures could even be provided on a daily basis. Moreover, the methodology can be fully automized and does not rely on expert judgements and only minimal decisions by a user.
This paper also contributes to the rapidly growing literature summarizing text through ma-chine learning techniques in economics.4 For instance, Hansen, McMahon and Prat (2017) use LDA to summarize minutes published by the Federal Open Market Committee to investigate the effect of transparency on policymakers behavior. Gentzkow and Shapiro (2010) use newspaper text to understand biases in the newspaper market and the demand and supply of slant. Scott and Varian (2013) and Baker and Fradkin (2017) use Google searches to estimate macroeco-nomic variables such as unemployment claims, retail sales, and consumer sentiment that have only been available at lower frequencies from survey data. Mueller and Rauh (2018, 2019) use newspaper topics estimated through LDA to predict civil wars in a panel of countries. LDA has also been used to forecast Norwegian economic indicators by Thorsrud (2018) and Larsen and
Thorsrud (2019). However, none of these approaches provide regional indicators.
The rest of the paper is organized as follows: In Section 2 I describe the sources of newstext and criteria for including articles. Section 3 presents how the text was transformed into topics using unsupervised machine learning and present details on the estimated topics. In Section 4 I relate the estimated topics to fluctuations in economic indicators at the national and provin-cial level. Finally, Section 5 summarizes the findings and outlines open questions for future research.
2
Collecting text
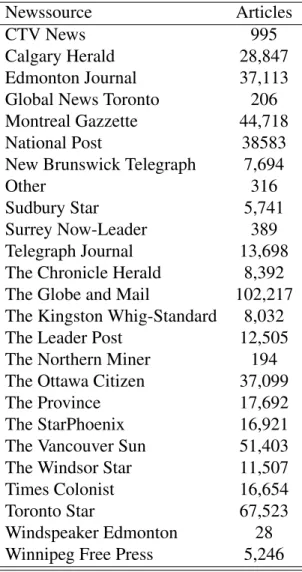
In order to collect data, I adapt the methodology used by Mueller and Rauh (2018, 2019) to the regional level. I download newspaper articles containing one of the province or territory names, or abbreviations thereof, in the title and assign each article to the respective region.5 The articles spanning from 1977 until June 2019 are manually downloaded from a database of a wide range of Canadian newssources including the National Post, Calgary Herald, Edmonton Journal, Montreal Gazette, Ottawa Citizen, Regina Leader Post, The Globe and Mail, Vancouver Sun, and the Victoria Times-Colonist.
Before parsing the text, I drop 66,480 articles classified as sports articles. This approach is in contrast to Mueller and Rauh (2018, 2019) who use all articles under the assumption that sportsreporting might signal the absence of risk of civil war. The rational behind drop-ping sports articles in my context is the assumption that in a highly developed country such as Canada regional reporting on sports takes place independent of the business cycle, economic performance, or economic uncertainty.6 In Table 1 I show the distribution of remaining articles across newssources. The most articles come from The Globe and Mail with 102,217. The goal
5See Appendix Table A.2 for all search terms. The ten Canadian provinces are Alberta, British Columbia,
Manitoba, New Brunswick, Newfoundland and Labrador, Nova Scotia, Ontario, Prince Edward Island, Quebec, and Saskatchewan, while the three territories are Northwest Territories, Nunavut, and Yukon.
Table 1: Articles per newssource
Newssource Articles
CTV News 995
Calgary Herald 28,847
Edmonton Journal 37,113
Global News Toronto 206
Montreal Gazzette 44,718
National Post 38583
New Brunswick Telegraph 7,694
Other 316
Sudbury Star 5,741
Surrey Now-Leader 389
Telegraph Journal 13,698
The Chronicle Herald 8,392
The Globe and Mail 102,217
The Kingston Whig-Standard 8,032
The Leader Post 12,505
The Northern Miner 194
The Ottawa Citizen 37,099
The Province 17,692
The StarPhoenix 16,921
The Vancouver Sun 51,403
The Windsor Star 11,507
Times Colonist 16,654
Toronto Star 67,523
Windspeaker Edmonton 28
Winnipeg Free Press 5,246
is that the content of the remaining 533,713 articles, which will be summarized into topics using machine learning in the following section, reflects the evolution of the situation and uncertainty of each region over time.
3
Summarizing text into topics
In the next step, these vast amounts of news are transformed into interpretable topics using machine learning algorithms based on the Latent Dirichlet Allocation. This methodology was
developed by Blei, Ng and Jordan (2003) and allows to reduce the dimensionality of text to any number of topics specified by the user. Before applying the machine learning algorithm, the text is subject to standard pre-analysis procedures when conducting text mining. Stopwords, which are common words not conveying much information, such as ‘the’ or ‘it’, are removed. These words are selected based on existing dictionaries assembled by linguists. Then words are stemmed and lemmatized, meaning they are transformed into their roots with the idea being that ‘run’, ‘ran’ and ‘running’ all end up being the same token. Next two and three words combinations are formed in order to capture frequent and meaningful sequences such as ‘united nations’. Finally, overly frequent, i.e. appearing in more than half of all articles, and rare words, i.e. appearing in less than 10 articles, are removed across articles as they provide little information to learn from. The former would be too general, and the latter too specific. I also intend to remove the names of municipalities and male and female names using corresponding dictionaries.
After these modifications, 14,3540,058 tokens made up of 582,080 unique tokens across 533,699 articles can be fed into the machine learning algorithm, which backs out the topics.7 The algorithm learns from the co-occurrence of words in articles through Bayesian learning. The idea is that if certain expressions tend to appear in the same articles, they are likely to be linked to each other. In technical terms, borrowing from Blei, Ng and Jordan (2003), the corpus D is composed of documents w of words. A topic is a probability distribution over all words. The assumed underlying process with which topics generate the text is by drawing θ from a Dirichlet distribution with hyperparameter α. Then for each word n until length N of the document, one chooses a topic from zn. After that a word wnis chosen for the corresponding
topic znfrom a Dirichlet distribution with hyperparameter β .
Written formally, the generative process of text is expressed as the following joint
tion p(β , θ , z, wd) = k
∏
i=1 p(βi) D∏
d=1 p(θd)( N∏
n=1 p(zd,n|θd)p(wd,n|β , zd,n)).Given the corpus of text, the task of the algorithm is to infer the topic specific word distribution and the document specific topic distribution. So the posterior distribution of the latent variables is given by
p(β , θ , z|wd) =
p(β , θ , z, wd)
p(wd)
.
Inferring the marginal distribution p(wd) is done through approximation using Gibbs sampling,
or Variational Kalman Filtering and Variational Wavelet Regression. One assumption underly-ing LDA, is that the order of the words does not matter, which to a mild extent is overcome by including two- and three-word combinations. The user only has to specify hyperparameters α and β , and the number of topics k. For the number of topics I choose 30 and for α and β I use the standard values of α = 50/k and β = 0.01. The final output of the algorithm is the word distributions of the topics and the topic distributions of the articles. With this information at hand, I can collapse the article-level information to a panel of countries or regions containing the news content summarized into just a few variables.
3.1
Estimated topics
In Figure 2 we see four of the 30 topics estimated using major daily Canadian newspapers. These words are only the tip of the iceberg as each topic is a probability distribution across all tokens. Each cloud contains the most prominent words of a given topic. The size of a word is proportional to its importance within the topic, while the location conveys no information and is only for expositional purposes.
Fig. 2: Word clouds of four selected topics
(a) Investment (b) Federal
(c) Energy (d) Goverment
Notes: These are the top 50 words of four out of 30 topics computed using LDA with α = 1.67 and β = 0.01. The size of a term represents its probability within a given topic. The position conveys no information. A list of
the 30 topics is exhibited in Appendix Table A.3.
The top left cloud seems to be based on investment related activity as suggested by ‘com-pani’, ‘invest’, and ‘profit’. The top right cloud appears to represent politics dealing with feder-alism as indicated by stems such as ‘feder’, ‘provinc’, ‘territori’, and ‘agreement’. The bottom left word cloud suggests a topic related to energy indicated by prominent word stems such as ‘oil’, ‘gas’, ‘pipelin’, and ‘energi’. The bottom right cloud seems to represent political proce-dures and events that have to due with the government as signaled by ‘govern’, ‘legislatur’, and ‘premier’. Please bear in mind that I assigned the arbitrary labels investment, federal, energy,
and government ex-post. These topics have been formed without any ex-ante information con-cerning which topics might exist or might be preferred by the user. They have been formed purely based on the co-occurrence of expressions.
3.2
Topics across time and space
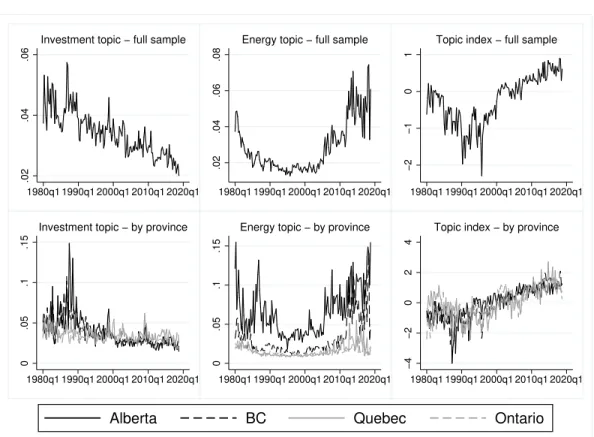
In Figure 3 we see how the investment topic (left) and the energy topic (right) evolve at the aggregate level (top) and across the four most populated provinces (bottom). On the one hand, we see there has been a secular decline in the investment topic at the national level and across all provinces. On the other hand, we see that the energy topic follows a U-shaped profile. More-over, we see that the energy topic has a much higher average coverage in Alberta, a province heavily reliant on the oil industry, compared to the other provinces.
Finally, I include an index of five topics which is computed by extracting the first factor from five topics described in the Section 4. This composite measure, as it turns out, can be interpreted as my measure of uncertainty. The topic index indicates that uncertainty has risen substantially since the 90’s not only at the national level, as has been documented by the EPU, but also within each of the major provinces.
Fig. 3: Topics across time and space
.02
.04
.06
1980q1 1990q1 2000q1 2010q1 2020q1
Investment topic − full sample
.02
.04
.06
.08
1980q1 1990q1 2000q1 2010q1 2020q1
Energy topic − full sample
−2
−1
0
1
1980q1 1990q1 2000q1 2010q1 2020q1
Topic index − full sample
0
.05
.1
.15
1980q1 1990q1 2000q1 2010q1 2020q1
Investment topic − by province
0
.05
.1
.15
1980q1 1990q1 2000q1 2010q1 2020q1
Energy topic − by province
−4 −2 0 2 4 1980q1 1990q1 2000q1 2010q1 2020q1
Topic index − by province
Alberta BC Quebec Ontario
Notes: The topic index is the first factor extracted from five topics described in Section 4.
The presented topics clearly cover different facets of a country’s or province’s situation in terms of politics and economics. The figure shows us that there is substantial variation within topics and across regions. In the following sections we will see whether these fluctuations are systematic and are related to important economic indicators.
4
Relating topics to economic outcomes
In order to relate the generated topics to economic outcomes they are fed into a vector-autoregression model to relate them to economic activity, such as the unemployment rate, manufacturing out-put, and inflation.8 This is not an exercise meant to discover causal relationships. However, by establishing a relationship between the generated topics and fluctuations in economic outcomes,
I should be able to demonstrate that newssources contain deeper information which is useful to predict economic uncertainty beyond the information contained in keyword counts. These measures would be extremely useful for policymakers to cushion economic shocks and could be generated in real time at the country or even regional level. In Section 4.1 I investigate whether topics are related to economic performance and how economic outcomes react to shocks to top-ics at the national level and compare these responses to those to a shock to the EPU index. In Section 4.2 I then show how topics relate to economic movements at the provincial level.
4.1
Relating topics to economic outcomes at the national level
In order to get an idea of whether topics are related to economic activity, I run a lasso with monthly log GDP per capita at the aggregate level, i.e. for all of Canada, as the dependent variable and include all topics, EPU, and a linear time trend. The sample is restricted by the fact that monthly GDP is only available as of 1997. Then I select the five topics out of the 30 which are the best predictors. In Table 2 I show the results from OLS regressions in which I separately regress Canadian monthly log GDP per capita on the EPU and on the five preselected topics. All variables are standardized to mean zero and a standard deviation of one. The mean and standard deviations of the regressors are presented at the bottom of the table for each column. I also include a linear time trend and a constant.
In the first column we see that the EPU has a strong and significantly negative relationship with monthly GDP per capita in Canada. A one standard deviation increase in EPU is associated with a 0.2 standard deviation drop in GDP per capita. The R2of this regression is 0.843, though I shall note that the linear time trend alone already achieves an R2 of 0.812. In the following columns we see the results for the chosen topics. The association between the independence topic and GDP per capita is even stronger with a coefficient almost twice in magnitude, i.e. 0.38, and a slightly higher R2.9 Only for the Federal topic we see a similarly strong and significant
relationship in this format. Including all five topics and EPU together shows that they seem to capture different situations as again the coefficients for EPU, the independence topic, and the federal topic are significant with a magnitude around -0.2.
Table 2: GDP per capita at aggregate level in Canada
(1) (2) (3) (4) (5) (6) (7) (8) EPU -.198*** -.173*** -.183*** (.030) (.028) (.030) Topics Independence -.378*** -.239*** (.053) (.057) Energy -.059* -.021 (.034) (.029) Investment -.067 -.055 (.056) (.048) Federal -.388*** -.216*** (.063) (.068) Government .063 .078* (.047) (.040) Topic index -.431*** (.073) Mean∗ 131 .037 .029 .035 .038 .034 0 Standard deviation∗ 77 .021 .016 .009 .018 .011 1
Linear trend Yes Yes Yes Yes Yes Yes Yes Yes
Observations 267 267 267 267 267 267 267 267
R2 0.843 0.847 0.820 0.819 0.840 0.819 0.874 0.854
Note:∗Mean and standard deviation of explanatory variable before standardizing.
All regressions include a constant and a linear time trend. The topic index is the first factor extracted from the five topics.
Next we replace the five topics by the first factor which we extracted from the five topics. This index has a correlation of close to 0.5 with EPU, but as can be seen in column (7) of Table 2 also captures meaningful variation distinct from EPU. The coefficient is highly significant and more than twice the the size of the coefficient of EPU. These correlations are encouraging but open to interpretation.
To take closer look at whether the chosen topics and the topic index predict economic indi-cators, I use a vector-autoregression model (VAR) at the aggregate level with two lags, similar to the ones in Baker, Bloom and Davis (2016) and Ahir, Bloom and Furceri (2018). In addition to the topics, I include the EPU, unemployment rate, log GDP per capita, and inflation rate.
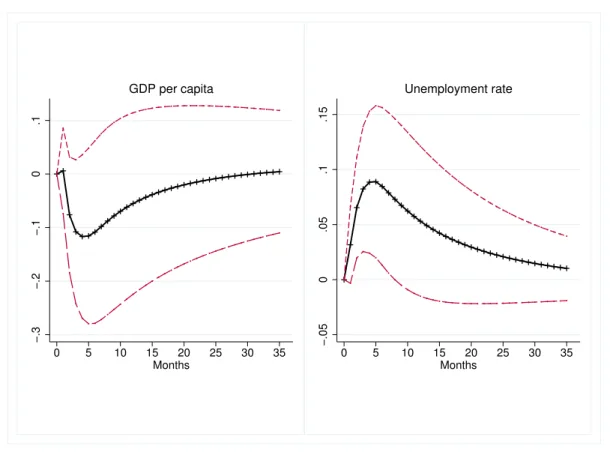
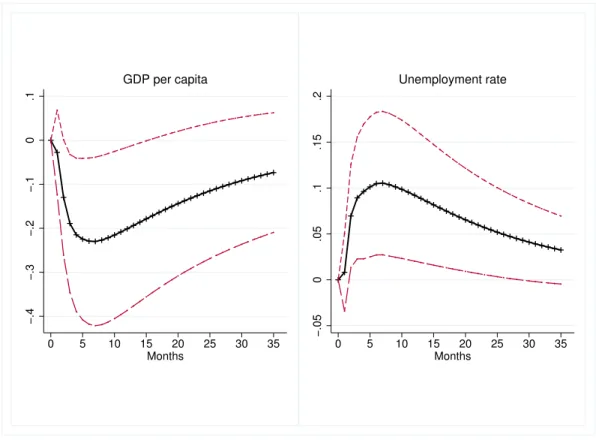
In Figure 4 I present the impulse response and 90% confidence interval of log GDP per capita (left) and the unemployment rate (right) to a one standard deviation shock to the investment topic. While the dip in GDP per capita is only marginally significant after 4-5 months, the large spike in the unemployment rate is clear and considerable. Both shocks take approximately three years to fully tamper off. As a comparison I present the corresponding impulse response to a one standard deviation shock to EPU in Appendix Figure A.1. There we see that the uncovered relationships are very similar.
Fig. 4: Impulse response of Canadian economy to one standard deviation shock to investment topic −.3 −.2 −.1 0 .1 0 5 10 15 20 25 30 35 Months GDP per capita −.05 0 .05 .1 .15 0 5 10 15 20 25 30 35 Months Unemployment rate
In order to reduce the dimensionality, I again replace the five topics with the first factor run-ning the same VAR including EPU. We now see in Figure 5 that a one standard deviation shock to the composite topic index is associated with larger and more significant responses in both unemployment and GDP per capita in Canada. This serves as evidence that the chosen topics,
and in particular the topic index, capture latent information preceding economic movements. Fig. 5: Impulse response of Canadian economy to one standard deviation shock to topic index
−.4 −.3 −.2 −.1 0 .1 0 5 10 15 20 25 30 35 Months GDP per capita −.05 0 .05 .1 .15 .2 0 5 10 15 20 25 30 35 Months Unemployment rate
Notes: The topic index is the first factor extracted from the five topics.
4.2
Relating topics to economic outcomes at the provincial level
We saw that the estimated topics foreshadow economic movements at the national level in a similar fashion as the EPU index. However, the ultimate goal of this exercise is to relate topics to economic performance at the provincial level. To safeguard against overfitting when selecting which topics out of the 30 to relate to economic outcomes, I include the same five topics as at the country level. In Section 4.2.1 I look at how topics foreshadow economic performance in a panel VAR in order to see whether topics can capture the same movements across provinces. Then in Section 4.2.2 I look into whether some topics are specific to some provinces in a case study.
4.2.1 Jointly at the provincial level
Following a similar approach as at the aggregate level, I estimate a panel VAR at the provincial level while using log manufacturing sales per capita instead of log GDP, as it is not available at a monthly frequency at the provincial level. Moreover, I include province specific fixed effects for each included variable. All the variables are available from 1992 onwards across the 10 provinces. I do not include EPU as the index is not available at the provincial level.10
In Figure 6 I plot the impulse response of province-level unemployment to a one standard deviation shock to four of the five included topics. In the top left panel we see that there is no significant response to the investment topic. However, in the top right panel we see a significant and considerable response to the federal topic. After five months the unemployment rate is still more than 7 percentage points higher. In the bottom two panels we see that for the energy (left) and the government (right) topic the response is also significant albeit smaller at up to 3 percentage points.
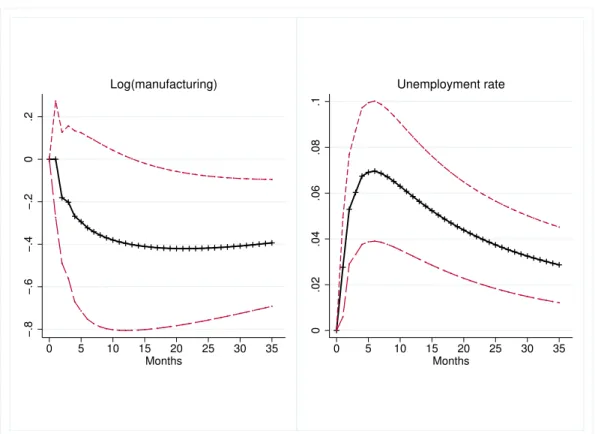
In Figure 7 I show how monthly log manufacturing sales per capita at the province level respond to a one standard deviation shock to the same topics. In the top panels we see that a one standard deviation shock to the investment topic (left) and the federal topic (right) are associated with a significantly negative and lasting dip in manufacturing sales. In the bottom we see that shocks to the energy (left) and government (right) topic also are followed by drops in manufacturing. However, for these two topics the the effect is not always clearly different from zero.
Each of the five topics captures a different type of latent information predicting the move-ment of economic outcomes. Despite these nuances, I show in Figure 8 that the composite of the five topics, i.e. the extracted first factor, is also a strong predictor of movements in manufac-turing output and the unemployment rate. I refrain from causal interpretations here as for VARs
10In order to compute EPU at the provincial level one would require provincial newspapers almost exclusively
Fig. 6: Impulse response of provincial unemployment rate to one standard deviation shock to different topics −.04 −.02 0 .02 .04 0 5 10 15 20 25 30 35 Months Investment topic 0 .05 .1 .15 0 5 10 15 20 25 30 35 Months Federal topic −.02 0 .02 .04 .06 0 5 10 15 20 25 30 35 Months Energy topic −.02 0 .02 .04 .06 0 5 10 15 20 25 30 35 Months Government topic
Notes: The displayed response is of the monthly unemployment rate at the province level.
they are to be taken with care. What we do learn from this exercise, though, is that the topics generated through unsupervised machine learning using vast amounts of newspaper text fore-shadow economic outcomes and activity at the provincial level in a meaningful way. Therefore, I argue that the topic index is a valid measure of economic uncertainty at both the national and regional level.
Fig. 7: Impulse response of provincial manufacturing sales to one standard deviation shock to different topics −1 −.5 0 .5 0 5 10 15 20 25 30 35 Months Investment topic −1.5 −1 −.5 0 .5 0 5 10 15 20 25 30 35 Months Federal topic −1 −.8 −.6 −.4 −.2 0 0 5 10 15 20 25 30 35 Months Energy topic −.6 −.4 −.2 0 .2 0 5 10 15 20 25 30 35 Months Government topic
Fig. 8: Impulse response of provincial economic indicators to one standard deviation shock to topic index −.8 −.6 −.4 −.2 0 .2 0 5 10 15 20 25 30 35 Months Log(manufacturing) 0 .02 .04 .06 .08 .1 0 5 10 15 20 25 30 35 Months Unemployment rate
4.2.2 Separately at the provincial level
So far it has been assumed that topics and economic outcomes display homogenous responses across provinces. However, this might not be the case for all topics. In order to provide an example I look at a very specific topic, the independence topic, which prominently features words such as ‘french’, ‘referendum’, ‘sovereignti’, and ‘separ’ as can be seen in Figure 9. This topic obviously is related to the independentist movement in Quebec which led to referenda held in 1980 and 1995. In both referenda the remain fraction achieved narrow victories but the uncertainty is claimed to have led to multiple banks and companies moving their headquarters, often to Toronto, which lies in Ontario. The most prominent case of what has been coined the ‘Montreal Effect’ is the Bank of Montreal moving their headquarters from Montreal to Toronto.
Fig. 9: Independence topic word cloud
Given that this topic is a regional phenomena we might imagine that reporting on it might have a differential impact across provinces. In order to look into this, I separately estimate the same VAR as in the previous section for Ontario and Quebec. The impulse response to a
(top) and Ontario (bottom). On the left side we see that the response of manufacturing sales in Quebec seems mildly negative and flat for Ontario. Now for the unemployment rate we see a mild positive response in Quebec, while for the case of Ontario we actually see a significant drop in unemployment.
Fig. 10: Impulse response to one standard deviation shock to independence topic in Quebec (top) and Ontario (bottom)
−.6 −.4 −.2 0 .2 .4 0 5 10 15 20 25 30 35 Months Log(manufacturing) (Quebec) −.04 −.02 0 .02 .04 .06 0 5 10 15 20 25 30 35 Months
Unemployment rate (Quebec)
−1 −.5 0 .5 1 0 5 10 15 20 25 30 35 Months Log(manufacturing) (Ontario) −.2 −.15 −.1 −.05 0 .05 0 5 10 15 20 25 30 35 Months
Unemployment rate (Ontario)
Notes: The displayed response is of monthly log manufacturing sales per capita at the province level.
While these figures are only indicative, they suggest two things. First, for this case in particular the results show that reporting on independence, in accordance with the narrative of the ‘Montreal Effect’, if anything, is associated with negative outcomes in Quebec, and, maybe more surprisingly, positive outcomes in Ontario. Second, speaking more general, while I had established in the previous section that topics can be general enough to foreshadow economic indicators in the same manner across diverse provinces, the results in this section hint at the possibility of uncovering topics which relate to provincial indicators in contrasting manners.
5
Conclusions
In this paper I show that vast amounts of newspaper text summarized into topics through un-supervised machine learning foreshadow economic fluctuations at the regional level. Countries are composed of diverse regions depending on different industries. In the age of big data there is no reason why we should not have more detailed information on regional economic perfor-mance and indicators predicting sudden changes. In this paper I fill this gap and present a way in which to obtain timely measures covering a wide range of topics over long time periods.The need for timely indicators is highlighted by the lag with which government statistics are pub-lished. The long time periods can be particularly useful if we require large samples to train a model.
I show that for the case of Canada that topics covering investment activity, governmental actions, or energy markets are predictive of fluctuations in important provincial indicators such as manufacturing sales and the unemployment rate. Moreover, the composite topic index is shown to be a valid measure of uncertainty both nationally and regionally. While some topics are general enough to forecast movements across provinces in the same direction, I show that other topics are more specialized, such as one related to the independence movement in Quebec, and predict increases in unemployment in one region but decreases in another. The proposed methodology is not specific to the regions of Canada. With access to databases of newstext covering other countries, the same exercise could easily be repeated to, for instance, provide indicators for the US at the state, county, or even municipal level.
Given that I solely focus on the composition of articles rather than the frequency of ap-pearances of keywords, the presented methodology also safeguards against large fluctuations in the number of articles due to issues of access or availability. In terms of inputs, the methodol-ogy could be extended using different sources of expert information, such as television, radio, blogs, or government reports. In terms of output, the estimated topics could be used to improve
forecasts and nowcasts. These extensions, however, are left for future research.
References
Ahir, Hites, Nicholas Bloom, and Davide Furceri. 2018. “The World Uncertainty Index.” Available at SSRN 3275033.
Azqueta-Gavaldón, Andrés. 2017. “Developing news-based economic policy uncertainty in-dex with unsupervised machine learning.” Economics Letters, 158: 47–50.
Baker, Scott R, and Andrey Fradkin. 2017. “The Impact of Unemployment Insurance on Job Search: Evidence from Google Search Data.” Review of Economics and Statistics, 99(5): 756–768.
Baker, Scott R, Nicholas Bloom, and Steven J Davis. 2016. “Measuring economic policy uncertainty.” Quarterly Journal of Economics, forthcoming.
Baker, Scott R, Nicholas Bloom, Steven J Davis, and Kyle J Kost. 2019. “Policy News and Stock Market Volatility.” National Bureau of Economic Research.
Blei, David M, Andrew Y Ng, and Michael I Jordan. 2003. “Latent Dirichlet allocation.” The Journal of Machine Learning Research, 3: 993–1022.
Bloom, Nicholas. 2009. “The impact of uncertainty shocks.” Econometrica, 77(3): 623–685. Bloom, Nicholas. 2014. “Fluctuations in uncertainty.” Journal of Economic Perspectives,
28(2): 153–76.
Born, Benjamin, and Johannes Pfeifer. 2014. “Policy risk and the business cycle.” Journal of Monetary Economics, 68: 68–85.
Fernández-Villaverde, Jesús, Pablo Guerrón-Quintana, Keith Kuester, and Juan Rubio-Ramírez. 2015. “Fiscal volatility shocks and economic activity.” American Economic Re-view, 105(11): 3352–84.
Gentzkow, Matthew, and Jesse M Shapiro. 2010. “What drives media slant? Evidence from US daily newspapers.” Econometrica, 78(1): 35–71.
Gentzkow, Matthew, Bryan T Kelly, and Matt Taddy. 2017. “Text as data.” National Bureau of Economic Research.
Hansen, Stephen, Michael McMahon, and Andrea Prat. 2017. “Transparency and delib-eration within the FOMC: a computational linguistics approach.” The Quarterly Journal of Economics, 133(2): 801–870.
Hassan, Tarek A, Stephan Hollander, Laurence van Lent, and Ahmed Tahoun. 2017. “Firm-level political risk: Measurement and effects.” National Bureau of Economic Re-search.
Larsen, Vegard H, and Leif A Thorsrud. 2019. “The value of news for economic develop-ments.” Journal of Econometrics, 210(1): 203–218.
Mueller, Hannes, and Christopher Rauh. 2018. “Reading Between the Lines: Prediction of Political Violence Using Newspaper Text.” American Political Science Review, 112(2): 358– 375.
Mueller, Hannes Felix, and Christopher Rauh. 2019. “The hard problem of prediction for conflict prevention.” CEPR Discussion Paper No. DP13748.
Romer, Christina D, and David H Romer. 2010. “The macroeconomic effects of tax changes: estimates based on a new measure of fiscal shocks.” American Economic Review, 100(3): 763–801.
Scott, Steven L, and Hal R Varian. 2013. “Bayesian variable selection for nowcasting eco-nomic time series.” National Bureau of Ecoeco-nomic Research.
Thorsrud, Leif Anders. 2018. “Words are the new numbers: A newsy coincident index of the business cycle.” Journal of Business & Economic Statistics, 1–17.
Appendix
A
Additional tables and figures
Table A.1: Correlations of annual GDP per capita growth 1982-2017
Province AB BC MB NB NL NS NT NU ON PE QC SK YT Alberta 1.000
British Columbia 0.606 1.000 Manitoba 0.542 0.454 1.000 New Brunswick 0.063 0.336 0.055 1.000 Newfoundland & Labrador 0.307 0.407 0.224 0.476 1.000 Nova Scotia 0.108 0.131 0.399 0.462 0.418 1.000 Northwest Territories 0.202 0.269 0.060 0.506 0.543 0.470 1.000 Nunavut 0.358 0.096 0.388 0.136 0.245 0.218 0.078 1.000 Ontario 0.507 0.584 0.596 0.561 0.405 0.554 0.289 0.193 1.000 Prince Edward Island 0.026 0.127 0.008 0.649 0.334 0.036 -0.051 -0.128 0.451 1.000 Quebec 0.561 0.652 0.596 0.535 0.463 0.455 0.442 0.341 0.891 0.348 1.000 Saskatchewan 0.450 0.231 0.428 0.127 0.267 -0.096 0.196 0.547 0.174 0.071 0.245 1.000 Yukon -0.176 0.113 0.098 0.204 -0.084 0.066 -0.141 0.301 0.079 0.113 0.113 -0.111 1.000
Table A.2: Search terms and number of articles by province/territory
Search terms Articles
Provinces Alberta 69,769 British Columbia or B.C. 126,378 Manitoba 16,400 New Brunswick or N.B. 24,341 Newfoundland or Labrador or N.L. 11,504 Nova Scotia or N.S. 21,328 Ontario 116,915
Prince Edward Island or P.E.I. 4,213
Quebec 103,182 Saskatchewan or Sask. 32,832 Territoties Northwest Territories or N.W.T. 1,849 Nunavut 1,819 Yukon 3,169
Fig. A.1: Impulse response function to one standard deviation shock to EPU
−.4 −.3 −.2 −.1 0 .1 0 5 10 15 20 25 30 35 Months GDP per capita 0 .05 .1 .15 .2 0 5 10 15 20 25 30 35 Months Unemployment rate
Table A.3: Top ten keywords and topic names of all 30 topics
Topic name Top ten keywords
Education school, student, educ, univers, program, teacher, board, child, parent, high Urban citi, hous, home, build, municip, communiti, new, say, properti, resid Culture film, art, book, music, work, artist, play, perform, new, festiv
Food store, food, farm, wine, farmer, produc, product, beer, agricultur, restaur Tourism park, hotel, visit, tour, lake, travel, summer, island, room, mountain Government govern, premier, ndp, legislatur, liber, new, leader, harri, cabinet, yesterday
Federal feder, govern, provinc, nation, feder_govern, constitut, deal, provinci, agreement, propos Immigration immigr, peopl, war, group, countri, church, state, communiti, world, unit
Health child, peopl, woman, health, case, death, diseas, cancer, test, drug Justice court, law, case, rule, lawyer, judg, legal, right, justic, decis
Independence french, english, languag, referendum, bouchard, quebecoi, speak, francophon, sovereignti, independ Investment compani, million, share, bank, invest, financi, market, oper, investor, fund
Industry industri, busi, trade, product, econom, develop, market, new, compani, job Environment water, environ, environment, govern, plan, chang, provinc, carbon, climat, use Health care health, care, hospit, doctor, patient, servic, nurs, medic, provinc, healthcare
Generic like, way, peopl, make, think, thing, time, polit, chang, good Technology servic, compani, use, new, oper, air, network, ferri, base, comput Power power, hydro, electr, energi, project, generat, plant, cost, new, util
Labor job, worker, union, work, govern, employe, employ, strike, labour, contract Police polic, charg, offic, rcmp, investig, man, crime, arrest, murder, kill
Politics parti, liber, elect, vote, conserv, campaign, leader, support, polit, poll Fiscal policy tax, govern, million, provinc, budget, billion, cut, spend, money, fund Daily life say, peopl, famili, like, time, old, work, life, home, know
Public report report, public, govern, inform, commiss, review, committe, board, offic, recommend Fishing industry fish, water, river, area, island, coast, kilometr, peopl, lake, flood
Forestry forest, land, area, bear, anim, say, northern, park, tree, log
Public finance cent, rate, increas, provinc, averag, growth, number, report, price, economi Energy oil, gas, project, energi, pipelin, natur, price, resourc, compani, billion Sports game, team, play, event, club, win, award, sport, second, member