HAL Id: hal-00991494
https://hal.archives-ouvertes.fr/hal-00991494
Submitted on 18 May 2021
HAL is a multi-disciplinary open access
archive for the deposit and dissemination of
sci-entific research documents, whether they are
pub-lished or not. The documents may come from
teaching and research institutions in France or
abroad, or from public or private research centers.
L’archive ouverte pluridisciplinaire HAL, est
destinée au dépôt et à la diffusion de documents
scientifiques de niveau recherche, publiés ou non,
émanant des établissements d’enseignement et de
recherche français ou étrangers, des laboratoires
publics ou privés.
geomorphological studies, GPS data, and crustal
seismicity
A. Alvadaro, L. Audin, J.M. Nocquet, Sandra Lagreulet, M. Segovia, Y. Font,
G. Lamarque, H. Yepes, Patricia Mothes, Frédérique Rolandone, et al.
To cite this version:
A. Alvadaro, L. Audin, J.M. Nocquet, Sandra Lagreulet, M. Segovia, et al.. Active tectonics in Quito,
Ecuador, assessed by geomorphological studies, GPS data, and crustal seismicity. Tectonics, American
Geophysical Union (AGU), 2014, 33 (2), pp.67-83. �10.1002/2012TC003224�. �hal-00991494�
Active tectonics in Quito, Ecuador, assessed
by geomorphological studies, GPS data,
and crustal seismicity
A. Alvarado1,2, L. Audin2, J. M. Nocquet3, S. Lagreulet4,5, M. Segovia1, Y. Font3, G. Lamarque6, H. Yepes1, P. Mothes1, F. Rolandone7, P. Jarrín1, and X. Quidelleur4,5
1
Instituto Geofísico, Escuela Politécnica Nacional, Quito, Ecuador,2Institut des Sciences de la Terre IRD: UR219, CNRS: UMR5275–IFSTTAR–Université de Savoie–Université Joseph Fourier, Grenoble, France,3Géoazur, CNRS UMR 7329,
Université de Nice Sophia-Antipolis, Institut de Recherche pour le Développement (UR 082), Observatoire de la Côte d’Azur, Valbonne, France,4Université Paris-Sud, Laboratoire IDES, UMR8148, Orsay, France,5CNRS, Orsay, France,6Géoazur,
Université de Nice Sophia-Antipolis, Observatoire de la Côte d’Azur, Nice, France,7ISTEP, Université Pierre et Marie Curie Paris VI, Paris, France
Abstract
The Quito Fault System (QFS) extends over 60 km along the Interandean Depression in northern Ecuador. Multidisciplinary studies support an interpretation in which two major contemporaneous fault systems affect Quaternary volcanoclastic deposits. Hanging paleovalleys and disruption of drainage networks attest to ongoing crustal deformation and uplift in this region, further confirmed by 15 years of GPS measurements and seismicity. The resulting new kinematic model emphasizes the role of the N-S segmented, en echelon eastward migrating Quito Fault System (QFS). Northeast of this major tectonic feature, the strike-slip Guayllabamba Fault System (GFS) aids the eastward transfer of the regional strain toward Colombia. These two tectonic fault systems are active, and the local focal mechanisms are consistent with the direction of relative GPS velocities and the regional stress tensor. Among active features, inherited N-S direction sutures appear to play a role in confining the active deformation in the Interandean Depression. The most frontal of the Quito faults formed at the tip of a blind thrust, dipping 40°W, is most probably connected at depth to inactive suture to the west. A new GPS data set indicates active shortening rates for Quito blind thrust of up to 4 mm/yr, which decreases northward along the fold system as it connects to the strike-slip Guayllabamba Fault System. The proximity of these structures to the densely populated Quito region highlights the need for additional tectonic studies in these regions of Ecuador to generate further hazard assessments.1. Introduction
The mountain range of Ecuador belongs to the northern termination of the Andean belt, which extends along the Pacific margin of South America. Intracontinental deformation in Ecuador results from a complex geo-logic history along the subduction margin [Jaillard et al., 2009]. Currently, the oceanic plate is converging eastward at 6 cm/yr relative to South America [White et al., 2003]. Part of the obliquity is accommodated in the upper plate by the northward translation of the North Andean Block (NAB) to the NNE relative to South America [Pennington., 1981]. The Andean chain in Ecuador displays two main ranges, trending roughly north and parallel to the trench (Figure 1). The Eastern metamorphic and Western volcanic Cordilleras are separated by the Interandean Depression (ID, Figure 1),filled by a Pliocene-Quaternary basin [Lavenu et al., 1995]. The known limits of the NAB are localized south from the Riobamba region (Figure 1) and distributed east from the Western Cordillera to the eastern Subandean Front [Ego and Sébrier, 1996]. Similarly, the southernmost termination of the ID is connected southward to the major right-lateral strike-slip Pallatanga fault trending N30° (Figure 1) [Winter et al., 1993]. But much less is known about the northernmost termina-tion or prolongatermina-tion of the ID north of Ecuador. Indeed, to link the Pallatanga fault kinematically with the main northern Andean block boundary in southeastern Colombia [Pennington, 1981], a restraining bend across the Ecuadorian Andean chain must be inferred [Ego and Sébrier, 1996; Hibsch et al., 1997; Lavenu et al., 1995; Gutscher et al., 1999]. However, these geometries and GPS data are interpreted by Trenkamp et al. [2002] to indicate distributed transpressive motion across the NAB or elastic deformation on a single fault set in the ID. Finally, previous studies highlighted the need of active tectonic maps in Quito region to provide detailed geometry of such partitioning processes [Winkler et al., 2005].
Tectonics
RESEARCH ARTICLE
10.1002/2012TC003224
Key Points:
• Neotectonics of Quito faults are stud-ied by a multidisciplinary approach • Our kinematic model defines a N-S
fold system migrating eastward • The GPS rate for QFS is 4 mm/yr,
suggesting a deficit of crustal seismicity
Correspondence to:
A. Alvarado,
aalvarado@igepn.edu.ec
Citation:
Alvarado, A., L. Audin, J. M. Nocquet, S. Lagreulet, M. Segovia, Y. Font, G. Lamarque, H. Yepes, P. Mothes, F. Rolandone, P. Jarrin, and X. Quidelleur (2014), Active tectonics in Quito, Ecuador, assessed by geomorphological studies, GPS data, and crustal seismicity, Tectonics, 33, 67–83, doi:10.1002/ 2012TC003224.
Received 30 AUG 2012 Accepted 30 DEC 2013
Accepted article online 4 JAN 2014 Published online 15 FEB 2014
The Quito area lies at 2800 m elevation within the Interandean Depression (ID), in an active seismic and volcanic prov-ince (Figure 1). Quito City and basin are located on a structural bench, along the western border of the ID, which looks eastward to the San Pedro River valley (Figure 2) [Soulas et al., 1991; Robin et al., 2008]. The ID near Quito is bor-dered by multiple volcanic complexes, among them is Guagua Pichincha, the only seismically active volcano in this region.
Sparse descriptions of Quito’s regional deformation are present in the literature that ranges from large-scale extensional to strike-slip to compressional kinemat-ics [e.g., Mégard et al., 1987; Ego and Sébrier, 1996]. In turn, GPS data suggest a strain distribution among a series of N-S thrust belts, extending from the piedmont of the Western Cordillera to the Quito Fault System (QFS) and to-ward the eastern Subandean frontal belt (SFB) [White et al., 2003] (Figure 1). However, no previous data were avail-able to demonstrate the validity of these previous models, because the timing and geodynamic origin of the QFS was poorly constrained. Indeed stratigraphic sequences that may di-vulge the activity of these structures have not been studied in detail due to the intense Holocene volcanic activity that regularly leaves fresh deposits on this disrupted landscape [Winkler et al., 2005].
Here we focus on new geomorpholo-gic, geological, geodetic, and seismological data to propose a comprehensive neotectonic model of Quito regional deformation, in the northern part of the NAB. Our goal is to quantify the kinematics and geometry of the QFS that lead to the present-day crustal deformation in Quito’s subbasins and in the neighboring Interandean Depression (ID) and to decipher its geodynamic contribution to the relative northward transla-tion of the NAB mostly recognized south of Ecuador and in Colombia.
2. Geodynamic and Geologic Setting of Quito Region
In contrast with the highest Peruvian and Bolivian Andes, the northern Andes of Ecuador are marked by a moderate mean elevation of 1000–4000 m and by a narrow ID (8 to 30 km wide) oriented NE-SW between the Western and Eastern Cordilleras (Figure 2). Along the western margin of Ecuador, the oceanic Nazca plate is subducting obliquely with respect to the continental North Andean Block and the South America plate for the past 5 Ma, along a trend of N83°E (Figure 1) [Kendrick et al., 2003; Nocquet et al., 2009]. Beneath Quito, the subduction interface is located at a depth of ~120 km, without known influence on superficial tectonics of the upper plate [Guillier et al., 2001; Segovia and Alvarado, 2009; Font et al., 2013].
Figure 1. Ecuador geodynamic and tectonic settings reported on shaded DEM (30 m pixel). Geology: Cretaceous map and suture zones modified after Jaillard et al. [2009]. Oceanic basement is in dark gray.
West of Ecuador’s Eastern Cordillera, the present-day topography results from the lateral accretion and underplaying of Cretaceous oceanic blocks (Figure 1) [Hughes and Pilatasig, 2002; Mamberti et al., 2003; Toro, 2007; Kennan and Pindell, 2009; Jaillard et al., 2009]. The ID’s western border (Figures 1 and 2) is defined by active faults rooted in the basement, and these include the Latacunga Fault System (LT), [Lavenu et al., 1995] and the Quito Fault System [Soulas et al., 1991] (Figure 1). These fault systems affect the upper Mio-Pliocene volcanoclastic deposits in the ID [Lavenu et al., 1995] (Figure 2), but no Quaternary markers were previously dated in this region that document recent seismotectonic activity. In terms of geomorphic recent markers, the Quaternary stratigraphy is best de-scribed in Guayllabamba basin [Lavenu et al., 1995]. Sparse and poor correlations existed before our study due to poor chronology. In general, the Quaternary lithologies consist the following units, which are from lodes to youngest: Pisque (lavas and tuffs), San Miguel (lacustrine sediments), Guayllabamba (tuffs and lavas), Chiche (lahars, alluvials and pyro-clastic deposits), and Cangahua (tuffs, ash, and pumice falls) [Villagómez, 2003] formations. A lavaflow in the upper part of the Pisque formation is dated at 1.2 ± 0.13 Ma and 1.17 ± 0.01 Ma by Barberi et al. [1988]. Other authors suggested that the northwestern basin of Guayllabamba shows outcrops of the Cretaceous oceanic basement [Dirección General de Geología y Minas (DGGM), 1982; Ego and Sébrier, 1996; Villagómez, 2003; Winkler et al., 2005]. To provide new constraints on the regional deformation evolution, we performed new geochemical analyzes and K-Ar ages for his outcrop. The Cassignol-Gillot unspiked K-Ar technique [Gillot and Cornette, 1986], which is specially suitable for dating young volcanic products [Quidelleur et al., 2001] such as Andean lavasflows and domes [e.g., Quidelleur et al., 2009; Germa et al., 2010], was used. This result indicates that the supposed oceanic basement corresponds to much more recent volcanic activity, belonging to Pisque formation, now dated to 1.152 ± 0.030 Ma (GAB-A-O1_feld, Table 1) [Alvarado, 2012]. We also performed thefirst age determinations on the two volcanic domes, Catequilla (CAT-01, Table 1) and Pacpo
(DP-01, Table 1 and Figure 2), whose K/Ar ages are 0.833 ± 0.026 Ma and
0.898 ± 0.015 Ma, respectively. Both domes thus belong to the stratigraphic Pisque formation (lavas and pyroclastic deposits) and not to the Guayllabamba formation, as previously proposed by Villagómez [2003]. Finally, the upper part
SAN MIGUEL PUENGASI GUAYLLABAMBA BASIN MOJANDA WESTERN CORDILLERA EASTERN CORDILLERA INTERANDEAN DEPRESSION ILALO SAN PEDRO R. GUA Y LLABAMBA R. A B CONOCOT O EL TABLON 0° TANGAHUIL A 0 6 12Kilometers Quito basin 1990 (Mw5.3) earthquake Confidence contour Intensity center of 1587 earthquake 78.5°W 0.3°S 6a,c 6b SAN ANT ONIO BELLA VIST A - CA TEQUILLA EL INCA-CARCELEN ILUMBISI - LA BO T A EL BA TAN MACHANGARA P C CASITAGUA PULULAHUA ATACAZO PICHINCHA 3a
Figure 2. DEM 20 m topographic map and Quaternary settings of Quito region: the toponymy used in the text is reported together with volcanic edifices, tectonic segments, and principal rivers. Black frame corresponds to Figure 4 extent. Maximum intensity area for the historical earthquake Guayllabamba 1587 (6.4 MIc ~ Mw). The confidence contours are related to the probability (51 and 95%) that the maximum intensity is inside this area [Beauval et al., 2010]. White squares correspond to Figures 6a–6c and 3a. The red dot corresponds to 08 November 1990 (Mw5.3) earthquake. C: Catequilla andesitic dome and P: Pacpo dacitic dome.
Table 1. New K/Ar Ages Obtained Using the K-Ar Cassignol-Gillot Technique [Gillot et al., 2006]
Name Age (Ma) Uncertainty Latitude Longitude
GAB-A-O1_feld 1.152 0.030 0.01°N 78.41°W
CAT-01-pate 0.833 0.026 0.00 78.43°W
DP-01-pate 0.898 0.015 0.06°S 78.44°W
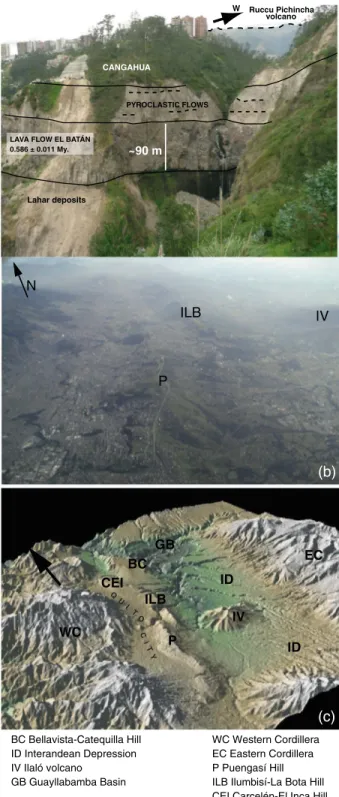
of the Chiche formation is capped by the regionally distributed volcanoclastic“Pifo” ashfall layer related to the Chacana caldera (0.165–0.180 Ma) (M. Hall, personal commu-nication, 2011) [Robin et al., 2009]. The last outcrop described here is located at the edge of Quito basin, marked by the incision of large pale gullies that developed consec-utively after the sudden lahar infilling (Figure 3a). At the southern end of La Bota hill, the“El Batán” lava flow is interbedded in the volcanoclastic stratigraphy and is exposed through differential erosion. The flow is issued of Pichincha volcano [Robin et al., 2009] and should then be tilted to the east, but its base displays an anomalous 12° tilt to the west. We performed afirst K/Ar analyses of the El Batán lavaflow, which indicates an age of 0.589 ± 0.011 Ma (PICH-04_feld, Table 1 and Figure 2). This marker is evidencing a tectonic back tilt of the lava flow after it is emplaced.
3. Geomorphic Study and
Mapping of the Active Quito
Fault System
The Quito Fault System was previously described by various authors as a graben [Sauer, 1965; Tibaldi and Ferrari, 1992]. Contrarily, based on scarce geomorpho-logical observations, Soulas et al. [1991] proposed a system of west dipping thrusts [Lavenu et al., 1995; Ego, 1995; Ego and Sébrier, 1996; Villagómez, 2003]. Unfortunately, the massive geographic expansion of the city (Figures 3a and 3b) and periodic draping of the topography by young volcanic units prevented fur-ther detailed study.
In detail, Quito City is 2800 m high in ele-vation on average, bounded by volcanoes 4800 m high (Figures 2 and 3). The city is built on Plio-Quaternary volcanoclastic ba-sinsfilled between the Western Cordillera [Winkler et al., 2005] and undulated seg-mented hills trending N20°E (Figures 2 and 3), culminating ~500 m above the ID (Figure 3a). In this study each seismotectonic segment is identified by its geomorphic characteristics and its name is reported on the hill-shaped topography (Figure 2a). Quito is located upon three hanging subbasins: the Machángara, El Batán, and San Antonio Basins (Figure 2a). These arefilled with Quaternary volcanoclastic sediments and preserved from further incision to the west of Quito’s fault belt, contrasting with the greater subparallel incision of the San
N EC WC ID ID GB P IV ILB CEI BC WC Western Cordillera EC Eastern Cordillera P Puengasí Hill ILB Ilumbisí-La Bota Hill CEI Carcelén-El Inca Hill BC Bellavista-Catequilla Hill ID Interandean Depression IV Ilaló volcano GB Guayllabamba Basin P ILB IV N (b) (c) ~90 m
Figure 3. (a) Best stratigraphic outcrop of Quito basin. K/Ar age of el Batán Lava flow, this study, Table 1. (b) Photographic perspective of El Batán, Ilumbisí, and Puengasí segments. (Photo: www.skyscrapercity.com). (c) Three-dimensional view of Quito basin in the Interandean Depression after SRTM DEM.
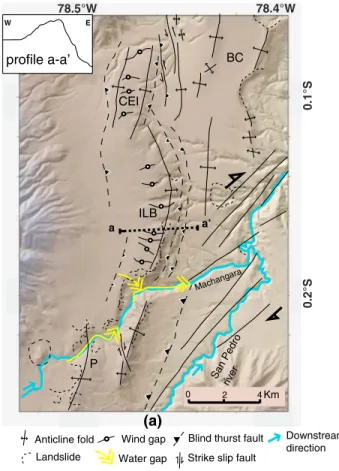
Pedro-Guayllabamba River in the ID (Figures 2 and 3). Figure 4 shows an example of the geomorphologic imprint of the drainage in Quito region. The Machángara River (M) initiates on the northernflank of Atacazo volcano and then follows the en echelon fold system on its western side before crossing the Ilumbisí-La Bota (ILB) N-S fold segment, to join the San Pedro River (Figures 2 and 4). Indeed, the ongoing activity of ILB fold segment resulted in the carving of a nar-row gorge by the river to preserve its for-mer course to the east across the growing fold (Figure 4). South of Machángara gorge (Figures 2 and 5), secondary streams are discretely incising the Puengasí fold seg-ment, whereas north of the gorge the ILB fold segment is strongly incised on its easternflank by both active and fossil streams. These wind gaps (>10 m deep) attest to the fast vertical uplift along the fold segments of QFS (Figure 4). Indeed, rivers are very sensitive to topographic changes caused by uplift or subsidence and are thus ideal markers to identify recent tectonic activity [Burbank and Anderson, 2001; Audin et al., 2003; Whipple, 2004]. Neotectonic process recognition is partly here based upon the interpretation of alluvial landforms, drainage evolution as the intermittent river network shows systematic patterns of course deflections as it encounters the fault scarps or folds in the superficial deposits. In Quito region, intermittent gullies form a dense drainage system, with evidence of rapid incision, especially during the wet season (average annual rainfall is ranging from 1000 to 2000 mm with highest values of 45 mm/h; Noni et al. [1986]). Intermittent stream channels in comparison with major river beds thus constitute perfect markers for tectonic regional studies. While the major Machángara gorges demonstrate that the river is continuously incising, evidence for former lateral river courses exists in abandoned channels as well as fragments of abandoned channels (Figure 4, i.e., wind gaps withfluvial sediments) and alluvial terraces that occur up to a hundred of meters in elevation above the modern channel. Also, double vergence wind gaps suggest that portions of these gullies have reversed theirflow direction, running now west rather than east (Figure 4) [Alvarado, 2012].
On the easternflanks of the ILB and Puengasí segments, a secondary river network is controlled by the sys-tematic captures of the streams and the abrupt changes in the NE-SW trend (e.g., Figure 4). The Guayllabamba and San Pedro Rivers both make apparent right turns in their courses, pushed away by the growing fold belt to the east (Figures 4 and 5) and by the interconnection of individual fold segments with the major Guayllabamba Fault System (GFS) to the northeast. Similarly, the Machángara River adopts a NE trend after crossing the thrust-related ILB anticline (Figure 4). And the course of the Guayllabamba River also deviates abruptly to the west and joins the thrust trace north of the BC segment (point B, Figures 2 and 5). At present, most of these drainage pattern anomalies are abandoned, deviated, or hanging fossil valleys. These characteristics are usually consid-ered in tectonically active regions to be consequence of localized slope changes due to the Quaternary tectonic activity [Jackson et al., 1996; Keller et al., 1999; Audin et al., 2003; Ramsey et al., 2008; Hall et al., 2012].
Widely distributed faults and folds are actively deforming the Plio-Quaternary volcanic deposits in the prin-cipal San Pedro-Guayllabamba and in the secondary Machángara or Guayllabamba basins (Figures 5 and 6).
a a’
Anticline fold Landslide
Wind gap Water gap
Blind thurst fault Strike slip fault
0.1°S 0.2°S 78.4°W 78.5°W San Pedro river Machangara Downstream direction BC CEI ILB P 0 2 4Km (a) W E profile a-a’
Figure 4. Zoom on ILB segment illustrating detailed mapping of geomorphic markers and resulting tectonic interpretation on 20 m DEM. P: Puengasí hill, CEI: Carcelén-El Inca hill, BC: Bellavista-Catequilla hill. Profile a–a′ topographic cross section in inset.
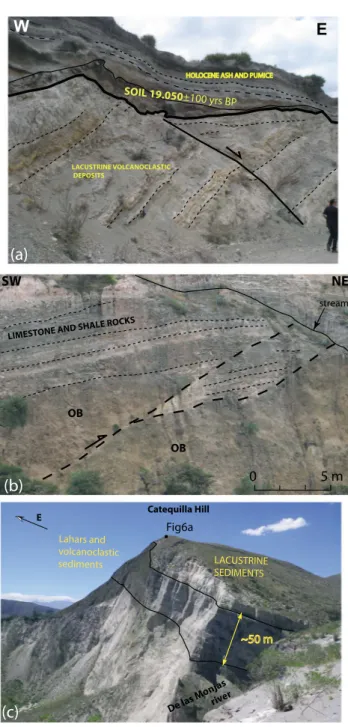
The orientation and throw of these faults follow the major fault trends of N-S to NE-SW (Figures 5 and 6). Superficial Quaternary fault scarps occur on several of the segments identified in the field that affect also the Holocene volcanoclastic deposits (Figures 6a and 6b). However, because of the poor preservation of scarps in inhabited areas, it is probable that the active fault map based uponfield obser-vations shows only an underrepresentative subset of what may actually exist. Detailed mapping on satellite and digital elevation model (DEM) images together with exten-sivefield survey has allowed us to identify several faults. Each tectonic segment is mapped and reported in this study, if it is consistent with robustfield observations (Figures 4 and 5). Indeed, additionalfield observations attest to the ongoing tectonic deformation on any scale (meter to kilo-meter) along each defined segment and in the Guayllabamba basin (Figure 6). The near absence of bedrock outcrops makes the task of recognizing tectonic markers more difficult, with the only exception be-ing the Bellavista-Catequilla (BC) northern segment (Figure 6c). For this reason, our approach focuses on integrated topo-graphic studies ranging from the Shuttle Radar Topography Mission (90 m pixel) to local 4 m digital elevation models. Additional structural criteria as in en echelon geometries, branching and in-tersections of subsegments, or curved geometry [Audin et al., 2008] constitute observations that permitted differentiating individual seismotectonic segments or subbasins (Figure 5). A detailed neotectonic map of each segment (as on detailed Figure 4) has been completed to show the fault characteristics and geometry of the large-scale deformation pattern and then compiled in Figure 5. As an example offield observations, we report here the presence of lacustrine deposits observed in the northernmost part of the Bellavista-Catequilla segment (Figure 6a). These volcanoclastic lake sediments, originally horizontal, are now tilted 30° to the west and are faulted by secondary small normal faults. These deposits are part of the San Miguel formation that is lower Pleistocene in age [Villagómez, 2003]. Nearly horizontal, dark soil deposits lay in discordance over the lacustrine deposits. Finally, ash and pumice falls that are probably Holocene deposits of Pululahua volcano cover all of these sequences (Figure 6a) [Andrade, 2007]. Secondary reverse fault scarps appear to be associated to the main west dipping structures along the northern Bellavista-Catequilla segment (Figure 6b). In Figure 6b, we show recent basalticflows, located at the bottom in the valley of the Guayllabamba River, in the westernflank of QFS. These are clearly cut by a reverse fault that accommodates about 20 m of offset on the BC segment, west of Guayllabamba Valley.
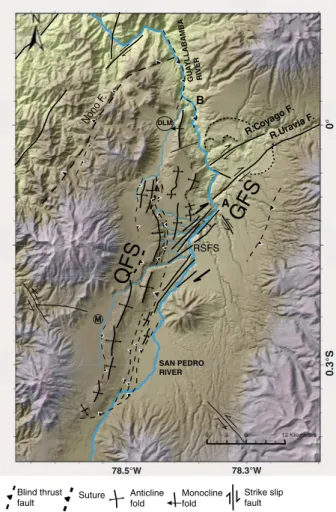
Additionalfield observations confirm the occurrence of other sets of secondary NE-SW active faults affecting this time the easternflank of Guayllabamba Valley as shown on the tectonic map (Figure 5). The sense of motion on this secondary normal fault set is changing, successively down to the south and down to the north, implying a vertical segment associated to the GFS and most probably a main strike-slip component. Nono F . Blind thrust fault Anticline fold Monocline fold Strike slip fault SAN PEDRO RIVER GU A Y LL ABAMBA RIVER 78.5°W 78.3°W 0.3°S 0° A B DLM
QFS
GFS
R.Coy ago F . R.Uravia F . RSFS SutureFigure 5. New neotectonic map of the Quito region. M: Machángara River; DLM: de las Monjas River; A and B, see in text; QFS: Quito Fault System; GFS: Guayllabamba Fault System. The Nono fault is the eastern limit of Pujilí Melange in this area. Background topography after 20 m DEM shading. Rivers are drawn in light blue.
Attesting to a west dipping QFS, a net topographic asymmetry is observed for each individual NS fold segments. On the a–a′ topographic cross section, the easternflank of QFS is much more vertical than the western one (inset on Figure 4a), in direct relation with the west dipping blind thrust. Consequently, slope-controlled landslides are more fre-quent along the eastern steeper edge of the blind thrust and the segmented fold system (e.g., Figure 4b). Additionally, one or two axis trends can define one single-fold segment (e.g., Carcelén-El Inca or Bellavista-Catequilla, Figure 4), as for the QFS. Indeed most of the segment axes are curved, such as the Ilumbisí-La Bota hill, suggesting a complex structure that propagates eastward (Figures 3–5). In summary two major active fault sys-tems can be identified on precise, 4 to 20 m resolution DEM images of the Quito region, and they demonstrate different kinematic patterns based on their geo-morphic expression. They connect in map view south to point A (Figure 5), and consequently, this geomorphic study suggests that
1. The QFS consists of a N-S striking, ~45° west dipping blind thrust. It out-crops at the surface as an en echelon segmented fold system with an over-all length of ~60 km. Each individual segment has a main compressional and secondary dextral strike-slip com-ponent, evidenced by en echelon ge-ometries (Figure 5). Thisfirst group is best expressed in its northernmost part (Figure 5) and appears to migrate north-eastward, thereby connecting to the GFS.
2. The GFS consists of a dextral trans-pressional fault system trending NE-SW and is located about 20 km NE of Quito (Figure 5). The lack of a major fault scarp could be due to major landsliding and burial by recent volcanic debris.
4. Local Microseismicity
In terms of seismic hazard,five major historical seismic events were felt in Quito in the past 500 years, the last one period after 1859; most of them are thought to be subduction event [Beauval et al., 2010], but one crustal
Figure 6. Field photos and their interpretation. (a) Lacustrine W-tilted sediments, these deposits are intercalated with ashes and pumices. Note the marked dis-cordance with a soil deposit, less tilted, and also sealed with pumices and ashes (Road San Antonio de Pichincha to hydroelectric plant in Guayllabamba River, north Bellavista-Catequilla segment; 0.0163°N–78.4217°W). The soil age is pro-vided by C14 AMS dating (LMC14, CEA Saclay, France) (b) Reverse fault affecting volcanic rocks (OB), i.e., andesitic lavaflows (Road San Antonio de Pichincha to hydroelectric plant in Guayllabamba River, north Bellavista-Catequilla segment; 0.0137°N–78.4075°W). (c) Southeastern view of the northernmost part of Quito blind fault system (location on Figure 2).
event must be associated with the QFS according to the spatial distribution of shaking intensities: the Guayllabamba event in 1587 (Figure 2) [Beauval et al., 2010]. The few witnesses and the large regional intensity of this earthquake prevented a reliable identification of the fault involved in such seismic rup-ture. Recently, extensive seismic and GPS networks have been deployed in this region by the Instituto Geofísico-EPN, Quito, and the French Andes du Nord (ADN) program [Nocquet et al., 2009] to characterize the ongoing crustal deformation.
A local seismic network has been deployed in the Quito area and its vicinity for both tectonic and volcanic monitoring (Red Nacional de Sismógrafos-Instituto Geofísico, http://igepn.edu.ec). Ten seismometers and fifteen accelerometers have been operating for 25 years and 3 years, respectively. The array captured a large number of seismic events, with 1758 crustal events for the 1994–2009 period, whose magnitudes range from Mw3.0 to 5.3 and depths that are less than 40 km (Figure 7), thus confirming the shallow crustal seismicity that occurs these active tectonic structures.
In this study, we use the new data set derived from crustal event relocations based on new 3-D velocity model and a nonlinear technique [Font et al., 2013]. Processing of the data is described in Lamarque [2011]. To im-prove earthquake location, Font et al. [2013] create a 3-D a priori P wave velocity model (3-DVM). The 3-DVM is constructed from the integration of geophysical and geological data that depend on the structural geometry and velocity properties of the crust and the upper mantle locations. In addition, specific station selection is carried out to compensate for the heterogeneous density in each region. Three-dimensional synthetic experiments are then designed to evaluate the“selected network” capacity to recover the event position using only P arrivals and the Maximum Intersection (MAXI) technique. All earthquakes of volcanic origin were previously excluded from this data source, based on waveform analysis. Seismicity distribution is shown together with the focal mechanisms published by Segovia and Alvarado [2009] and the National Ecuadorian Data Base of the Instituto Geofísico-EPN. This data set also includes relocated crustal events of the seismic swarm that occurred in 1997–2001, which probably induced the Guagua Pichincha volcanic crisis [Calahorrano, 2001]. We also included the focal mechanism of the 1990 earthquake (Mw5, Global Centroid Moment Tensor (GCMT) project). The entire crustal database of focal mechanisms for the region contains about 43 events (Table 2 and Figure 8), with depths that range from 0 to 18 km and magnitudes that vary from 2.7 to 5 (Table 2).
Figure 7. Distribution of the local microseismicity in Quito area, earthquakes depth< 20 km, data issued of IG-EPN Quito [Lamarque, 2011] and reprocessed with MAXI3D method [Font et al., 2013]. The width of A–A′ profile is 12 km.
The relocated hypocenter distribution defines a ~60 km length plane striking N10°–35°W (Figure 7). The hypocenters are observed to be concentrated along segments of the fold system and under Quito City. Most events occur also in the Guayllabamba region northeast of Quito (Figure 7) and within the rupture area of 1587 event (Figures 2 and 7). The distribution of the focal mechanisms along the fold system show conjugate nodal planes striking NW-SE and dipping ~30°–50°W along each individual fold segment. In detail, most of these events have reverse fault mechanisms, with the exception of strike-slip events that are located mainly to the northeast of Quito near the Guayllabamba Fault System (Figure 8). These strike-slip events are typical of transpressive faulting and consistent with the fault kinematics deduced from our morphotectonic studies (see previous sections). For the QFS, some of the events are also located exactly on intersegment geomorphic areas, for example, between two en echelon fold segments (Figure 7). These former focal mechanisms indi-cate perpendicular or oblique movements to the main fold system, implying segmentation as observed in the superficial tectonic morphology. A compressive axes orientation ranging between N93° and N119° has been calculated, as has been a stress tensor based upon these local focal mechanisms, as proposed by Segovia and Alvarado [2009]. This is consistent with the Quaternary kinematics shown on the tectonic map.
Table 2. Focal Mechanism Solutions for Quito Area, After: Global Centroid Moment Tensor (GCMT), Calahorrano [2001] (AC), Segovia and Alvarado [2009] (S&A), and IG: Instituto Geofísico-EPN [2012], (Md) Coda Magnitude
Code Longitude Latitude Depth S1 D1 R1 S2 D2 R2 Magnitude Datea Source
1 78.4274 0.0392 15 323 45 53 190 55 122 5.0 Mw 11/08/1990 2:59:57.5 GCMT 2 78.4784 0.077 12.36 61 45 17 327 85 45 2.7 Md 01/08/1998 23:49:33 AC 3 78.4752 0.1524 9.43 138 72 25 40 66 160 4.0 Md 11/08/1998 18:09:01 AC 4 78.4634 0.0696 8.4 301 82 11 33 78 172 3.0 Md 05/09/1998 8:20:57 AC 5 78.4514 0.2229 12.04 148 37 51 13 62 116 4.0 Md 24/09/1998 21:02:18 AC 6 78.4396 0.0359 11.89 133 72 6.1 41 84 162 3.5 Md 05/02/1999 16:12:45 AC 7 78.4889 0.0306 7.63 260 41 129 33 59 61 4.0 Md 14/03/1999 02:15:47 S&A 8 78.4731 0.0379 7.09 183 68 98 343 23 71 4.2 Md 30/08/1999 14:59:35 S&A 9 78.4951 0.0225 9.49 207 76 90 27 14 90 3.7 Md 26/11/1999 13:31:56 S&A 10 78.4951 0.1541 2.09 16 42 90 196 48 90 3.5 Md 02/01/2000 18:00:18 S&A 11 78.5043 0.0469 8.12 5 33 92 183 57 87 4.2 Md 15/04/2000 01:16:18 S&A 12 78.4826 0.0649 6.42 80 82 10 326 20 25 3.1 Md 17/07/2000 12:29:50 S&A 13 78.3543 0.0125 5.45 192 18 89 13 72 90 4.1 Md 19/02/2001 16:15:42 S&A 14 78.6260 0.4701 17.36 52 34 130 188 65 67 3.9 Md 12/04/2002 13:02:35 S&A 15 78.4721 0.0451 8.88 176 51 51 47 53 127 3.9 Md 05/06/2002 01:44:49 S&A 16 78.4551 0.0181 8.23 130 71 19 33 72 160 2.9 Md 05/06/2002 01:58:53 S&A 17 78.3713 0.0873 8.7 143 22 45 9 75 105 3.9 Md 21/07/2002 22:51:16 S&A 18 78.4000 0.1400 10.6 198 52 100 2 39 77 3.8 Md 23/07/2002 08:37:51 S&A 19 78.5100 0.3100 3.9 170 88 30 79 60 178 3.4 Md 23/08/2002 15:02:10 S&A 20 78.4430 0.2345 6.83 217 13 124 2 79 83 3.6 Md 11/09/2002 11:41:46 S&A 21 78.2208 0.4278 6.7 239 61 127 1 46 43 4.2 Md 04/12/2002 6:8:36 S&A 22 78.514 0.4405 4.03 58 36 148 175 72 59 3.9 Md 22/02/2003 17:11:12 S&A 23 78.3388 0.0661 4.98 332 45 128 103 56 58 4.1 Md 15/09/2003 4:00:31 S&A 24 78.4607 0.0448 6.06 6 82 94 211 8 65 4.0 Md 09/12/2003 23:52:44 S&A 25 78.4946 0.2488 7.42 33 77 114 150 28 30 4.0 Md 08/03/2004 5:37:18 S&A 26 78.5081 0.2345 8.53 36 59 126 162 46 46 3.7 Md 10/03/2004 7:6:16 S&A 27 78.5209 0.2426 11.28 36 59 126 162 46 46 3.8 Md 10/03/2004 6:29:48 S&A 28 78.5005 0.1534 7.56 202 11 114 357 80 85 4.0 Md 14/06/2005 6:5:12 S&A 29 78.4514 0.2043 10.02 168 37 68 14 56 106 3.7 Md 13/07/2005 9:22:27 S&A 30 78.4373 0.0561 10.28 13 45 96 184 46 84 3.6 Md 30/07/2005 10:53:19 S&A 31 78.5219 0.0901 5.61 207 8 157 94 87 83 4.2 Md 20/1/2007 20:38:51 S&A 32 78.5189 0.0047 15.65 152 39 76 350 52 101 4.1 Md 11/05/2008 11:5:36 S&A 33 78.6538 0.1603 6.32 353 57 0 83 90 147 4.3 Md 4/10/2008 19:10:47 S&A 34 78.3691 0.0438 8.37 180 17 41 50 73 103 4.2 Md 07/11/2009 19:28 IG 35 78.4889 0.2536 14.89 170 80 48 270 43 165 4.1 ML 17/02/2011 0:04:44 IG 36 78.4982 0.2412 11.78 170 60 40 283 56 143 3.9 ML 17/02/2011 0:46:24 IG 37 78.4937 0.2123 10.69 10 80 90 190 10 90 3.4 ML 25/06/2011 02:31 IG 38 78.4940 0.2011 12.88 7 75 78 226 19 128 3.4 ML 25/06/2011 16:35 IG 39 78.501 0.3222 22.03 7 80 90 187 10 90 3.5 ML 17/07/2011 14:11 IG 40 78.4356 0.1477 10.93 50 90 180 140 90 0 3.4 ML 02/08/2011 03:18 IG 41 78.3873 0.1355 5.3 185 50 60 46 48 120 3.0 ML 06/10/2011 11:09 IG 42 78.387 0.1271 16.9 8 56 125 136 47 50 4.6 Md 29/10/2011 13:50:48 IG 43 78.3913 0.1416 16.9 32 56 125 160 47 50 3.6 ML 26/11/2011 01:50 IG
Figure 7 shows the distribution of seismicity along profile A–A′ that is perpendicular to the strike of the main QFS, on the northern segment of the reverse fault system; highlighted by a seismic swarm. The profile shows that seismicity mainly occurs below Quito, west of the fold segments and aligned on a well-defined single fault plane. The seismic zone dips ~55° to the west and extends down to 20–30 km (Figure 7). The strike and dip of the seismic line is consistent with the nodal planes of the focal mecha-nisms, indicating a reverse motion along a westward dipping fault plane that extends 20 to 30 km deep below the Western Cordillera on the cross sections (Figure 8). This regional active fault plane may connect at depth to the inherited Pujilí Melange suture zone, but no seismicity is observed on this vertical geologic contact in its upper section (~30 km deep; see Figure 7 and cross-section A–A′) nor on the volcanic complexes, confirming their present-day seismic quiescence. In contrast, a vertical alignment of microseismicity appears east of QFS. This peculiar vertical deformation occurs on the GFS and probably represents the con-tinuation of activity of the Chingual strike-slip fault, south of its known superficial trace (Figure 1) cutting through the Guayllabamba basin and aligned with the GFS.
From this result, we conclude that these Quito seismic events occurred on a series of high-angle reverse faults developing in the crust along the eastern foot of the Western Cordillera rather than along former suture zones in the Western Cordillera. This QFS system is characterized by high-angle reverse faults, as observed in the San Andreas and Walker Lane fault systems in California, for example, Wesnousky [2005]. Indeed, there is no evidence for a basal decollement level in the seismic data and this structural style is thick skinned rather than thin skinned, which is different from that developed on the eastern Subandean range. Additionally, a transpressive motion on the GFS is observed in the focal mechanisms and confirms the sparse geomorphic observations for the latter. The microseismic data show a vertical geometry, coherent with a strike-slip main component on this previously unknown regional dextral fault system.
5. Present-Day Deformation From GPS Measurements
Here, we analyze the interseismic velocityfield in the ID to quantify the present-day deformation across the QFS. Our results are derived from 11 GPS campaign sites provided by the Instituto Geográfico Militar (Figure 9a and Table 3) that we recently remeasured. All campaign sites have a minimum observation period of 10 years leading to velocity estimates at the 1 mm/yr level or better. Our velocityfield is augmented by two continuously recording GPS stations (QUI1, belonging to the global tracking network of the International Global Navigation Satellite Systems Service for Geodynamics) and QUEM operating since 2007. We analyzed the data using the GAMIT/Global Kalmanfilter (GLOBK) software [Herring et al., 2010].
Trenkamp et al. [2002] and White et al. [2003] showed that the large-scale GPS velocityfield in Ecuador results from two different processes:first, elastic deformation induced by the partial to total locking along the subduction interface causes E-W shortening, with the eastward component of velocities decreasing with
( ( (( F 18 23 13 34 17 15 24 32 9 8 11 31 12 30 33 10 3 28 40 5 20 37 38 26 27 25 19 39 22 14 6 7 16 2 4 43 41 42 29 36 35 1 78 .4 ° W 78 .6 ° W 0° 0. 4° S
Figure 8. Focal mechanism reported on the new active fault map (this study) of Quito area. Sources: Calahorrano [2001], Segovia and Alvarado [2009], and more recent Instituto Geofísico-EPN [2012]. Each focal mechanism corresponds to its number reported in Table 2.
increasing distance from the trench. Preliminary estimates based on sparse geodetic data indicate approxi-mately 50% coupling, leading to a possible contribution of about a millimeter per year in the Quito area (located about 250 km from the trench); and second, oblique convergence of the Nazca plate toward South America, with a possible additional contribution by the subducting Carnegie Ridge, induces a northeastward “escape” motion of the North Andean Block. While the kinematics of the NAB has yet to be precisely defined, Trenkamp et al. [2002] proposed a value of ~6 mm/yr in a N77°E direction based on the single velocity of global tracking station BOGT (Bogotá, Colombia).
Wefirst define a Stable South America Reference Frame by estimating an Euler pole using 17 sites from the Brazilian craton and Argentina, at which we assume no internal deformation (WRMS = 0.49 mm/yr). With respect to that reference frame, sites located west of the QFS show velocities on the order of 10 mm/yr or larger, while sites located within the ID show velocities of 8 mm/yr, all in a N90°E(±10°) direction. Such values therefore indicate that shortening is presently occurring across the QFS, which is consistent with geomor-phological observations. To better quantify the present-day deformation across the QFS, we define a local
78,2° W 78,4° W 78,6° W 0° 0, 2° S 0, 4° S 20km CORE(2.0) ILAL(1.1) LUMB(2.1) MIRA(2.5) NAYO (2.3) OYAM (0.9) PAL0(3.8) PAM1(0.8) PAPA (0.7) PINT (0.2) QUEM(4.2) QUI1(3.7) UNGU(3.7) 10 mm/yr 10 5 0 (a) (b) distance to fault (km) horiz o ntal v e locit y (mm/yr)
Figure 9. (a) GPS horizontal velocityfield. Velocity is expressed with respect to a local reference frame defined using sites PAM1, OYAM, PAPA, and PINT. Numbers indicate horizontal rates in millimeter per year. Error ellipses are shown at the 95% confidence level. (b) Horizontal velocity profile is perpendicular to the average strike of the QFS. The blue line in Figure 9a shows the profile used in Figure 9b.
Table 3. GPS Horizontal Velocitya
Site Longitude Latitude Ve1 Vn1 Ve2 Vn2 S_Ve S_Vn S_Ven Period
CORE 78.52 0.32 10.147 0.217 2.56 1.75 0.77 0.64 0.01 1996–2002–2007 ILAL 78.41 0.26 9.264 0.897 1.71 1.11 0.44 0.36 0.03 1996–2011 LUMB 78.47 0.21 10.218 0.872 2.68 1.12 0.44 0.36 0.04 1996–2011 1994–1998–2002–2005 MIRA 78.50 0.27 9.883 0.814 2.32 2.79 0.36 0.30 0.06 2009 NAYO 78.43 0.15 10.184 0.728 2.67 1.28 0.44 0.36 0.03 1996–2011 OYAM 78.32 0.20 7.570 0.918 0.04 1.14 0.63 0.53 0.04 2002–2004–2011 PAL0 78.64 0.22 11.898 0.280 4.36 1.63 0.59 0.49 0.05 2002–2011 PAM1 78.20 0.08 8.052 1.146 0.58 0.96 0.38 0.32 0.01 1994–2009 1994–1998–2001–2002 PAPA 78.14 0.38 8.302 2.659 0.69 0.52 0.31 0.26 0.01 2009 PINT 78.36 0.42 8.548 1.300 0.92 0.74 0.65 0.54 0.03 2002–2006–2011 QUEM 78.50 0.24 12.336 0.645 4.79 1.33 0.54 0.42 0.03 2007–2012 QUI1 78.49 0.22 11.579 0.136 4.04 2.11 0.24 0.17 0.00 2001–2010 UNGU 78.56 0.24 11.666 0.209 4.12 2.16 0.56 0.46 0.04 1996–2009 a
Ve,Vn: east and north components in millimeter per year. Ve1: velocity components with respect to Stable South America. Ve2: velocity components with re-spect to ID (see text). S_Ve, S_Vn, and S_Ven: standard deviation on east and north velocity components and correlation coefficient. Observation periods indicate the year of measurements for campaign sites and data span for the two continuous sites QUI1 and QUEM.
reference frame, by estimat-ing a rigid rotation usestimat-ing sites east of the QFS (OYAM, PINT, PAPA, and PAM1; Figure 9a). Possible internal deformation of this area is less than 1 mm/ yr, as indicated by a WRMS of residual velocities of 0.48 mm/ yr. With respect to this new frame, all sites located west of the QFS show eastward ve-locities at 2–4 mm/yr, clearly indicating shortening across the QFS (see above). The lack of data within the Guayllabamba basin prevents any conclusions for the GFS, but eastward motion with respect to PAM1 is consistent with right-lateral motion along the GFS. The GPS results further show a gradient across the QFS, suggesting that additional information about the locking depth of the QFS can be constrained using the present geodetic data set. To place additional constraints on the average locking depth along the QFS, we used a two-dimensional model, projecting the horizontal velocity along a cross section roughly perpendicular to the average strike of the QFS (Figures 9a and 9b). Far-field sites (PAL0/UNGU and PAPA) indicate a horizontal shortening rate of ~4 mm/yr. We model the GPS profile using a two-dimensional planar screw dislocation dipping west, with pure reverse slip, locked above a given depth in an elastic homogenous half-space. We used a dip in agreement with the averaged micro-seismicity and focal mechanism (Figure 7) and varied the locking depth. As the locking depth increases, the distance over which the relative motion is accommodated becomes larger. Because the GPS data show a sharp gradient, with velocity decreasing by 3 mm/yr over a distance of 10–15 km, the locking depth is constrained to be small (<7 km). However, because we used a simplified geometry for the fault, minimum values for the locking depth are less constrained because they strongly depend on the distance of each site to the individual segment. Nonetheless, wefind that an average locking depth of 3 km provides a reasonable fit to the data. The Quito fault zone therefore appears to be weakly and shallowly locked. With a dip of 40°, the optimal slip rates are found to be in the range of 4.3–5.3 mm/yr.
6. Seismotectonic Hazard Estimation
Earthquake size and recurrence times are functions of the rate of stress accumulation, length and width of fault segments that might rupture in the future. For the QFS, the maximum earthquake size would occur in case of the simultaneous rupture of all segments. We use empirical laws recently derived by Leonard [2010] that relates the potential rupture area (RA) and the surface rupture length (SRL) to the magnitude to provide estimate of earthquake magnitude. For the RA calculation, the width can be an estimated either from the distribution of seismicity at depth or taking the average locking depth estimated from the geodetic results. Additionally, we used Wesnousky [1986] to provide recurrence time estimates that are also compared to recurrence time cal-culated by dividing the moment of the maximum size earthquake by the moment rate deficit estimated from geodesy. The different results in terms of recurrence times are then discussed in the light of historical seismicity. For the possible maximum size earthquake, in the case the QFS, a total length of 60 km fault zone and a rupture area of about 720 km2lead to magnitude estimates of 6.8 (RA) and 7.1 (SRL). Using Wesnousky [1986], the associated recurrence time would then be between 195 and 235 years. However, scaling laws are derived from faults known to rupture the entire brittle crust (~15 km). In contrast, our GPS results suggest shallow locking, about 3–7 km deep. Such values would lead to a RA of 180 to 420 km2and to a maximum earthquake size of Mw 6.6. On the other end, the moment deficit estimated from GPS is ranging from 2.3 to 6.7 × 10¹⁶N m yr 1which corresponds to a recurrence time range of about 150–435 years. Only the lower value provided by the GPS estimates seems to be consistent with the historical lack of large earthquakes for the lastfive centuries. However, considering the geomorphological characteristics of the QFS, the rupture of individual segments is another probable scenario. Based on this hypothesis, we define five segments for the QFS that are from south to north: Puengasí, Ilumbisí-La Bota, Carcelén-El Inca, Bellavista-Catequilla, and Tangahuilla
Table 4. Quito Fault System QFSa
Segment Rupture Area (km2) Magnitude (RA) Surface Rupture Long (km) Magnitude (SRL) Recurrence Time (y) Puengasí 259 6.4 22 6.4 188 ILB 176 6.2 15 6.2 138 CEI 82 5.9 7 5.7 105 BC 191 6.3 17.5 6.3 183 Tangahuilla 108 6.0 12 6.0 115
aMaximum magnitude estimations after Leonard [2010], rupture area (RA), and
surface rupture long (SRL). For coefficients: area a = 1 and b = 4, for SRL a = 1.52 b = 4, 4, for dip slip fault. ILB: Ilumbisí-La Bota segment; CEI: Carcelén-El Inca seg-ment; and BC: Bellavista-Catequilla segment. Recurrence times after Wesnousky [1986].μ = 3 × 10¹⁰Pa.
(Figure 2). To calculate their rupture area (RA), we consider the width of each segment and its averaged length. The width corresponds to the average width of the seismic event distribution west of each fold segment (dipping 40–50° to the west). Additionally, the surface rupture length (SRL) corresponds to the segment length. The results are reported in Table 4 and correspond to a minimum Mw= 5.7 (SRL) for the Carcelén-El Inca segment and a maximum of Mw= 6.4 (SRL and RA) for the Puengasí segment. Using the locking depth estimated from geodesy, these numbers are now reduced to Mw(RA) 6.2 (maximum magnitude Puengasí coupled to 7 km) and Mw(RA) 5.3 (minimum magnitude Carcelén-El Inca coupled to 3 km) (Table 4). The recurrence time would then be 200–400 years. These recurrence times are still high given the observation of historical seismicity.
To estimate the maximum event magnitude for the Guayllabamba Fault System (GFS), we considered three potential rupture zones: (1) thefirst segment is characterized by a succession of mainly strike-slip faults, which are transferring part of the deformation to the NE and that are related to the San Pedro River course: this segment would be the Río San Pedro Fault System (SPFS) (Figure 5); (2) the strike-slip fault named Río Coyago, which is the northeastern limit of the Guayllabamba basin (Figure 5); and (3) the Río Uravia Fault, a strike-slip structure, which is the southeastern limit of the Guayllabamba basin.
As defined for three segments, we calculate the magnitude value estimation as a function of surface rupture length (SRL), which would correspond to the length of each segment. We did not choose to estimate the mag-nitude as a function of the rupture area because there are not enough criteria to define the theoretical width of the rupture zone, neither from seismicity nor from geodesy. The results are presented in Table 5. For the SPFS, the maximum and minimum magnitude values are reported with respect to the longest (10 km) and the shortest segments (5 km). The maximum estimated magnitude for the GFS was Mw6.5 for the Rio Uravia fault. Given the absence of geodetic results for GFS, estimates derived from geodesy are not considered.
In spite of some recent instrumental recording of seismic activity, few historical earthquakes have been attributed to the Quito or Guayllabamba Fault systems. The largest intensity value available for the 1587 Guayllabamba event is estimated to be VII or higher [Egred, 2009]. Its center is located north east of Quito, suggesting rupture on a segment of the newly defined Guayllabamba Fault System as the causative seismic source. The magnitude has been estimated to be Mw~ 6.4 [Beauval et al., 2010]. Such an estimate is consistent with the magnitude deduced from the surface rupture length and the rupture area of the BC segment.
The second historical event that occurred during the last 100 years in Quito region (11 August 1990, Mw5.3, BC segment, in red on Figure 2) produced damage mainly in the northern part of QFS [Egred, 2009]. Similarly, in the El Batán basin (Figure 2), paleoseismic evidence demonstrates of coseismic deformation the Holocene activity of QFS, with 28 events (I> 5) and one major paleoevent (I = X) for the last 1500 years. The former event is estimated to have a moment magnitude of 6.5–7 produced by the rupture of the entire length of the QFS [Hibsch et al., 1997].
7. Shortening and Uplift Estimations for the Interandean Depression
The deformation of the ID began south of Quito during the late Pliocene, about 3.5 Ma ago in the Latacunga region [Lavenu et al., 1995] and only 1.8 Ma ago in the Quito region [Ego and Sébrier, 1996; Villagómez, 2003]. The latter suggests a northward propagation of the deformation along the Western Cordillera in the ID lasting through the Pliocene. Moreover, the Plio-Quaternary constraint on the northward propagation of the defor-mation is also observed in the tectonic interaction with the drainage pattern and is perfectly consistent with the instantaneous horizontal geodetic rates in the Quito region as compared to those of the Latacunga region. In the Latacunga region, the overall shortening of the ID is about 3.4 ± 0.6 km of E-W compression for the Pliocene [Lavenu et al., 1995]. The best documented outcrops suggest a 1.4 ± 0.3 mm/yr rate of shortening since the late Pliocene [Lavenu et al., 1995] and horizontal preliminary geodetic rates translate to 1 mm/yr of interseismic
Table 5. Guayllabamba Fault System GFSa
Segment
Surface Rupture Long (km)
Magnitude (SRL) Río San Pedro fault
system
Segment longest 10 5.9
Segment shortest 5 5.5
Río Uravia fault 24 6.5
Río Coyago fault 9 5.8
a
Maximum magnitude estimations after Leonard
[2010] surface rupture long (SRL). For coefficients:
shortening in this region. As argued by Lavenu et al. [1995], E-W shortening accom-modated by the Latacunga fold system is kinematically consistent with strike-slip mo-tion along the NE-SW trending Pallatanga Fault System (Figure 1).
In the Quito region, however, our study suggests that for the northern ID some of the partitioned plate motion is accommo-dated not only by shortening on reverse faults along the western border of the Interandean Depression but also by strike-slip faulting that transfers plate motion northeastward toward Colombia. Then, similar to the southern end of the ID, E-W shortening accommodated by the QFS is kinematically consistent with strike-slip motion along the NE-SW trending GFS as a prolongation of the Chingual Fault System (Figure 1).
If 20% of the plate motion is transferred inland causing permanent tectonic short-ening nowadays as shown by geodesy [Nocquet et al., 2009], a simple hypothesis would be to consider that the laterally ac-creted terrains [Jaillard et al., 2009] are presently resisting shortening, favoring the reactivation of NE-inherited structures (Pallatanga or Chingual Fault systems) rather than NS-trending ones (Figure 10). Moreover, if these structures are located at the extremities or north of the ID, where the convergence obliquity is much greater along the plate boundary than for south-ern Ecuador, these will absorb a higher value of deformation.
8. Correlation of Seismic and GPS Data With Geological and Morphological Structures
Using the tectonic fault map (Figure 5) and the geodetic and recent earthquake solutions of Figures 7–9, we can decipher the kinematics and depth extent of active faulting, augmented with relocated background seismicity [Lamarque, 2011]. Earthquake focal mechanisms along the edge of the ID indicate west dipping thrust faulting with events distributed throughout the 20–30 km of crustal thickness (Figure 7). At the Pujilí Melange suture zone, the deepest events occur at depths of ~30 km, which suggest the connection of the Quito fault zone (QFZ) to the suture at depth. Within the study area, the overall seismicity suggests that the northern and southern ends of QFS also turn west to intercept the inactive suture zone at the surface (Figure 10). However, the most superficial earthquakes throughout the ID typically occur at shallow crustal levels, such as 10–15 km depths along the identified fault system, attesting for a coupled segment between this depth and the surface outcrops of the QFZ.
In the case of the deeper structure related to the Quito Fault Zone, its surface expression is not as obvious or as clear as for the classic tectonic structures. However, we infer from the multidisciplinary approach that this feature is related to the development of an en echelon fold and high-angle reverse fault system to the north and its connection to strike-slip faults to the east. Although thin-skinned fold and thrust belts often form
Figure 10. Simplified kinematic model for active deformation in Quito region. Interpretations after the geometry of mapped fault systems in plane view, seis-micity, and GPS data as presented in previousfigures. ID: Interandean Depression; WC: Western Cordillera
within sequences offlat-lying sedimentary layers, it is different in Quito, where steeper reverse faults obvi-ously affect the deeper accreted basement by folding and faulting in the overlying volcanoclastic layers and probably by connecting to older sutures at depth.
In this work, we observed that some of the tectonic structures are affecting the orientation, connection, and abandonment of the drainage network or are curved around volcanic edifices implying the preexistence of the volcanic activity as compared to the tectonic activity (Figure 9). According to their characteristics (strike and kinematic), these structures can be separated into two kinds (Figure 10). Both the morphostructural definition of the Interandean Depression (ID) and its Quaternary volcano tectonic activity appear to be associated to NS and NNE-SSW trending fault systems. Apparently the neotectonic activity is reusing some of the ancient regionally inherited NE-trending structures east of the ID; however, none of the NS trending structures west of the ID appears to be activated in the seismic data (Figures 1 and 10) [Bonnardot, 2003; Jaillard et al., 2005; Toro, 2007].
More interestingly, the GPS together with the seismotectonic data also suggest that the distribution of the deformation occurs in two branches in this peculiar northern region of the Interandean Depression (Figure 10). Convergence of 4 mm/yr is accommodated along the QFZ, whereas 7 mm/yr is being transferred in a NE direction along the Chingual fault system. Finally, these data all together suggest a northeastward migration during the last 1Ma.
The estimated recurrence intervals, considering a shortening rate of 3 mm/yr, would indicate that since 1587 (the Guayllabamba earthquake) there should have occurred at least four earthquakes with magnitudes of Mw 5.9 and at least two of magnitudes of Mw6.4. But only one Mw5.3 occurred in 1990 in Pomasqui, indicating that there is a seismicity deficit.
It should be noted that the QFS and the reverse faulting system of Latacunga are geodynamically similar because they form the western boundary of the Quito-Latacunga microblock (progressively migrating and narrowing continental plate boundary in Ecuador: present-day localized active faulting delimiting the North Andean Block to the east [Alvarado, 2012]). However, the rates measured in Quito (~3 mm/yr) by GPS are 3 times higher than the value measured in Latacunga (~1 mm/yr).
Paradoxically, the historical and instrumental seismicity in the Latacunga region shows higher background seismicity than in Quito, which includes three earthquakes: one of Mw5.7 (after Toacazo, 1944; Pasa, 1960; Pastocalle, 1976) [Egred, 2009]; one of Mw5.9 (Pujilí, 1995) [Beauval et al., 2010]; and one of Mw7.3 (Ambato, 1698) [Egred, 2009].
9. Conclusion
Deformed late Quaternary markers and surfaces in the Quito region of Ecuador provide evidence for actively growing folds (N-S trending) and strike-slip fault systems (NE-trending). Recognition of both morphotectonic and hydrologic features through geologic interpretation of aerial photos, satellite images, andfieldwork has been used to delineate active fault traces and to obtain evidence for their kinematics. The present synthesis of active tectonics, by means of the unified analysis of seismotectonic and new geodetic data sets, reveals a complex crustal response to oblique plate motion along the subduction zone with some partitioning of the deformation along two tectonic branches that cut through the ID north of Quito. Convergent deformation is localized in the Interandean Depression of the Quito region and decreases northward along the reverse fault system as it connects to the newly defined Guayllabamba transpressive fault system (GFS) northeast of the Quito region. The detailed geomorphic study suggests that near-field deformation is influenced by the local structural complexity of inherited accreted terranes and by active volcanism.
We estimated a maximum magnitude range of Mw5.7 to 7.1 for the GFS and QFS. The best constrained es-timation derives from geodetic data (coupling at depth between 3 and 7 km, corresponding to a maximum value of Mw= 6.6. We believe that the latter value is the most appropriate given the historical catalog in this region. Furthermore, Wesnousky, 2010 states that the magnitude estimation obtained from geologic data such as length and area tends to overestimate this parameter.
The tectonic shortening estimated from GPS campaign data varies significantly along the QFS, up to 4 mm/yr, which is greater than the estimated long-term shortening recorded in the ID for the past 3.5 Ma. Finally, we propose that a significant fraction of the continental shortening in Ecuador is accommodated by folding and
partially blind thrusting along the eastern piedmont of the Western range on Quito Fault System but that part of the stress may also be transferred north to the Otavalo–El Angel system, located on the eastern edge to Western Cordillera and Chingual Fault system to the east on Guayllabamba Fault System (Figure 10).
References
Alvarado, A. (2012), Néotectonique et cinématique de la déformation continentale en Equateur, PhD thesis, Université de Grenoble, Grenoble, France, pp. 261. [Available at http://tel.archives-ouvertes.fr/tel-00870332.]
Andrade, D. (2007), Estudio geo-vulcanológico del Complejo volcánico Pululahua. Eng. thesis, Escuela Politécnica Nacional, Quito, Ecuador, pp. 188.
Audin, L., G. Herail, R. Riquelme, J. Darrozes, J. Martinod, and E. Font (2003), Geomorphological markers of faulting and neotectonic activity along the western Andean margin, northern Chile, J. Quaternary Sci., 18(8), 681–694.
Audin, L., P. Lacan, H. Tavera, and F. Bondoux (2008), Upper plate deformation and seismic barrier in front of Nazca subduction zone: The Chololo Fault System and active tectonics along the Coastal Cordillera, southern Peru, Tectonophysics, 459, 1–4(1), 174–185, doi:10.1016/j. tecto.2007.11.070.
Barberi, F., M. Coltelli, G. Ferrara, F. Innocenti, J. M. Navarro, and R. Santacroce (1988), Plio-Quaternary volcanism in Ecuador, Geol. Mag., 125, 1–14.
Beauval, C., H. Yepes, W. Bakun, J. Egred, A. Alvarado, and J. C. Singaucho (2010), Locations and magnitudes of historical earthquakes in the Sierra of Ecuador (1586–1996), Geophys. J. Int., 181, 1613–1633, doi:10.1111/j.1365-246X2010.04569.x.
Bonnardot, M.-A. (2003), Modélisation numérique des Andes d’Equateur: Des accrétions océaniques à la déformation continentale (80–0 Ma). DEA memory, Université Savoie, France, pp. 35.
Burbank, D., and R.-S. Anderson (2001), Tectonic Geomorphology, Blackwell Science, Malden, Mass.
Calahorrano, A. (2001), Estudio del origen del enjambre sísmico de la zona norte de la ciudad de Quito, durante 1998–1999, Eng. thesis, Escuela Politécnica Nacional, Quito, Ecuador, pp. 190.
DGGM (1982), Hoja geológica“Guayllabamba”. Escala 1:25000.
Ego, F. (1995), Accommodation de la convergence oblique dans une chaine de type cordilleraine: Les Andes de Equateur, PhD thesis, Université de Paris-Sud Centre d’Orsay, Orsay, France, pp. 209.
Ego, F., and M. Sébrier (1996), The Ecuadorian inter-Andean valley: A major and complex restraining bend and compressive graben since late Miocene time, Annales Tectonicae, X(1–2), 31–59.
Egred, J. (2009), Catálogo de terremotos del Ecuador 1541–2009, Escuela Politécnica Nacional, Instituto Geofísico, Internal Report. Font, Y., M. Segovia, S. Vaca, and T. Theunissen (2013), Seismicity patterns along the Ecuadorian subduction zone: New constraints from
earthquake location in a 3-D a priori velocity model, Geophys. J. Int., doi:10.1093/gji/ggs083.
Germa, A., X. Quidelleur, P. Y. Gillot, and P. Tchilingurian (2010), Volcanic evolution of the back-arc Pleistocene Payun Matru volcanicfield (Argentina), J. South Am. Earth Sci., 29, 717–730.
Gillot, P.-Y., and Y. Cornette (1986), The Cassignol technique for potassium-argon dating, precision and accuracy: Examples from the late Pleistocene to recent volcanism from southern Italy, Chem. Geol. (isotope geoscience section), 59, 205–222.
Gillot, P.-Y., A. Hildenbrand, J.-C. Lefèvre, and C. Albore-Livadie (2006), The K/Ar dating method: Principle, analytical techniques, and appli-cation to Holocene volcanic eruptions in southern Italy, Acta Vulcanologica, 18(2), 55–66.
Guillier, B., J.-L. Chatelain, E. Jaillard, H. Yepes, G. Poupinet, and J.-F. Fels (2001), Seismological evidence on the geometry of the orogenic system in central-northern Ecuador (South America), seismological evidence on the geometry of the orogenic system in central-northern Ecuador (South America), Geophys. Res. Lett., 28(19), 3749–3752.
Gutscher, M.-A., J. Malavieille, S. Lallemand, and J.-Y. Collot (1999), Tectonic segmentation of the North Andean margin: Impact of the Carnegie Ridge collision, Earth Planet. Sci. Lett., 168, 255–270.
Hall, S., D. L. Farber, L. Audin, and R. C. Finkel (2012), Recently active contractile deformation in the forearc of southern Peru, Earth Planet. Sci. Lett., 337–338, 85–92.
Herring, T. A., R. W. King, and S. C. McClusky (2010), Introduction to GAMIT/GLOBK, release 10.4, Department of Earth, Atmospheric, and Planetary Sciences, Massachussetts Institute of Technology.
Hibsch, C., A. Alvarado, H. Yepes, V. H. Pérez, and M. Sébrier (1997), Holocene liquefaction and soft-sediment deformation in Quito (Ecuador): A paleoseismic history recorded in lacustrine sediments, J. Geodynamics, 24(1–4), 259–280.
Hughes, R., and L. Pilatasig (2002), Cretaceous and Tertiary terrane accretion in the Cordillera Occidental of the Andes of Ecuador, Tectonophysics, 245, 29–48.
Instituto Geofísico-EPN (2012), Focal mechanisms data base, compiled by Segovia M., Vaca S., Alvarado A., Internal Report. Jackson, J., R. Norris, and J. Youngson (1996), The structural evolution of active fault and fold systems in central Otago, New Zealand:
Evidence revealed by drainage patterns, J. Struct. Geol., 18(2/3), 217–234.
Jaillard, E., B. Guillier, M.-A. Bonnardot, R. Hassani, H. Lapierre, and J. Toro (2005), Orogenic buildup of the Ecuadorian Andes, 6th International Symposum on Andean Geodynamics (ISAG) Barcelona, Extended Abstracts, 404–407.
Jaillard, E., H. Lapierre, M. Ordoñez, J. Toro, A. Amortegui, and J. Vanmelle (2009), Accreted oceanic terranes in Ecuador: Southern edge of the Caribbean Plate?, Geol. Soc. Lond. Spec. Publ., 328, 469–485, doi:10.1144/SP328.19.
Keller, E., L. Gurrola, and T. Tierney (1999), Geomorphic criteria to determine direction of lateral propagation of reverse faulting and folding, Geology, 27(6), 515–518.
Kendrick, E., M. Bevis, R. Smalley, B. Brooks, R. B. Vargas, E. Lauria, and L. P. S. Fortes (2003), The Nazca-South America Euler vector and its rate of change, J. South Am. Earth Sci., 16, 125–131.
Kennan, L., and J. Pindell (2009), Dextral shear, terrane accretion and basin formation in the Northern Andes: Best explained by interaction with a Pacific-derived Caribbean Plate?, Geol. Soc. Lond. Spec. Publ., 328, 487–531, doi:10.1144/SP328.20.
Lamarque, G. (2011), Analyse méthodologique pour la localisation de séismes dans la zone de Quito et corrélation avec les failles actives, Master thesis, Université de Nice Sophia-Antipolis, France, pp. 33.
Lavenu, A., T. Winter, and F. Dávila (1995), A Pliocene-Quaternary compressional basin in the Interandean Depression, Central Ecuador, Geophys. J. Int., 121, 279–300.
Leonard, M. (2010), Earthquake fault scaling: Self-consistent relating of rupture length, width, average displacement, and moment release, Bull. Seismol. Soc. Am., 100(5A), 1971–1988, doi:10.1785/0120090189.
Acknowledgments
This publication was made possible through support provided by the Institut de Recherche pour le Développement to UMS 2572 LMC14 (France) and ADN project (ANR-07-BLAN-143). We thank J. Aguilar for DEM preparation (IG-EPN), M. Hall, and Instituto Geofisico de Quito members that joined during thefield. Constructive reviews by G. Hilley, D. Rust, and N. Niemi helped to improve the manuscript. This contribution is part of an Ecuadorian-French cooperation program between the Instituto Geofísico, Escuela Politécnica Nacional (IG-EPN Quito, Ecuador), and the UMR Isterre (Grenoble, France). This is LGMT contribution 108.
Mamberti, M., H. Lapierre, D. Bosch, E. Jaillard, R. Ethien, J. Hernandez, and M. Polve (2003), Accreted fragments of the Late Cretaceous Caribbean-Colombian Plateau in Ecuador, Lithos, 66, 173–199.
Mégard, F., P. Roperch, M. Lebrat, C. Laj, T. Mourier, and C. Noblet (1987), L’occident Equatorien: Un terrain océanique pacifique accole au continent Sud-Américain, Bull. Inst. Fr. Et. And., XVI(1–2), 39–54.
Nocquet, J.-M., P. Mothes, and A. Alvarado (2009), Geodesia, geodinámica y ciclo sísmico en Ecuador, in Geología y Geofísica Marina y Terrestre del Ecuador: Desde la Costa Continental Hasta las Islas Galápagos, edited by J.-Y. Collot, V. Sallares, and N. Pazmiño, pp. 83–95, Comisión Nacional del Derecho del Mar (CNDM), Guayaquil-Ecuador.
Noni, B. G., M. A. Fernandez, and P. Peltre (1986), Accidentes Climáticos y Gestión de las Quebradas de Quito: Análisis de“aluvión” de La Raya del 23 de Enero de 1986, Paisajes Geográficos (Centro Panamericano de Estudios e Investigaciones Geográficas), 17, (in French). Pennington, W. (1981), Subduction of the Eastern Panama Basin and seismotectonics of northwestern South America, J. Geophys. Res.,
86(B11), 10,753–10,770.
Quidelleur, X., P. Y. Gillot, V. Soler, and J. C. Levèvre (2001), K/Ar dating extended into the last millennium: Application to the youngest effusive episode of the Teide volcano (Canary Islands, Spain), Geophys. Res. Lett., 28, 3067–3070.
Quidelleur, X., J. Carlut, P. Tchilingurian, A. Germa, and P. Y. Gillot (2009), Paleomagnetic directions from mid-latitude sites in the southern hemisphere (Argentina): Contribution to time averagedfield models, Phys. Earth. Planet Int., 172, 199–209.
Ramsey, L., R. Walker, and J. Jackson (2008), Fold evolution and drainage development in the Zagros mountains of Fars province, SE Iran, Basin Res., 20, 23–48, doi:10.1111/j.1365-2117.2007.00342.x.
Robin, C., P. Samaniego, J.-L. L. Pennec, P. Mothes, and J. van der Plicht (2008), Late Holocene phases of dome growth and Plinian activity at Guagua Pichincha volcano (Ecuador), J. Volcanol. Geotherm. Res., 176(1), 7–15, doi:10.1016/j.jvolgeores.2007.10.008.
Robin, C., J.-P. Eissen, P. Samaniego, H. Martin, H. Minard, and J. Cotton (2009), Evolution of the late Pleistocene Mojanda-Fuya Fuya volcanic complex (Ecuador), by progressive adakitic involvement in mantle magma sources, Bull. Volcanol., 71, 233–258, doi:10.1007/s00445-008-0219-9. Sauer, W. (1965), Geología del Ecuador, Ministerio de Educación, Quito, Ecuador.
Segovia, M., and A. Alvarado (2009), Breve análisis de la sismicidad y del campo de esfuerzos en el Ecuador, in Geología y Geofísica Marina y Terrestre del Ecuador: Desde la Costa Continental Hasta las Islas Galápagos, edited by J.-Y. Collot, V. Sallares, and N. Pazmiño, pp. 131–150, Comisión Nacional del Derecho del Mar (CNDM), Guayaquil-Ecuador.
Soulas, J.-P., A. Egüez, H. Yepes, and H. Pérez (1991), Tectónica activa y riesgo sísmico en los Andes Ecuatorianos y el extremo sur de Colombia, Bol. Geol. Ecuat., 2(1), 3–11.
Tibaldi, A., and L. Ferrari (1992), Latest Pleistocene-Holocene tectonics of the Ecuadorian Andes. In: R.A. Oliver, N. Vatin-Perignon and G. Laubacher (Editors), Andean Geodynamics, Tectonophysics, 205, 109–125.
Toro, J. (2007), Enregistrement des surrections liées aux accrétions de terrains océaniques: Les sédiments crétacé -paléogènes des Andes d’Equateur, Géologie Alpine, Memoire H.S. No 47, Université Joseph Fourier (Grenoble I), France, pp. 235.
Trenkamp, R., J. Kellog, J. Freymueller, and H. Mora (2002), Wide plate margin deformation, southern Central America and northwestern South America, CASA GPS observations, J. South Am. Earth Sci., 15, 157–171.
Villagómez, D. (2003), Evolución geológica Plio-Cuaternaria del Valle Interandino central en Ecuador (zona de Quito-Guayllabamba-San Antonio), Eng. thesis, Facultad de Geología, Escuela Politécnica Nacional, Quito, Ecuador, pp. 133.
Wesnousky, S. (1986), Earthquakes, Quaternay faults, and seismic hazard in California, J. Geophys. Res., 91(B12), 12,587–12,631.
Wesnousky, S. G. (2005), The San Andreas and Walker Lane fault systems, western North America: Transpression, transtension, cumulative slip and the structural evolution of a major transform plate boundary, J. Struct. Geol., 27, 1505–1512.
Wesnousky, S. (2010), Possibility of biases in the estimation of earthquake recurrence and seismic hazard from geologic data, Bull. Seismol. Soc. Am., 100(5A), 2287–2292, doi:10.1785/0120090370.
Whipple, K. (2004), Bedrock rivers and geomorphology of active orogens, Annu. Rev, Earth Planet Sci., 32, 151–185, doi:10.1146/annurev. earth.32.101802.120356.
White, S., R. Trenkamp, and J. Kellogg (2003), Recent crustal deformation and the earthquake cycle along the Ecuador-Colombia subduction zone, Earth Planet. Sci. Lett., 216, 231–242, doi:10.1016/S0012-821X(03)00535-1.
Winkler, W., D. Villagómez, R. Spikings, P. Abegglen, S. Tobler, and A. Egüez (2005), The Chota basin and its significance for the inception and tectonic setting of the inter-Andean depression in Ecuador, J. South Am. Earth Sci., 19, 5–10.
Winter, T., J.-P. Avouac, and A. Lavenu (1993), Late Quaternary kinematics of the Pallatanga strike-slip fault (Central Ecuador) from topographic measurements of displaced morphological features, Geophys. J. Int., 115, 905–920.

![Figure 7. Distribution of the local microseismicity in Quito area, earthquakes depth < 20 km, data issued of IG-EPN Quito [Lamarque, 2011]](https://thumb-eu.123doks.com/thumbv2/123doknet/13752359.437822/9.918.326.797.140.522/figure-distribution-microseismicity-quito-earthquakes-issued-quito-lamarque.webp)
![Table 2. Focal Mechanism Solutions for Quito Area, After: Global Centroid Moment Tensor (GCMT), Calahorrano [2001] (AC),Segovia and Alvarado [2009] (S&A), and IG: Instituto Geofísico-EPN [2012], (M d ) Coda Magnitude](https://thumb-eu.123doks.com/thumbv2/123doknet/13752359.437822/10.918.64.862.163.783/mechanism-solutions-centroid-calahorrano-alvarado-instituto-geofísico-magnitude.webp)


