Abl suppresses cell extrusion and
intercalation during epithelium folding
The MIT Faculty has made this article openly available.
Please share
how this access benefits you. Your story matters.
Citation
Jodoin, J. N., and A. C. Martin. “Abl Suppresses Cell Extrusion and
Intercalation during Epithelium Folding.” Molecular Biology of the
Cell 27.18 (2016): 2822–2832.
As Published
http://dx.doi.org/10.1091/mbc.E16-05-0336
Publisher
American Society for Cell Biology
Version
Final published version
Citable link
http://hdl.handle.net/1721.1/105212
Terms of Use
Creative Commons Attribution-NonCommercial-ShareAlike 3.0
MBoC |
ARTICLE
Abl suppresses cell extrusion and intercalation
during epithelium folding
ABSTRACT Tissue morphogenesis requires control over cell shape changes and rearrange-ments. In the Drosophila mesoderm, linked epithelial cells apically constrict, without cell ex-trusion or intercalation, to fold the epithelium into a tube that will then undergo epithelial-to-mesenchymal transition (EMT). Apical constriction drives tissue folding or cell extrusion in different contexts, but the mechanisms that dictate the specific outcomes are poorly under-stood. Using live imaging, we found that Abelson (Abl) tyrosine kinase depletion causes api-cally constricting cells to undergo aberrant basal cell extrusion and cell intercalation. abl de-pletion disrupted apical–basal polarity and adherens junction organization in mesoderm cells, suggesting that extruding cells undergo premature EMT. The polarity loss was associated with abnormal basolateral contractile actomyosin and Enabled (Ena) accumulation. Depletion of the Abl effector Enabled (Ena) in abl-depleted embryos suppressed the abl phenotype, consistent with cell extrusion resulting from misregulated ena. Our work provides new insight into how Abl loss and Ena misregulation promote cell extrusion and EMT.
INTRODUCTION
Embryonic development requires morphogenetic events that al-ter the shape of cells and tissues (Lecuit et al., 2011). Defects in tissue morphogenesis result in abnormal organ formation, and genes and processes that reactivate morphogenetic processes later in life have been linked to metastasis (Yamada and Cukier-man, 2007; Wang et al., 2012). Thus it is important to understand how morphogenesis is precisely regulated. Epithelial tissue fold-ing is driven by apical constriction, a cell-shape change that alters a columnar cell into a wedged-shape cell (Leptin and Grunewald, 1990; Leptin, 1995). During constriction, nonmuscle myosin II (MyoII) contracts a network of actin filaments (F-actin) spanning the apical surface, generating a force that is propa-gated across the tissue via catenin-cadherin–containing adherens
junctions (AJs) (Franke et al., 2005; Martin et al., 2009, 2010). In addition, apical constriction drives other morphogenetic events, such as cell extrusion and delamination (Marinari et al., 2012; Slattum and Rosenblatt, 2014), although the mechanism deter-mining the morphogenetic outcome of apical constriction is poorly understood.
In Drosophila, transcription factors Twist and Snail promote both apical constriction of ventral cells to induce tissue folding into an epithelial tube within the embryo (called the ventral furrow; Figure 1A) and then epithelial-to-mesenchymal transition (EMT) of the epi-thelial tube (Leptin, 1991; Martin et al., 2009; Clark et al., 2011). Twist and Snail promote EMT, in part, via repression of E-cadherin (E-cad) transcriptional activation (Vesuna et al., 2008; Shamir et al., 2014). E-cad repression promotes the loss of apical–basal polarity and cell–cell junctions and induces cell migration of the mesoderm, features recapitulated in metastatic cancer (Onder et al., 2008). Reactivation of the EMT program later in life results in this disease state. Apically constricting cells are mechanically coupled to each other during tissue folding (Martin et al., 2010), and no cell extrusion occurs, suggesting that a mechanism functions to prevent cell extru-sion before EMT.
Abl tyrosine kinase has conserved roles in tissue morphogen-esis and disease states (Koleske et al., 1998; Fox and Peifer, 2007). Drosophila Abl regulates apical F-actin organization during apical constriction and tissue folding via negative regulation of Enabled (Ena; Fox and Peifer, 2007). Ena binds to F-actin barbed
Monitoring Editor Denise Montell University of California, Santa Barbara Received: May 27, 2016 Revised: Jun 20, 2016 Accepted: Jul 11, 2016
This article was published online ahead of print in MBoC in Press (http://www .molbiolcell.org/cgi/doi/10.1091/mbc.E16-05-0336) on July 20, 2016. The authors declare no competing financial interests.
*Address correspondence to: Adam C. Martin ([email protected]).
© 2016 Jodoin and Martin. This article is distributed by The American Society for Cell Biology under license from the author(s). Two months after publication it is available to the public under an Attribution–Noncommercial–Share Alike 3.0 Unported Creative Commons License (http://creativecommons.org/licenses/by -nc-sa/3.0).
“ASCB®,” “The American Society for Cell Biology®,” and “Molecular Biology of
the Cell®” are registered trademarks of The American Society for Cell Biology.
Abbreviations used: Abl, Abelson; AJ, adherens junction; β-cat, β-catenin; dsRNA, double-stranded RNA; E-cad, E-cadherin; EMT, epithelial-to-mesenchymal transition; Ena, Enabled; MyoII, myosin II; shRNA, small hairpin RNA.
Jeanne N. Jodoin and Adam C. Martin*
RESULTS
Abl prevents cell extrusion and intercalation of ventral cells during apical constriction
During Drosophila gastrulation, ventral cells apically constrict in a co-ordinated manner; cells constrict their apical surface at similar rates, such that apical surface areas are homogeneous (Figure 1, A and B). Abl is required for this coordinated apical constriction; abl4-null
mu-tants exhibited uncoordinated constriction, resulting in populations of larger, unconstricted cells (Supplemental Figure S1B, green arrow) and smaller, constricted cells (Supplemental Figure S1B, red arrow; Fox and Peifer, 2007). Flies expressing small hairpin RNA (shRNA) targeting abl, which effectively depletes ∼83% of abl transcript (Jodoin et al., 2015), recapitulated the uncoordinated-constriction ends to promote actin elongation and restrict actin capping
(Bear and Gertler, 2009; Hansen and Mullins, 2010). Abl also pro-motes AJ dynamics during tissue elongation via β-catenin (β-cat;
Drosophila armadillo) phosphorylation (Tamada et al., 2012). In
mammalian systems, misregulation of Abl is associated with me-tastasis; Abl overexpression leads to hyperproliferation and tu-mor formation, and Abl depletion results in metastasis and inva-sion (Hayes et al., 2013). Moreover, increased levels of mammalian Ena increase the occurrence of metastasis in animal models and breast cancer (Philippar et al., 2008; Oudin et al., 2016). Here we identify a mechanism by which loss of Abl and Ena misregulation, combined with Snail and Twist expression, promotes EMT-like be-havior during tissue folding.
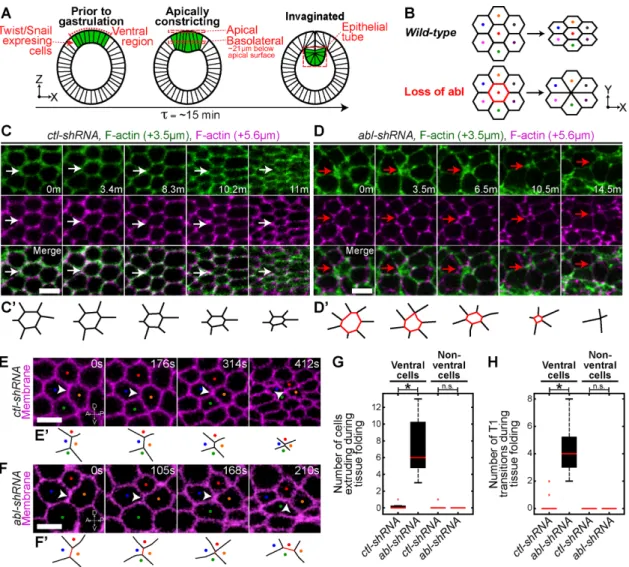
FIGURE 1: Abl suppresses cell extrusion and intercalation during apical constriction. (A) Schematic of ventral furrow formation. Green denotes Twist and Snail expressing–ventral cells. (B) Schematic of cell behavior during apical constriction. Colored dots track cells. Red cell denotes cell extrusion. (C, D) Time-lapse images of constricting cells from embryos expressing indicated UAS-shRNA and Utr::GFP (F-actin, cell outlines) at indicated depths below the apical surface. White arrow denotes a constricting cell. Red arrow denotes basal cell extrusion after loss of abl. (C′, D′) Schematized cells denoted by the white and red arrows in C and D, respectively. (E, F) Time-lapse images of embryos expressing indicated UAS-shRNA and Gap43::CH (membrane). White arrowheads and colored dots track an interface and cells, respectively. (E′, F′) Schematized interface denoted by white arrowheads in E and F, respectively. (G) Number of cells extruding during tissue folding. (H) Number of T1 transitions during tissue folding. Box plots (in this and all subsequent figures): red line, median; bottom and top, 25th and 75th percentiles, respectively; black dashed lines, lowest and highest values; red crosses, outliers beyond 1.5 times the interquartile range of the box edges. *p < 0.00001. n.s., not significant. Scale bars, 5 μm. See Materials and Methods for data point numbers for all experiments in this and all subsequent figures.
Apical and basolateral E-cad organization of ventral cells requires abl
Apical AJs are essential for segregating apical and basolateral cues (Harris and Peifer, 2004). A reduction of AJ components in apically constricting cells results in a loss of apical identity (Harris and Peifer, 2004) and aberrant T1 transitions (Martin et al., 2010). Thus we next assessed whether loss of abl disrupts apical AJs. In fixed images, E-cad is enriched at apical junctions in a punctate pattern, with rela-tively low enrichment in the center of the apical surface or the me-dioapical domain (Figure 2, F, I, and J, ctl-shRNA; and Supplemental Figure S1I). In contrast, abl depletion resulted in a ventral cell–spe-cific defect in which E-cad was localized across the entire apical sur-face (Figure 2, F, I, and J, abl-shRNA). Live imaging revealed that junctional E-cad observed in ctl-shRNA embryos was greatly de-creased in abl-shRNA embryos, and E-cad became more diffusely localized (Figure 2, K and L). We also observed a striking defect in basolateral E-cad organization after loss of abl. In ctl-shRNA em-bryos E-cad is distributed along basolateral junctions, with little vari-ability in its intensity (Figure 2, G and H). Loss of abl significantly in-creased variability in E-cad intensity (Figure 2H), with junctions displaying either a reduction in E-cad levels (Figure 2G, white arrow) or an overaccumulation of E-cad levels (Figure 2G, white arrow-head). Basolateral E-cad levels corresponded to varied basolateral F-actin levels (Figure 2G). Taken together, these data suggest that
abl promotes proper intercellular junction organization both apically
and basolaterally.
Failure to restrict E-cad to cell–cell interfaces and maintain a uni-form basolateral organization are likely due to the loss of apical– basal polarity in abl-depleted embryos. Basal cell extrusion from an epithelium is often associated with a change in E-cad levels and distribution (Friedl and Wolf, 2003; Slattum and Rosenblatt, 2014). Thus we propose that E-cad defects could play a role in promoting cell extrusion and rearrangements. In other mutants, such as
diaph-anous mutants, E-cad localization is similarly disrupted, but such
mutants do not result in cell extrusion (Mason et al., 2013), suggest-ing that defects in E-cad localization alone are not sufficient to drive extrusion.
Abl restricts actomyosin pulsing to the apical domain in constricting cells
Pulses of contractile actomyosin that drive apical constriction are restricted to the apical domain during tissue folding (Mason et al., 2013). Increased basolateral contractility can drive cell extrusion from the epithelium (Slattum and Rosenblatt, 2014; Wu et al., 2014, 2015). Because we found that Abl promotes apical–basal polarity, we sought to determine whether the apical contractile machinery is localized improperly in abl-shRNA embryos. In control embryos, pulsed actomyosin is not present in the basolateral do-main (Figure 3, A, C, E, G, and H, ctl-shRNA, yellow arrow; and Supplemental Figure S1C). abl depletion disrupted the position of contractile actomyosin. Dynamic F-actin, MyoII, and the MyoII acti-vator Rho kinase (ROCK) accumulated basolaterally in abl-depleted embryos (Figure 3 B, D, and F–J, abl-shRNA, red arrows; and Sup-plemental Figure S1D, red arrows), suggesting that actomyosin contractility occurs below the apical surface. Basally extruding cells exhibited basolateral pulsed actomyosin, although the presence of basolateral actomyosin in cells did not always result in extrusion (17 of 17 embryos). Moreover, basolateral MyoII and ROCK accu-mulation occurred at the onset of tissue folding (Figure 3, G and H, red arrows, and Supplemental Movie S2), indicating that the phe-notype is not due to delayed folding after loss of abl (Figure 3K). On the basis of these findings, we propose that the loss of abl phenotype (Supplemental Figure S1A), confirming that this is an
ef-fective tool with which to study Abl during tissue folding.
We previously performed a live-imaging RNA interference screen targeting known actomyosin regulators (Jodoin et al., 2015) and identified a surprising and unreported phenotype in
abl-shRNA embryos. Live imaging of abl-depleted embryos
re-vealed that ventral cells frequently undergo basal cell extrusion during tissue folding, a phenotype not observed in wild-type or control embryos (Figure 1, B–D, and G, Supplemental Figure S1, E, F, J, and K, and Supplemental Movie S1). Extrusion was not observed in cells adjacent to the ventral region that do not ex-press Twist and Snail (nonventral cells; Figure 1G). This suggests that Abl promotes the maintenance of cells within the epithelium during tissue folding. Loss of abl results in a disorganized, apical actomyosin meshwork, with some cells lacking apical actomyosin (Fox and Peifer, 2007). However, apical actomyosin pulses were observed in extruding cells (Supplemental Figure S1H; 17 of 17 embryos). Nuclei of extruding cells were not fragmented, sug-gesting that extrusion is not due to an apoptotic signal (Supple-mental Figure S1K). Moreover, before the onset of tissue folding, embryos depleted for abl exhibit reduced cell packing ( ctl-shRNA, 24 ± 1.1, and abl-shRNA, 19.9 ± 0.74, cells per 35-μm2 area;
p < 0.00001), suggesting that cell extrusion is not due to cell
crowding. In addition to extrusion, intercalation events known as T1 transitions, in which junctions aligned along the dorsal–ventral axis collapse and extend new junctions along the anterior–poste-rior axis (Bertet et al., 2004), were observed specifically in ventral cells during tissue folding in abl-depleted embryos (Figure 1, F and H, and Supplemental Figure S1G). T1 transitions were not ob-served in control embryos during tissue folding in either ventral or nonventral cells because this is before tissue elongation (Figure 1, E and H, and Supplemental Figure S1G). Aberrant ventral region T1 transitions occur with preferred direction, with junctions ori-ented along the dorsal–ventral axis shrinking and junctions along the anterior–posterior axis lengthening despite a lack of planar polarized actomyosin, which is important for intercalation during tissue elongation (Bertet et al., 2004; Zallen and Wieschaus, 2004). The elongation is in the direction in which tension is normally highest in the ventral furrow (Martin et al., 2010), suggesting that intercalation may be a response to global tissue tension. Together these data suggest that abl functions to prevent cell extrusion and intercalation specifically in Twist- and Snail-expressing cells during tissue folding.
Abl regulates apical–basal polarity of ventral cells
After tissue folding and tube formation, ventral cells lose apical– basal polarity and undergo EMT (Clark et al., 2011). To deter-mine whether cell extrusion is due to early EMT-like behavior, we tested whether abl depletion altered apical–basal polarity. Dur-ing apical constriction, the cell polarity protein Par-3 (Drosophila
Bazooka) localizes apically and establishes the apical domain by
setting the position of AJs (Figure 2D, ctl-shRNA, yellow arrows; Harris and Peifer, 2004, 2005). abl depletion resulted in the baso-lateral accumulation of Par-3 specific to the ventral region (Figure 1A, apically constricting; Figure 2, B–E, red arrows, and Supple-mental Figure S1I). This accumulation below that apical surface due to the loss of abl occurred after the onset of tissue folding (Figure 2C, red arrows). In contrast, Par-3 is restricted apically and not present in the basolateral domain of ctl-shRNA embryos (Figure 2, A, and C–E, yellow arrows). These data suggest that
abl maintains apical–basal polarity in ventral cells during tissue
Defects in AJ integrity result in basolateral MyoII accumulation
To test whether disrupted apical–basal polarity and AJs could cause actomyosin mislocalization, we mildly reduced β-cat levels via alters contractility in Twist- and Snail-expressing cells, such that
force generation occurs basolaterally in addition to apically (Sup-plemental Figure S1H), which, coupled with AJ defects, leads to cell extrusion and rearrangements.
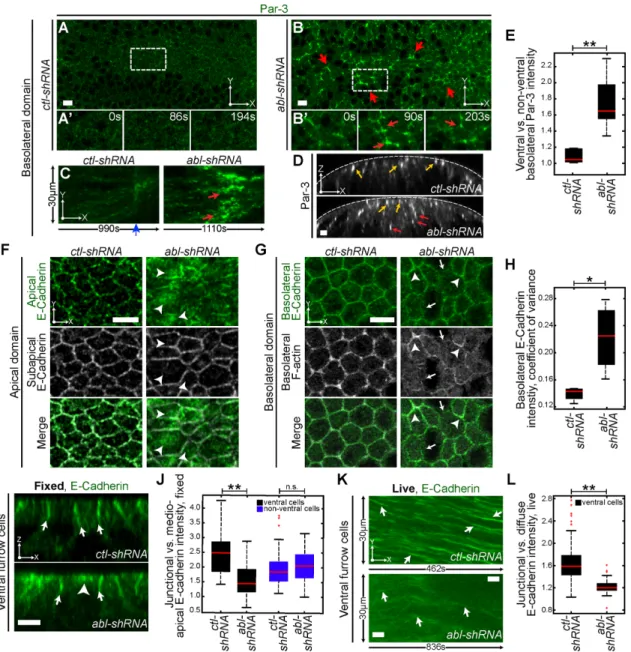
FIGURE 2: Abl depletion disrupts apical–basal polarity in ventral cells. (A–D) Embryos expressing indicated UAS-shRNA and GFP::Bazooka (Par-3). (A, B) Time-lapse images of basolateral domain of ventral cells (∼21 μm below the apical surface). Red arrows denote basolateral Par-3. (A′, B′) Zoomed-in region indicated by the white-dashed boxes in A and B, respectively. Red arrows denote dynamic basolateral Par-3. (C) Kymographs of embryos expressing indicated UAS-shRNA and Par-3. Kymographs of basolateral line along the anteroposterior axis. Red arrows denote basolateral Par-3, and blue arrowhead indicates the beginning of tissue folding. (D) Cross-sections. Yellow arrows denote apical Par-3, and red arrows denote basolateral Par-3. (E) Ratio of ventral vs. nonventral basolateral Par-3 intensity. (F) Fixed images of the apical domain in embryos expressing the indicated UAS-shRNA stained for E-cad. Apical E-cad, AJs (green). Subapical E-cad, cell outline (gray). White arrowheads denote pools of medioapical E-cad. (G) Fixed images of the basolateral domain (∼21 μm below the apical surface) in embryos expressing the indicated UAS-shRNA and stained for E-cad and phalloidin (F-actin). White arrows denote junctions lacking E-cad, and white arrowheads denote junctions overaccumulated with E-cad. (H) Basolateral E-cad intensity, coefficient of variance. (I) Cross-sections of fixed embryos expressing the indicated UAS-shRNA stained for E-cad. White arrows denote junctional pools of E-cad, and white arrowhead denotes medioapical pool of E-cad. (J) Ratio of junctional vs. medioapical E-cad intensity in fixed embryos. (K) Kymographs of embryos expressing the indicated UAS-shRNA and GFP::Ecad (E-cad). Kymographs are of
basolateral line along the anteroposterior axis. Images are maximum intensity projections of the top eight slices of each embryo (∼8 μm below apical surface). White arrows denote junctional E-cad. (L) Ratio of junctional vs. diffuse E-cad intensity in live embryos. **p < 0.00001, *p < 0.04, n.s., not significant. Scale bars, 5 μm.
only (Ctl) injection (Supplemental Figure S2, B and C, wild-type + β-cat dsRNA, red arrow), suggesting that the accumulation of baso-lateral actomyosin in abl-shRNA embryos was a downstream conse-quence of defective AJs. Of importance, basal cell extrusion was not observed in mildly β-cat-depleted embryos (Supplemental Figure S2E), suggesting that defects in AJ integrity and basolateral MyoII were not sufficient to induce extrusion. Thus an additional mecha-nism might be required.
Abl restricts Ena from the basolateral cortex in ventral cells
Ena was identified as an essential effector of abl during tissue fold-ing (Fox and Peifer, 2007). In wild-type and control embryos, Ena localized diffusely in the cytoplasm (Figure 4, A and E) but became injection of β-cat double-stranded RNA (dsRNA), previously shown
to effectively deplete β-cat (Tamada et al., 2012), into the embryo. Abl depletion causes partial disruption in AJ organization (Figure 2, F and G). Thus we mildly disrupted AJs to mimic abl-shRNA em-bryos. Complete down-regulation of β-cat results in a dramatic sep-aration of ventral cells at the onset of apical constriction (Martin
et al., 2010), whereas mild β-cat depletion resulted in only slight separations at the poles during the initiation of tissue folding (Sup-plemental Figure S2A, white arrow). Mild β-cat reduction also re-sulted in aberrant T1 transitions (Supplemental Figure S2D), reca-pitulating previous reports (Martin et al., 2010) and indicating that AJ integrity is disrupted. In ventral cells, we observed increased basolateral MyoII after mild β-cat depletion compared with
buffer-FIGURE 3: Abl depletion causes basolateral actomyosin dynamics in ventral cells. (A–F) Time-lapse images of the basolateral domain (∼21 μm below the apical surface) in ventral cells from embryos expressing the indicated UAS-shRNA and Utr::GFP (A, B, F-actin), Sqh::GFP and Gap43::mCherry fluorescent protein (CHFP) (C, D, MyoII and membrane), or ROCK::GFP and Gap43::CHFP (E, F, ROCK and membrane). (A′–F′) Time-lapse images of regions denoted by the white-dashed boxes in A–F, respectively. Red arrow denotes dynamic F-actin (B′), MyoII (D′), or ROCK (F′). (G, H) Time-lapse cross-sections of embryos expressing the indicated UAS-shRNA and Sqh::GFP (G) or ROCK::GFP (H) during apical constriction. Yellow and red arrows denote apical and basolateral pools of MyoII (G) and ROCK (H), respectively. (I) Basolateral domain (∼21 μm below the apical surface) in ventral cells from an embryo expressing
abl-shRNA, F-actin, and Sqh::CHFP (MyoII). White arrows denote basolateral F-actin and MyoII colocalization. (J) Ventral
ena depletion suppresses cell extrusion and rearrangements
in an abl mutant
To test whether misregulated Ena contributed to cell extrusions and intercalation that occurred in abl-depleted embryos, we down-reg-ulated ena via injection of ena-dsRNA, previously shown to effec-tively deplete ena (Kiger et al., 2003), in abl-shRNA embryos. We found that the timing of ventral furrow formation was reduced sig-nificantly in abl,ena–depleted embryos compared with abl -depleted embryos (Figure 5C), showing that dsRNA-mediated depletion of
ena in abl-shRNA embryos suppressed gross tissue-folding defects
(Fox and Peifer, 2007). of importance, reducing ena levels in
abl-shRNA embryos suppressed basal cell extrusion and T1 transitions
in ventral cells, as well as ventral cell–specific Par-3 and AJ defects (Figure 5, E–H). The ratio of junctional to medioapical E-cad levels increased significantly after ena-dsRNA injection compared with Ctl injection, indicating restoration of normal junctional enrichment (Figure 5F). Apical actomyosin meshwork defects and localization enriched at intercellular junctions in abl mutants (Figure 4, A and
E, yellow arrowhead; Fox and Peifer, 2007). We observed that apical Ena was not present uniformly at junctions in abl-shRNA embryos, similar to apical E-cad localization (Figures 2F and 4A, yellow arrowhead). In addition, Ena accumulated basolaterally in ventral cells with a localization similar to Par-3 and E-cad after abl depletion (Figure 2, B and G, and Figure 4, B and F, yellow arrow-head). Furthermore, basolateral Ena accumulation at junctions was not observed in nonventral cells, although Ena localized to apical junctions in these cells (Figure 4, C–F). This is consistent with the basolateral mislocalization of Ena being specific to Twist- and Snail-expressing cells in the ventral region but not apical Ena ac-cumulation. Ectopic Ena expression locally increases contractility (Furman et al., 2007). On the basis of these data, we hypothesized that the accumulation of basolateral Ena contributes to the cell extrusion present in abl-depleted embryos by increasing basolat-eral contractility.
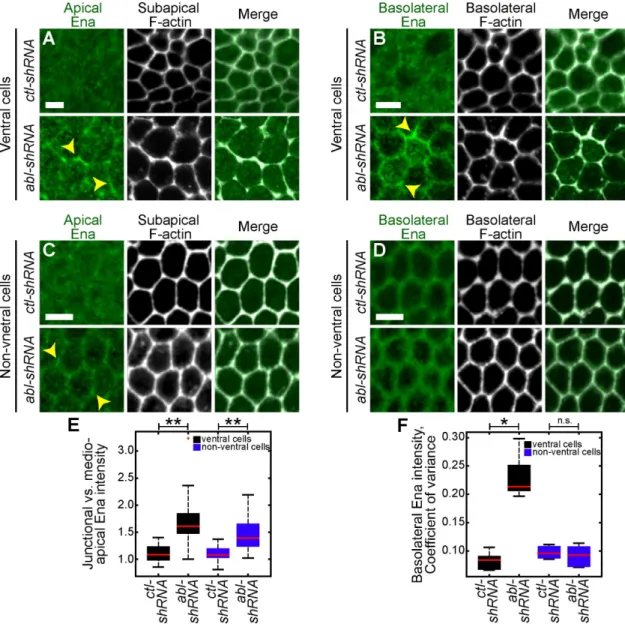
FIGURE 4: abl inhibits basolateral, cortical Ena localization in ventral cells. (A–D) Fixed embryos expressing the indicated UAS-shRNA stained for Ena (green) and phalloidin (F-actin, gray) showing either ventral cells (A, B) or nonventral, lateral cells (C, D). Yellow arrowheads denote Ena accumulation at junction. (E) Apical junctional vs. medioapical Ena intensity. (F) Basolateral Ena intensity, coefficient of variance. **p < 0.00001, *p < 0.003, n.s., not significant. Scale bars, 5 μm.
works across the ventral region of the embryo (Fox and Peifer, 2007). Reduction of the Abl effector ena in abl mutants suppressed gross morphological defects in tissue folding (Fox and Peifer, 2007). Here our work identifies different roles for Abl in maintaining cells within the epithelium during tissue folding, as well as in promoting apical– basal polarity and apical AJ positioning. We found that loss of abl results in aberrant basal cell extrusion and cell intercalation events. Correlation between basal cell extrusion and T1 transitions was not observed after loss of abl. We found that T1 transitions do not pref-erentially occur near or after extrusion of a cell or vice versa. Loss of adhesion results in T1 transitions (Supplemental Figure S2D), which occur independently of basal cell extrusion (Supplemental Figure S2E). Together these results suggest that cell extrusion and interca-lation are two different outcomes that occur due to the loss of abl. Moreover, abl-depleted embryos exhibit loss of polarity and AJ organization (Figure 6A), hallmarks of EMT. Because cell extrusion happens specifically in Twist- and Snail-expressing cells, we suggest also were suppressed after ena-dsRNA injection. abl-depleted
em-bryos displayed a discontinuous apical MyoII meshwork (Figure 5A; Fox and Peifer, 2007), whereas ena,abl–depleted embryos resulted in a more continuous apical MyoII meshwork (Figure 5A). Moreover,
ena down-regulation in abl-shRNA embryos significantly reduced
basolateral accumulation of MyoII (Figure 5, B and D, red arrow). Taken together, these data show that Ena misregulation in abl-de-pleted embryos disrupted apical–basal polarity, AJ positioning, and increased basolateral actomyosin, resulting in basal cell extrusion and intercalation during tissue folding.
DISCUSSION
Previous work described the role of Abl in promoting proper coordi-nated constriction and apical actomyosin organization during tissue folding (Fox and Peifer, 2007). abl-null mutants exhibit populations of both unconstricted and constricted cells and defects in tissue in-vagination and display discontinuous apical MyoII and F-actin
mesh-FIGURE 5: Ena depletion suppresses cell extrusion in abl-shRNA embryos. (A, B) Embryos expressing abl-shRNA and Sqh::GFP (MyoII) after Ctl (buffer only) injection or ena-dsRNA injection. (B) Time-lapse cross-sections of embryos expressing abl-shRNA and MyoII after the indicated injection. Yellow arrow denotes apical MyoII accumulation. Red arrows denote basolateral MyoII accumulation. (C) Timing of furrow formation. **p < 0.002, *p < 0.006. (D) Ventral vs. nonventral basolateral MyoII intensity. ***p < 0.003, **p < 0.006, *p < 0.02. (E) Ventral vs. nonventral basolateral Par-3 intensity. (F) Junctional vs. medioapical E-cad intensity. **p < 0.00001, *p < 0.0001. (G) Number of cells extruding during tissue folding. ***p < 0.00001, **p < 0.003, *p < 0.005. (H) Number of T1 transitions during tissue folding. *p < 0.00001. n.s., not significant. Scale bars, 10 μm.
tissue folding. Altered E-cad localization, namely higher levels of apical E-cad, could also support extrusion by allowing the apical surface to make contact with neighboring cells. Finally, a reduction in basolateral stiffness can lead to cell extrusion (Slattum and Rosen-blatt, 2014). Pulsatile actomyosin along basolateral junctions could potentially result in more-rapid F-actin turnover along junctions, as shown in cultured mammalian cells (Wu et al., 2014), reducing the junctional stiffness and promoting cell extrusion. Further work is needed to test these potential models and determine the mechan-ics driving basal cell extrusion before EMT after the loss of abl.
We show here that depletion of ena in abl-shRNA embryos sup-pressed all of the observed phenotypes in abl-depleted embryos, suggesting that Abl negatively regulates Ena in order to promote epithelial maintenance, polarity, and AJ positioning during tissue folding. During tissue elongation, β-cat was found to be an essential Abl substrate (Tamada et al., 2012); however, because ena down-regulation suppresses all observed phenotypes (Figure 5), we hy-pothesize that Ena is the critical Abl effector during tissue folding. Abl is required to inhibit cell intercalation during tissue folding (Figure 1) but functions to promote intercalation during elongation (Tamada
et al., 2012). This difference could be due to the expression of Twist
and Snail or a difference in the organization of the contractile machin-ery between tissue folding and elongation. Moreover, loss of abl dis-rupts Par-3 and actomyosin apical–basal polarity during tissue fold-ing (Figures 2 and 3) but not durfold-ing elongation (Tamada et al., 2012). Our findings are consistent with those of Fox and Peifer (2007). However, our data show how Abl and Ena regulate an EMT-like pro-cess, which provides insight into how Abl and Ena may influence metastasis (Philippar et al., 2008; Hayes et al., 2013; Oudin et al., 2016). Our work highlights the importance of proper Ena regulation via Abl in maintaining cells within the epithelium during tissue fold-ing, before EMT. Kinase-dependent and -independent roles have been identified for Abl in regulating F-actin–dependent processes (Henkemeyer et al., 1990; Dudek et al., 2010; Courtemanche et al., 2015). Whether Abl inhibits cell extrusion during tissue folding via direct regulation of Ena function and/or localization or indirectly via regulation of polarity or junctional components will be of interest for understanding how Abl regulates epithelial integrity and polarity.
MATERIALS AND METHODS
Fly stocks
UAS-β-gal-shRNA (control-shRNA) and UAS-abl-shRNA expression were driven by the following maternal driver lines: [Mat67, Utr::green fluorescent protein (GFP)] (Rauzi et al., 2013), [Mat67, sqh::GFP; Mat15, Gap43::CHFP], [Mat67, utr::GFP; Mat15, sqh::CHFP], [Mat67, ubi-GFP::ROCK] (Bardet et al., 2013), [Mat67, Histone::GFP], [Mat67, Ecad(knock in)::GFP] (Huang et al., 2009), and [Mat67, UAS-GFP::Bazooka] (Benton and St Johnston, 2003). To image abl4
mutants and control (ctl) embryos, germline clones were generated using the FLP-DFS technique by heat shocking mutant/OvoD larvae for 2 h at 37°C for 3–4 d (Chou and Perrimon, 1992). For abl4 mutants,
[yw,hsflp; FRT2A, OvoD/abl4, FRT2A] embryos were imaged
(Supple-mental Figure S1B). For ctl, [yw,hsflp; abl4, FRT2A/ TM3] embryos
were imaged (Supplemental Figure S1B). To image the abl4 germline
live (Supplemental Figure S1, C–E), utr::GFP (F-actin) was balanced on the second chromosome of abl4 mutant embryos [utr::GFP/Cyo;
abl4, FRT2A/TM3], and germline clones were generated.
Making dsRNA
The following primers were used to generate ∼500–base pair frag-ments of each gene of interest: β-cat (as described and shown to
deplete β-cat in Tamada et al., 2012), β-cat forward, 5′-TAA TAC that loss of abl promotes premature initiation of EMT during the
tis-sue folding process.
Loss of abl and cell extrusion are accompanied by relocalization of the apical contractile machinery to basolateral junctions, suggest-ing that contractility occurs abnormally below the apical surface (Figure 6A), which can drive basal cell extrusion (Wu et al., 2014, 2015). Ena, which can locally increase contractility (Furman et al., 2007), also accumulates along basolateral junctions in abl mutants (Figure 6A), further suggesting that the loss of abl promotes baso-lateral contractility. We hypothesize that basobaso-lateral contractility, which, in combination with apical contractility, drives basal cell ex-trusion after loss of abl (Figure 6B; Wu et al., 2014, 2015). The het-erogeneous nature of Ena and actomyosin accumulation along ba-solateral junctions could result in random cell extrusion within the ventral region rather than premature EMT of all ventral cells. Under-standing why loss of polarity and E-cad organization defects, as well as basolateral actomyosin and Ena accumulation, is not ubiquitous across the ventral region will be important for understanding which cells undergo extrusion and premature EMT. Cells exhibit heteroge-neity in their behavior at the onset of apical constriction (Xie and Martin, 2015). This could also play a role in determining which cells undergo extrusion in abl mutants.
Because we did not observe clear correlation between local ba-solateral actomyosin accumulations and cell extrusion, we suggest that extrusion could result from a nonautonomous effect of basolat-eral contractility, which could possibly increase latbasolat-eral pressure on cells in the epithelial sheet. Alternatively, E-cad localized along lat-eral junctions can organize actin to generate tension; changes in lateral E-cad levels and altered tension are associated with cell extru-sion (Wu et al., 2014). Thus changes in E-cad organization along ba-solateral junctions in abl mutants could potentially alter baba-solateral tension, promoting extrusion. More work is needed to understand the mechanical differences that result in cells and tissues lacking abl function. In addition, changes in E-cad organization after loss of abl could also play a role in driving basal cell extrusion. Loss of E-cad protein levels is sometimes associated with EMT (Onder et al., 2008). Defects in E-cad organization in abl-shRNA embryos could be due to a loss of E-cad protein, thus triggering premature EMT during
FIGURE 6: Model for basal cell extrusion in abl-shRNA embryos. (A) Schematic of ventral cells in ctl-shRNA and abl-shRNA embryos. (B) Model for how Abl prevents cell extrusion during tissue folding.
of multiple z-sections (∼2–3 μm), unless otherwise noted. Subapical images are one z-slice, ∼1–2 μm below the apical sections. Cross-sections of embryos were generated using the reslice command in Fiji.
Statistical analysis
Significance between data sets was determined using the Student’s
t test. Data sets are represented with box-and-whisker-plots. A red
line indicates the median. Bottom and top boxes mark the 25th and 75th percentiles of the data set, respectively. Black dashed lines mark the lowest and highest values of the data set, respectively. Red crosses indicate outliers that are beyond 1.5 times the interquartile range of the box edges. Box plots are presented in Figures 1, G and H, 2, E, H, J, and L, 3, J and K, 4, E and F, and 5, C–H, and Supple-mental Figures S1, F and G, and S2, C–E.
Microscopy image analysis
Cell extrusion was quantified by manually tracking cells leaving the epithelium, using Gap34::CHFP (membrane) or Utr::GFP (F-actin) to visualize cell outlines. To quantify cell extrusion, the ventral region and the ectoderm adjacent the ventral region (nonventral cells) were examined. For the ventral region, the average field of view was 29.4 × 9 and 25.1 × 7.5 cells for control and abl -depleted embryos, respectively. All visible cells within the field of view were quantified. For ctl-shRNA and abl-shRNA, 13 and 17 embryos were analyzed, respectively. For ctl and abl4 mutants, three and five embryos were
analyzed, respectively. For abl-shRNA plus buffer-only injection and
abl-shRNA plus ena-dsRNA injection, six embryos per condition
were analyzed. For wild-type plus buffer-only injection and wild-type plus β-cat dsRNA injection, four embryos per condition were ana-lyzed. The number of extruding cells during tissue folding per indi-vidual embryo was counted, and the number of cell extrusion events for each data set is presented in Figures 1G and 5G and Supple-mental Figures S1F and S2E.
T1 transitions were quantified by manually tracking the reorienta-tion of cell–cell contacts along the dorsoventral axis to the antero-posterior axis using Gap34::CHFP (membrane) or Utr::GFP (F-actin) to visualize the cell outlines. For ctl-shRNA and abl-shRNA, 13 and 17 embryos were analyzed, respectively. For ctl and abl4 mutants,
three and five embryos were analyzed, respectively. For abl-shRNA plus buffer-only injection and abl-shRNA plus ena-dsRNA injection, six embryos per condition were analyzed. For wild-type plus buffer-only injection and wild-type plus β-cat dsRNA injection, four em-bryos were analyzed. Number of T1 transitions during tissue folding is presented in Figures 1H and 5H and Supplemental Figures S1G and Figure S2D.
Cell crowding was assessed by manually counting the number of cells within a 35 μm × 35 μm area just before onset of apical MyoII. Only embryos with normal cellularization after loss of abl were counted. Three regions within one embryo were counted and aver-aged together; for ctl-shRNA and abl-shRNA, six embryos were assessed.
Dynamic Par-3, F-actin, MyoII, and Rho kinase in the basolateral domain were identified by imaging embryos expressing indicated UAS-shRNA and GFP::Par-3 (Par-3), Utr::GFP (F-actin), Sqh::GFP (MyoII), or ubi-ROCK::GFP (ROCK) ∼21 μm below the apical surface. For ctl-shRNA, at least five embryos were analyzed per fluorescent marker. For abl-shRNA, six Par-3–, eight F-actin–, nine MyoII-, and six ROCK-expressing embryos were analyzed. For ctl and abl4
mu-tants expressing utr::GFP, three and five embryos were analyzed, respectively. Representative images are presented in Figures 2, A–D (Par-3), and 3, A, B, and I, Supplemental Figure S1, C and D (F-actin), GAC TCA CTA TAG GGA GAC CAC CAA GAA GCG GCT ATC CAT
AGA GC-3′, and β-cat reverse, 5′-TAA TAC GAC TCA CTA TAG GGA GAC CAC CAA TCG GTA TCG TAC CAG GCA GC-3′; and
Ena (as described and shown to deplete Ena in Kiger et al., 2003),
Ena forward, 5′-TAA TAC GAC TCA CTA TAG GGG CCG CCT TTC CTT TGA TT-3′, and Ena reverse, 5′-TAA TAC GAC TCA CTA TAG GGC GAG CCG AGG ATG TTC TAT T-3′. Each primer contains a T7 sequence (TAA TAC GAC TCA CTA TAG GG) at its 5′-end. dsRNA was made using the MEGAscript T7 transcription kit (Ambion, Austin, TX) and resuspended in injection buffer (0.1× phosphate-buffered saline [PBS] in RNase-free water).
dsRNA injections
Embryos were dechorionated, mounted ventral side up, and then desiccated for 5 min (Drierite, Drierite Company, Salt Lake City, UT). A 3:1 halocarbon 700/halocarbon 27 oil was added on the embryo for injection. The 0–30-min-old embryos (before pole cell formation) were injected laterally with a drop size of ∼40 μm, with estimated a 1:200–1:300 dilution for the dsRNA. ena-dsRNA and β-cat–dsRNA were injected into embryos at 2 μg/μl and 1.5 ng/μl, respectively. For buffer-only control, 0.1× PBS was injected.
Microscope image acquisition
Live and fixed images were acquired on a Zeiss LSM 710 confocal microscope with a 40×/numerical aperture 1.2 Apochromat water objective (Zeiss, Jena, Germany) and argon-ion, 561-nm diode, 594-nm HeNe, and 633-nm HeNe lasers. Pinhole settings were 1–2 Airy units. For two-color live imaging, simultaneous excitation was used with band-pass filters set at 499–561 nm for GFP and 599–696 nm for CHFP. All images are representative of at least six embryos unless otherwise stated.
Live imaging. Embryos were dechorionated with 1:1 bleach/water
for 2 min, washed with water, and mounted ventral side up onto a slide coated with embryo glue (double-sided tape soaked in hep-tane). Spacer coverslips (No. 1.5) were attached using glue, and a coverslip was attached to create a chamber so that embryos were not compressed. Halocarbon 27 oil was added to the chamber. Imaging was performed at room temperature (∼23°C) on a Zeiss LSM 710 confocal microscope.
Fixed imaging. Embryos were dechorionated with 1:1 bleach and
water solution for 2 min, washed with water, and then fixed in 4% paraformaldehyde in 0.1 M phosphate buffer at pH 7.4 with 50% heptane for 30 min and manually devitellinized. To visualize F-ac-tin, embryos were then incubated with Alexa Fluor 568–conjugated phalloidin (Invitrogen, Carlsbad, CA) diluted in PBS plus 0.1% Triton X-100 (PBST) overnight (∼12 h) at 4°C. Embryos were blocked with 10% bovine serum albumin (BSA) in PBST. Primary and sec-ondary antibodies were diluted in 5% BSA in PBST. Embryos were mounted ventral side up using AquaPolymount (Polysciences). The following antibodies were used for immunofluorescence: primary, anti–E-cadherin (Dcad2, 1:25; Developmental Studies Hybridoma Bank, Iowa City, IA) and anti-Enabled (5G2, 1:100; Developmental Studies Hybridoma Bank); and secondary, Alexa Fluor 488 (1:500; Invitrogen).
Microscopy image processing
Images were processed with Photoshop CS6 (Adobe, San Jose, CA) and Fiji (http://fiji.sc/wiki/index.php/Fiji). Figures were prepared us-ing Illustrator C6 (Adobe). A Gaussian filter (kernel = 1 pixel) was applied to images. Apical images are maximum intensity projections
Figures 3, C, D, G, and I (MyoII), and 3, E, F, and H (ROCK). For Figure 3, G and H, the onset of apical constriction is defined by the presence of apical MyoII or ROCK accumulation. To compare em-bryos at the same developmental timing, emem-bryos with invagination occurring at the poles were compared.
Basolateral MyoII and Par-3 intensity was quantified using Fiji. For each embryo, cross-sections were constructed, and 40 slices in the center of the embryo were projected. Intensities were measured below the ventral furrow region and ∼40 μm away in the nonventral region. For ctl-shRNA, at least five embryos were analyzed per fluo-rescent marker. For abl-shRNA, six and nine embryos were analyzed for Par-3 and MyoII, respectively. For abl-shRNA plus buffer-only in-jection and abl-shRNA plus ena-dsRNA inin-jection, at least five em-bryos per condition were analyzed. For wild-type plus buffer-only injection and wild-type plus β-cat dsRNA injection, four embryos per condition were analyzed. The ratio of MyoII intensity in the ven-tral versus the nonvenven-tral region is presented in Figures 3J and 5D and Supplemental Figure S2C. The ratio of Par-3 expression in the ventral versus the nonventral region is presented in Figure 2E. To compare embryos at the same developmental timing, embryos with invagination occurring at the poles were compared.
Basolateral E-cad variability. Embryos fixed and stained for E-cad
were quantified using Fiji by measuring E-cad or Par-3 intensity along basolateral junctions. For ctl-shRNA and abl-shRNA, at least five embryos were analyzed, and the junctions of at least 30 cells were measured in ventral cells. The coefficient of variance (SD/mean) of basolateral E-cad intensity is presented in Figure 2, E and H.
Junctional-to-medioapical E-cad intensity. Fixed embryos stained
for E-cad were quantified using Fiji by measuring E-cad expression intensity at the junctions and in the medioapical domain. For
ctl-shRNA and abl-ctl-shRNA, at least six embryos were analyzed, and 50
junctional versus medioapical comparisons were made. The ratio of E-cad intensity in fixed cells is presented in Figure 3J.
Live embryos expressing E-cad(KI)::GFP (E-Cad) were analyzed with Fiji by generating kymographs of maximum intensity projec-tions of the top eight slices (∼8 μm below the apical surface) and measuring the intensity of E-cad at and between junctions (diffusely localized) at a 85-μm line scan at three locations within each kymo-graph. For ctl-shRNA and abl-shRNA, three embryos were analyzed, and 90 junctional versus medioapical comparisons were made. For
abl-shRNA plus buffer-only injection and abl-shRNA plus ena-dsRNA
injection, at least four embryos were analyzed, and 90 junctional versus medioapical comparisons were made per condition. The ra-tio between juncra-tional and diffuse E-cad intensity in live cells is shown in Figures 3L and 5F.
Ena localization quantification
Junctional-to-medioapical Ena. Fixed embryos stained for Ena
were quantified using Fiji by measuring Ena intensity at the junctions and in the medioapical domain. For ctl-shRNA and abl-shRNA, at least seven embryos were analyzed, and 50 junctional versus medio-apical comparisons were made in both ventral and lateral cells. The ratio of Ena intensity in fixed cells is presented in Figure 4E.
Basolateral Ena intensity. Fixed embryos stained for Ena were
quan-tified using Fiji by measuring Ena intensity along basolateral junc-tions. For ctl-shRNA and abl-shRNA, at least five embryos were ana-lyzed, and the junctions of at least 30 cells were measured in both ventral and lateral cells. The coefficient of variance (SD/mean) of basolateral Ena intensity in fixed cells is presented in Figure 4F.
ACKNOWLEDGMENTS
We thank the Bloomington Drosophila Stock Center (Bloomington, IN) for fly stocks and antibodies, as well as Thomas Lecuit, Johanns Bellaiche, Mark Peifer, and Eric Wieschaus for generously providing stocks used in this study. We also thank Matthew R. Broadus, Frank Gertler, Terry Orr-Weaver, and the Martin lab for helpful comments and discussion of the manuscript. This work was supported by National Institute of General Medical Sciences Grants F32GM113425 to J.N.J. and R01GM105984 to A.C.M.
REFERENCES
Bardet P-L, Guirao B, Paoletti C, Serman F, Léopold V, Bosveld F, Goya Y, Mirouse V, Graner F, Bellaïche Y (2013). PTEN controls junction length-ening and stability during cell rearrangement in epithelial tissue. Dev Cell 25, 534–546.
Bear JE, Gertler FB (2009). Ena/VASP: towards resolving a pointed contro-versy at the barbed end. J Cell Sci 122, 1947–1953.
Benton R, St Johnston D (2003). A conserved oligomerization domain in drosophila Bazooka/PAR-3 is important for apical localization and epi-thelial polarity. Curr Biol 13, 1330–1334.
Bertet C, Sulak L, Lecuit T (2004). Myosin-dependent junction remodel-ling controls planar cell intercalation and axis elongation. Nature 429, 667–671.
Chou TB, Perrimon N (1992). Use of a yeast site-specific recombinase to produce female germline chimeras in Drosophila. Genetics 131, 643–653.
Clark IBN, Muha V, Klingseisen A, Leptin M, Müller H-AJ (2011). Fibro-blast growth factor signalling controls successive cell behaviours during mesoderm layer formation in Drosophila. Development 138, 2705–2715.
Courtemanche N, Gifford SM, Simpson MA, Pollard TD, Koleske AJ (2015). Abl2/Abl-related gene stabilizes actin filaments, stimulates actin branch-ing by actin-related protein 2/3 complex, and promotes actin filament severing by cofilin. J Biol Chem 290, 4038–4046.
Dudek SM, Chiang ET, Camp SM, Guo Y, Zhao J, Brown ME, Singleton PA, Wang L, Desai A, Arce FT, et al. (2010). Abl tyrosine kinase phosphory-lates nonmuscle Myosin light chain kinase to regulate endothelial barrier function. Mol. Biol Cell 21, 4042–4056.
Fox DT, Peifer M (2007). Abelson kinase (Abl) and RhoGEF2 regulate actin organization during cell constriction in Drosophila. Development 134, 567–578.
Franke JD, Montague RA, Kiehart DP (2005). Nonmuscle myosin II gener-ates forces that transmit tension and drive contraction in multiple tissues during dorsal closure. Curr Biol 15, 2208–2221.
Friedl P, Wolf K (2003). Tumour-cell invasion and migration: diversity and escape mechanisms. Nat Rev Cancer 3, 362–374.
Furman C, Sieminski AL, Kwiatkowski AV, Rubinson DA, Vasile E, Bronson RT, Fässler R, Gertler FB (2007). Ena/VASP is required for endothelial barrier function in vivo. J Cell Biol 179, 761–775.
Hansen SD, Mullins RD (2010). VASP is a processive actin polymerase that requires monomeric actin for barbed end association. J Cell Biol 191, 571–584.
Harris TJC, Peifer M (2004). Adherens junction-dependent and -indepen-dent steps in the establishment of epithelial cell polarity in Drosophila. J Cell Biol 167, 135–147.
Harris TJC, Peifer M (2005). The positioning and segregation of apical cues during epithelial polarity establishment in Drosophila. J Cell Biol 170, 813–823.
Hayes KE, Walk EL, Ammer AG, Kelley LC, Martin KH, Weed SA (2013). Ableson kinases negatively regulate invadopodia function and invasion in head and neck squamous cell carcinoma by inhibiting an HB-EGF autocrine loop. Oncogene 32, 4766–4777.
Henkemeyer M, West SR, Gertler FB, Hoffmann FM (1990). A novel tyrosine kinase-independent function of Drosophila abl correlates with proper subcellular localization. Cell 63, 949–960.
Huang J, Zhou W, Dong W, Watson AM, Hong Y (2009). Directed, efficient, and versatile modifications of the Drosophila genome by genomic engineering. Proc Natl Acad Sci USA 106, 8284–8289.
Jodoin JN, Coravos JS, Chanet S, Vasquez CG, Tworoger M, Kingston ER, Perkins LA, Perrimon N, Martin AC (2015). Stable force balance between epithelial cells arises from F-actin turnover. Dev Cell 35, 685–697.
Philippar U, Roussos ET, Oser M, Yamaguchi H, Kim HD, Giampieri S, Wang Y, Goswami S, Wyckoff JB, Lauffenburger DA, et al. (2008). A Mena invasion isoform potentiates EGF-induced carcinoma cell invasion and metastasis. Dev Cell 15, 813–828.
Rauzi M, Hocˇevar Brezavšcˇek A, Ziherl P, Leptin M (2013). Physical models of mesoderm invagination in Drosophila embryo. Biophys J 105, 3–10. Shamir ER, Pappalardo E, Jorgens DM, Coutinho K, Tsai W-T, Aziz K, Auer M,
Tran PT, Bader JS, Ewald AJ (2014). Twist1-induced dissemination pre-serves epithelial identity and requires E-cadherin. J Cell Biol 204, 839–856. Slattum GM, Rosenblatt J (2014). Tumour cell invasion: an emerging role for
basal epithelial cell extrusion. Nat Rev Cancer 14, 495–501. Tamada M, Farrell DL, Zallen JA (2012). Abl regulates planar polarized
junctional dynamics through β-catenin tyrosine phosphorylation. Dev Cell 22, 309–319.
Vesuna F, van Diest P, Chen JH, Raman V (2008). Twist is a transcriptional repressor of E-cadherin gene expression in breast cancer. Biochem Biophys Res Commun 367, 235–241.
Wang C-C, Jamal L, Janes KA (2012). Normal morphogenesis of epithelial tissues and progression of epithelial tumors. Wiley Interdiscip Rev Syst Biol Med 4, 51–78.
Wu SK, Gomez GA, Michael M, Verma S, Cox HL, Lefevre JG, Parton RG, Hamilton NA, Neufeld Z, Yap AS (2014). Cortical F-actin stabilization generates apical-lateral patterns of junctional contractility that integrate cells into epithelia. Nat Cell Biol 16, 167–178.
Wu SK, Lagendijk AK, Hogan BM, Gomez GA, Yap AS (2015). Active con-tractility at E-cadherin junctions and its implications for cell extrusion in cancer. Cell Cycle 14, 315–322.
Xie S, Martin AC (2015). Intracellular signalling and intercellular coupling coordinate heterogeneous contractile events to facilitate tissue folding. Nat Commun 6, 7161.
Yamada KM, Cukierman E (2007). Modeling tissue morphogenesis and cancer in 3D. Cell 130, 601–610.
Zallen JA, Wieschaus E (2004). Patterned gene expression directs bipolar planar polarity in Drosophila. Dev Cell 6, 343–355.
Kiger AA, Baum B, Jones S, Jones MR, Coulson A, Echeverri C, Perrimon N (2003). A functional genomic analysis of cell morphology using RNA interference. J Biol 2, 27.
Koleske AJ, Gifford AM, Scott ML, Nee M, Bronson RT, Miczek KA, Baltimore D (1998). Essential roles for the Abl and Arg tyrosine kinases in neurulation. Neuron 21, 1259–1272.
Lecuit T, Lenne P-F, Munro E (2011). Force generation, transmission, and integration during cell and tissue morphogenesis. Annu Rev Cell Dev Biol 27, 157–184.
Leptin M (1991). twist and snail as positive and negative regulators during Drosophila mesoderm development. Genes Dev 5, 1568–1576. Leptin M (1995). Drosophila gastrulation: from pattern formation to
mor-phogenesis. Annu Rev Cell Dev Biol 11, 189–212.
Leptin M, Grunewald B (1990). Cell shape changes during gastrulation in Drosophila. Development 110, 73–84.
Marinari E, Mehonic A, Curran S, Gale J, Duke T, Baum B (2012). Live-cell delamination counterbalances epithelial growth to limit tissue over-crowding. Nature 484, 542–545.
Martin AC, Gelbart M, Fernandez-Gonzalez R, Kaschube M, Wieschaus EF (2010). Integration of contractile forces during tissue invagination. J Cell Biol 188, 735–749.
Martin AC, Kaschube M, Wieschaus EF (2009). Pulsed contractions of an actin-myosin network drive apical constriction. Nature 457, 495–499.
Mason FM, Tworoger M, Martin AC (2013). Apical domain polarization local-izes actin-myosin activity to drive ratchet-like apical constriction. Nat Cell Biol 15, 926–936.
Onder TT, Gupta PB, Mani SA, Yang J, Lander ES, Weinberg RA (2008). Loss of E-cadherin promotes metastasis via multiple downstream transcrip-tional pathways. Cancer Res 68, 3645–3654.
Oudin MJ, Hughes SK, Rohani N, Moufarrej MN, Jones JG, Condeelis JS, Lauffenburger DA, Gertler FB (2016). Characterization of the expression of the pro-metastatic Mena(INV) isoform during breast tumor progres-sion. Clin Exp Metastasis 33, 249–261.