OATAO is an open access repository that collects the work of Toulouse
researchers and makes it freely available over the web where possible
Any correspondence concerning this service should be sent
to the repository administrator:
[email protected]
This is an author’s version published in:
http://oatao.univ-toulouse.fr/21978
To cite this version:
Nguyen, Tien-Cuong and Anne-Archard, Dominique and
Cameleyre, Xavier and Lombard, Eric and To, Kim Anh and
Fillaudeau, Luc Bio-catalytic hydrolysis of paper pulp using in-
and ex-situ multi-physical approaches: Focus on semidilute
conditions to progress towards concentrated suspensions.
(2019) Biomass and Bioenergy, 122. 28-36. ISSN 0961-9534
Official URL:
https://doi.org/10.1016/j.biombioe.2019.01.006
Bio-catalytic
hydrolysis of paper pulp using in- and ex-situ multi-physical
approaches:
Focus on semidilute conditions to progress towards
concentrated
suspensions
Tien
Cuong Nguyen
a,b,d,∗,
Dominique Anne-Archard
b,c,
Xavier Cameleyre
a,b,
Eric Lombard
a,b,
Kim
Anh To
d,
Luc Fillaudeau
a,ba Laboratoire d’Ingénierie des Systèmes Biologiques et des Procédés, Université de Toulouse; INSA, INRA UMR792, CNRS UMR5504, Toulouse, France b CNRS, Fédération de Recherche FERMAT, (FR 3089), Toulouse, France
cUniversité de Toulouse, Institut de Mécanique des Fluides de Toulouse, Allée Camille Soula, F-31400, Toulouse, France dSchool of Biotechnology and Food Technology, Hanoi University of Science and Technology, Hanoi, Viet Nam
A R T I C L E I N F O Keywords: Biorefinery Enzymatic hydrolysis Kinetics modelling Paper pulp Rheometry Yield stress A B S T R A C T
In order to make 2nd-generation biofuels more competitive, high solid-matter content has to be reached. To
progress towards this target, the mechanism for destructuring lignocellulosefibres in semidilute conditions has to be well understood, as this configuration shows the basic mechanism which limits transfers and efficiency. This study aims to delve deeply into the biophysical and transfer limitations occurring during enzymatic hy-drolysis. A specific experimental set-up associating in-situ and ex-situ physical (rheometry, chord length ana-lysis) and biochemical analysis was used to expand the knowledge of hydrolysis of extruded softwood paper pulp over 24 h under different substrate concentrations (1%–3%) and enzyme doses (Accellerase 1500, 5 and 25 FPU/ g cellulose). Non-Newtonian behaviour associated with pronounced yield stress stand as the major factors limiting process efficiency. A critical time was deduced from viscosity evolution, and the existence of a unique, dimensionless viscosity-time curve was established, suggesting similar mechanisms forfibre degradation. In addition, chord length distribution allowed for the description of population evolution and was discussed in the light of in-situ viscosity and hydrolysis yield. Physical (viscosity, particle size) and biochemical (substrate) ki-netics were modelled (second-order) and coefficients identified. A chronology of the encountered phenomen-ological limitations demonstrates the necessity of optimising bioprocesses by considering physical parameters. A reference feed rate is proposed in order to reach high solid loading under fed-batch strategy.
1. Introduction
The latest global agreement, the Paris agreement, was established in 2015 to reduce the scale of the fossil fuel based economy. Greater use of renewable resources with low carbon footprints is being advocated to substitute the usage of fossil fuels and to achieve the goal of a dec arbonised economy. Biofuel stands as one potential alternative, and is being scrutinised in many countries [1]. This development is not only justified by economic reasons, but also by societal demand and en vironmental constraints that necessitate the move towards renewable energies. Cellulosic biomass provides a low cost, renewable, and abundant resource that has the potential to support large scale pro duction of fuels and chemicals via biotechnological routes [2]. Among the major users of lignocellulose resources generated through forestry
and agricultural practice, the pulp and paper industry holds a strategic position. Currently, the promotion of biorefineries producing multiple products, including higher value chemicals as well as fuels and power, is a major objective of numerous consolidated programs in the world. In order to achieve economic viability, the biorefinement of lig nocellulosic resources must be operated at very high feedstock dry matter content. This strict prerequisite imposes a considerable con straint, particularly on the physicochemical and biocatalytic steps, which, overall, aim to produce high quality, fermentable sugar syrups. Moreover, industrial criteria regarding maximum reactor volumes, en ergy and water consumption, and wastewater management must also be respected. The pulp and paper industry is able to provide a tried and tested industrial model for processing lignocellulose biomass into pre treated cellulose pulps. The pulp product of this industry is appropriate
∗Corresponding author. School of Biotechnology and Food Technology, Hanoi University of Science and Technology, 1 Dai Co Viet Road, Hanoi, 100000, Viet Nam.
E-mail address:[email protected](T.C. Nguyen).
0.5 N H2SO4. The viscometer and the cryostat were controlled by Haa
keRheoWin Job Manager software (Thermo Fisher Scientific) which also ensured data recording (temperature, torque, mixing rate). A fo cused beam reflectance sensor (FBRM G400 Mettler Toledo, range of 0.1 1000μm) was located in the reactor in order to measure the dis tribution of particle chords.
2.2. Substrates and enzyme
Paper pulp from coniferous wood (Softwood, obtained via the Kraft process, with pulp extracted before bleaching, Tembec Co., Saint Gaudens, France, type FPP27) after extrusion (Extruder Eurolab 16, 400 mm failure, extrusion line: 25 L/D 18/25 conveying, 7/25 shear stress) was selected for study. The humidity of this substrate was 72%. Per unit dry weight it contained 82% cellulose, 8% hemicellulose, 2% lignin, the remainder being ashes (3%) and extractive fractions (2 4%) whose composition has not been determined. The substrate density is 1034 ± 9 (kg m−3) and the mean volume dimeter of particles is 497 ± 77 (μm). This pulp is favourable for enzymatic hydrolysis be cause of its low lignin content (2%). It also contains a low proportion of hemicellulose (xylan, mannan, etc.).
An enzyme cocktail (Accellerase® 1500 Genencor, USA, ref. 3015155108) containing exoglucanases, endoglucanases (2200 2800 CMC U/g), hemicellulases andβ glucosidases (525 775 pNPG U/g) was used. Its optimal temperature and pH were 50 °C (range 50 65 °C) and 4.8 (range 4 5), respectively. An Accellerase® 1500 dosage rate of 0.1 0.5 mL per gram of cellulose or roughly 0.05 0.25 mL per gram of biomass (depending on the biomass composition) was recommended by the suppliers. Inactivation may occur at temperatures higher than 70 °C and for pH < 4 or pH > 7. Enzyme activities were characterised in the range of 50 60 FPU/mL as reported [11,12].
2.3. Physical analysis
Lignocellulose suspensions demonstrate complex rheological beha viour, and there is no standard method for studying their flow beha viour. To characterise their rheological properties asfinely as possible, two measurement strategies were combined: (i) ex situ rheometry (os cillation mode), which provided yield stress and elasticity information, and (ii) in situ viscometry, which followed suspension viscosity in real time during enzyme attack. Particle size was analysed by in situ chord length measurement (FBRM).
2.3.1. Ex situ rheometry
Classic rheometry based on continuous permanent shear rate ap pears irrelevant for lignocellulosic substrates because of the rapid ag gregation of fibres [10]. Thus, oscillatory measurements (including
strain sweeps and frequency sweeps) were performed. These measure ments offer several advantages: firstly, they prevent fibre aggregation caused by constant unidirectional shearflow; secondly, they provide additional information on the rheological behaviour of the suspensions (yield stress in this case). The storage modulus G′ and the loss modulus G’’ were measured using a Mars III rheometer (Thermo Scientific). Dynamic measurements were performed with serrated plates (60 mm, roughness 400μm, gap size: 1.5 mm) on samples taken during hydro lysis. First, an oscillatory shearflow was set up with increasing shear stress amplitude from 0.1 to 20 Pa and at afixed frequency (1 Hz). This first measurement was used to determine the linear domain. Then a scan was carried out in the linear domain for frequencies from 0.5 Hz to 20 Hz andfixed shear stress amplitude. The analysis was performed at 20 °C. Several methods can be used for yield stress determination. It can be interpreted as the stress amplitude at which the elastic modulus G′ becomes smaller than the shear modulus G″, or as the stress amplitude at which the loss modulus G” reaches a maximum. It can also be identified as the maximum elastic stress verifying a linear relation
= ′
τ G γ. whereγ is the strain amplitude [13,14]. Especially for lig nocellulose substrates, which cannot stand long measurement times, it was defined as the first departure from the linear viscoelastic region [9,15]. In the present study, a 20% reduction in G’ was chosen.
2.3.2. In situ rheometry
Ex situ measurement was limited by the number of samples and the substrate properties, predominately decantation and flocculation of material. To overcome these difficulties, in situ viscometry was con ducted throughout hydrolysis. It was based on the determination of power consumption (or power number = = ⋅ ⋅
⋅ ⋅
Np P ;P 2π N C
d5 ρ N3 )
versus the Reynolds number (Re= ρ N d⋅ ⋅
μ
2
) during suspension mixing (see Ref. [16] for details). The viscosity was calculated from the power consumption curve of the mixing system under consideration using a semi empirical model including laminar and transition regions for the reference curve with a one to one relationship between Np and Re:
= ⎛ ⎝ ⎛ ⎝ ⎞ ⎠ + ⎞ ⎠ = = Np Kp N with N q Re : 0.128; 0.782 q pq q p 0 1 0 (1) The Kp constant for the mixing system was 97.9, while the Metzner Otto constant used to estimate an equivalent shear rate was Ks = 32. All the geometric constants were determined from measurements using Newtonian (water, Marcol oil, and glycerol) and non Newtonianfluids (xanthan sucrose solutions). Once the experimental set up was char acterised by its power consumption curve Np(Re) and its Ks value, in situ viscometry of the suspension was performed before the addition of enzymes and then throughout the biocatalytic reaction.
= − − ⋅ = − W m m m m DM W (%) ini fin 100; (%) 100 ini epp (2)
2.4.2. Monomers and oligomers
Samples were centrifuged at 13000 rpm for 5 min. Glucose and so luble cello oligosaccharides, (i.e. with a degree of polymerisation lower than 6) in the supernatants were quantified by an AMINEX HPX 87P carbohydrate analysis column (Bio Rad Laboratories, Richmond, CA) using a high performance liquid chromatography system (separations module: Waters Alliance 2690; refractometer detector: Waters 2414, Milford, MA). Conditions were optimised to detect and quantify the different cello saccharides. Analysis was performed at 60 °C with deionised water and 0.1 M Pb(NO2)2as mobile phase (ratio 80/20 v/v)
at a flow rate of 0.5 mL/min for 30 min. Glucose and cello oligo saccharide standards with a DP ranging from 2 to 5 were used (Sigma Chemical Co., St. Louis, MO).
2.5. Experimental strategy
Enzyme hydrolysis was carried out at 40 °C due to enzyme heat stability (activity reduction at high temperature), energy conservation, and taking into account the optimal conditions for the cell cultivation step. The pH of the medium was adjusted to 4.8. To prevent microbial
= = ⋅ ⋅ + ⋅
(
)
(
)
Bioconversion Glc m V (%) [ ] / Glc Glc theory s DM Cellu w mρ [ ] [ ] 100 100 0.9 measured theory s s (3)The theoretical conversion coefficient from cellulose to glucose is 1/ 0.9.
Under enzyme activity, the polymeric cellulose chain is broken down to produce monomers. Oligomers (DP > 2) were not detected for any of the experiments. Xylose was quantifiable only in the case of 3% w/v 0.5 mL enzyme/g cellulose.
As expected, the concentration of monomers (glucose, xylose) in creases with hydrolysis time. For example, in the 3% w/v cases, the monomer concentration increased regularly during hydrolysis, so that enzyme loading had an impact on the quantity of the glucose released: 5.1 19.1 g L−1, which corresponds to 19 and 73% bioconversion for 0.1 and 0.5 mL/g cellulose respectively (Table 1). Few articles have ex amined the evolution of water soluble cello oligosaccharides. Sun and Cheng [17] analysed the hydrolysis of microcrystalline cellulose (10 g L−1) by cellulase produced by Cellulomonas fimi. They did not detect soluble oligomers with DP≥ 4, but the cellotriose concentration varied between 0.2 and 0.6 g L−1 depending on the enzyme use d endo glucanase or cellobiohydrolase. Solubilisation reached 61% and 50% respectively for each enzyme separately. In contrast, the in termediates of cellulose hydrolysis were not found because the Ac cellerase 1500 cocktail contains all the types of activity required to rapidly degrade these intermediates during hydrolysis.
The bioconversion yields are comparable to data reported in the literature. For a 2% (w/w) suspension of oven dried corncob, after 24 h hydrolysis the glucose conversion varied between 30 and 82% for 6 and 30 FPU/g [18]. With the hydrolysis of a pre treated wheat straw
Table 1
Bioconversion rate (%) during enzyme hydrolysis.
Substrate concentration (%gdm.L 1) Enzyme/Substrate (mL/g cellulose) 0 h 0.25 h 2 h 5 h 10 h 24 h Mass balance (24 h,%)
1 0.1 0 1.0 4.7 9.6 11.6 13.2 93.7
1 0.5 0 6.0 19.6 31.1 52.4 76.6 94.1
3 0.1 0 1.3 6.4 11.3 14.5 19.1 94.6
3 0.5 0 6.0 20.6 32.7 54.1 73.5 95.2
2.3.3. In situ particle size analysis
Focus beam reflectance measurement (FBRM) enabled in situ quantification and characterisation of chord length distribution (CLD). The FBRM sensor (FBRM G400, Mettler Toledo, range: 0.1 1000 μm) was set up in the bioreactor to detect and monitor the changes of particle dimensions during enzymatic hydrolysis in real time. FBRM measurement is a laser based technique. A solid state laser light source (λ = 795 nm) provides a continuous beam of monochromatic light that is sent down the FBRM probe. A precision motor pneumatic or elec tric is used to rotate the precision optics at a constant speed. The scan speed is fixed at 2 m s−1. As the scanning focused beam sweeps across
the face of the probe window, individual particles or particle structures (agglomerated or floc) backscatter the laser light towards the probe. Particles and droplets closest to the probe window are located in the scanning focused spot and backscatter distinct pulses of reflected light, which are detected by the probe and translated into chord lengths based on the simple calculation of the scan speed (velocity) multiplied by the pulse width (time). A chord length is simply defined as the straight line distance from one edge of a particle or particle structure to another edge. Typically, thousands of individual chord lengths are measured each second to produce the chord length distribution, which is the fundamental measurement provided by FBRM.
2.4. Biochemical analysis 2.4.1. Dry matter content
The water content of substrates and hydrolysed suspensions was determined by drying at low temperature and pressure. Volumes of samples (≈1 mL) were put in Eppendorf tubes (known mass, mepp).
These Eppendorfs (mini) were then placed in an oven at 60 °C, 200 mbar
for 5 days, and afterwards, weighed (mfin). Water content (W) and dry
matter content (DM) were calculated using Eq. (2) (accuracy ± 0.5%):
contamination, 0.2 mL of a solution of chloramphenicol (5 g L−1) was
added. Enzymes were added when the suspension reached homogeneity (visual monitoring and stabilised torque, reached within 30 min). Hydrolysis was carried out over 24 h with a mixing rate of 100 rpm (corresponding approximately to a shear rate of 50 s−1), reactor vo
lume 1300 mL and using three substrate concentrations, 1% (10.1 and 9.7 gdm/L formally), 2% (only for in situ viscometry analysis, 19.6 and 20.0 gdm/L formally) and 3% w/v (29.2 and 28.7 gdm/L formally), two enzyme/substrate ratios, 0.1 and 0.5 mL enzyme/g cellulose respec tively (corresponding to 5 and 25 FPU/g cellulose). Suspensions were sampled with a 7 mm diameter flexible tube connected to a 50 mL syringe. Each sample was about 15 mL at 0 h, 15min, 1 h, 2 h, 3 h, 5 h, 7 h, 10 h and 24 h of hydrolysis time. The enzyme reaction was stopped by adding 0.1 mL 10 N NaOH. The total volume of samples removed was approximately 130 mL (< 10% of initial volume). Samples were analysed in terms of rheological, granulo metric and biochemical properties during enzyme degradation.
3. Results and discussions 3.1. Bioconversion rate
The production of monomers (C6, C5) and water soluble oligo saccharides is crucial for the development of new intensified biopro cesses. First of all, the bioconversion rate was calculated from the glucose produced using Eq. (3).
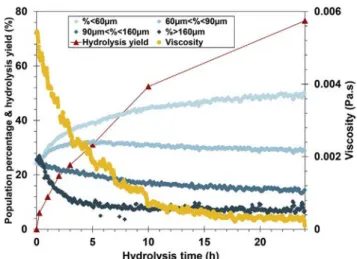
divided into severalfine particles. Beyond that, enzyme activity occurs and thefinest particles are converted into dissolved compounds, gen erating a reduction in chord number. As demonstrated inFig. 6, the fragmentation mechanisms appear to be the dominant effect in the strong viscosity reduction observed during thefirst 5 h, while solubili sation increased to 31%. In contrast, after 5 h, fragmentation is negli gible (class IV almost constant) while solubilisation increased to 76% (at 24 h). Correlatively, the viscosity evolution was limited and the finest populations still increased from 38% to 50%.
3.4. Modelling kinetics at macro , micro , and biochemical scales Hydrolysis induces a reduction in particle size, dry matter content, and viscosity, which promotes mixing andfibre accessibility. The ki netics of viscosity (macro), chord length (micro) and substrate and product concentrations (biochemical) stand as key indicators for un derstanding and controlling bioprocess performance. The kinetics of biochemical enzymatic reactions have been extensively reported in the literature [31], contrary to physical parameters such as viscosity and granulometry. A lot of enzyme reactions (e.g. hydrolysis, oxidation, and reduction or cofactor mechanisms) are second or higher order re versible reactions. Many are limited by diffusion and physical accessi bility. Adsorption (reaction) in high molecular weight structures (for example, proteins, polynucleotides, polysaccharides, or heterogeneous protein phospholipid, protein nucleotide, and protein polysaccharide structures) is more complex. Among the numerous models reported in the literature, one of the best known is the Michealis Menten equation [32] but afirst order model was also reported by Chrastil [33].
The time evolution of viscosityμ, mean chord length lcm, and re
sidual substrate concentration in dry matter S (%) are modelled by the general equation Eq.(6):
−dX = ⋅ dt k X
α
(6) where X is the variable being modelled (μ, lcmand S); k is the kinetic
constant, andα the model/reaction order (/). As boundary conditions, X varies from X0to X∞, corresponding to initial andfinal values re
spectively.
A second order model accurately describes the time dependence of the physico chemical parameters viscosity, chord length, and dry matter content. For the lowest enzyme ratio, an increase of the mean chord length was observed during thefirst hours. In these cases, the proposed model was restricted to the time interval corresponding to the maximal value of lcmuntil the end of hydrolysis (experiments with
0.1 mL enzyme/g cellulose). This lcmincrease step could be explained
byfibre swelling and unwinding due to limited enzyme activity. To sum up, the most suitable kinetic models are second order and written as Eqs.(7) to (9): = − − + + ∞ ∞ ∞ μ μ μ μ μ k t μ ( ). μ. 1 0 0 (7) = − − + + ∞ ∞ ∞ lc lc lc lc lc k t lc ( ). . 1 m m m m m lc m 0 0 (8)
Fig. 5. Uniqueness of dimensionless viscosity-time curves (1%-0.5 signifies 1% dm and 0.5 mL enzyme/g cellulose).
Fig. 6. Overview of in-situ (FBRM) particle size analysis: A: Chord number and B: Mean chord.
Fig. 7. Population balance (classes defined from initial chord length distribu-tion), in-situ viscosity, and hydrolysis yield during hydrolysis (1%-0.5 mL en-zyme/g cellulose case).
= − − + + ∞ ∞ ∞ S S S S S k t S ( ). S. 1 0 0 (9)
The model was adjusted via the least squares method for each of the physico biochemical parameters. The coefficients and the correlation coefficients are presented in Table 2. The correlation coefficients in dicated thefine agreement between the models and experimental data. The enzyme cocktail (Accellerase 1500) contained only cellulases and hemicellulases, so the lignin fraction can be considered as contributing to the non hydrolysable fractionS∞. For our substrate, lignin represents
less than 2%, and thus can be neglected. Thefinal viscosity μ∞corre
sponds to the viscosity of a suspension containing all soluble fractions (total conversion). In the present case, this value would be close to the supernatant viscosity (0.7 mPa s) andμ∞is negligible compared to the
initial suspension viscosity. In ideal conditions, the solid fractions should be converted into soluble fractions and the ultimate chord length lcm∞would then be null. However, experimentally, there is al
ways some part that remains non hydrolysable substrate, so lcm∞
cannot be neglected compared to lcm0, and is assumed equal to lcm24h.
Effects of enzyme and substrate concentrations are clearly observed for all constants. With kS, the increase of the E/S ratio from 0.1 to
0.5 mL/g cellulose led to a 7 to 9 fold increase. When the initial sub strate concentration increased from 1 to 3% w/v, a reduction of 2 3 times was observed. The same tendency was found with kμ, which de
monstrated the strong impact of enzyme and substrate concentrations on the variation of suspension viscosity during hydrolysis. Similar im pacts were observed for enzyme concentration and substrate con centration: 8 fold and 4 fold respectively. Thefinal value of the mean chord length, lcm∞, seemed identical in magnitude; however, the im
pact of enzyme ratio can be clearly distinguished by the absolute values of klc. An increase of 3.5 5.5 fold of klcwas observed when the enzyme
concentration passed from 0.1 to 0.5 mL/g cellulose.
Using equations(7) (9),Fig. 8 illustrates the successive phenom enological limitations observed during hydrolysis. Rheological beha viour appears to be the primary limiting factor. Transfer limitation due to high viscosity and yield stress is, however, temporary (during the first 5 h) but constitutes an important phenomenon. Viscosity collapse and particle fragmentation are concomitant. Beyond this, the limited reduction in size indicates a threshold for biocatalytic reaction. This could be due to recalcitrant fractions or inefficient enzyme activities. It is therefore necessary to study the physical and biochemical structures of this recalcitrant fraction in order to identify how it could be de graded.
The major challenge in 2ndgeneration biofuels is to reduce costs so as to compete with 1stgeneration ones. Therefore, processing at high
solid content is mandatory. However, the rheological behaviour of the hydrolysis suspension stands out as thefirst and major determinant of process efficiency, and has to be considered a key criterion in proposing a rational strategy for reaching high dry matter content.
To increase transfers and bioreaction efficiency, a strategy can be built from the identified parameters in a semidilute regime: the critical substrate concentration C* (meaning a drastic increase of initial
suspension viscosity beyond C*) and a targeted hydrolysis time, t (μ* = x0) (corresponding to a chosen relative reduction of initial
viscosity), can be used to define a reference feed rate Qc (Eq.(10)): = = ∗ ∗ − Q C V t μ x g h . ( ) ( . ) c 0 1 (10) A cumulative feeding strategy can be defined, based on Qc, which would allow working in a favourable regime so as to reach high hy drolysis yield by avoiding instantaneous high substrate concentrations. 4. Conclusion
This study aimed to delve deeply into the biophysical and transfer limitations occurring during enzymatic hydrolysis in the cellulosic biofuels context. Considering paper pulp substrates, semidilute condi tions were chosen, as they introduce the complexity of particle particle interactions, which are strongly involved in transfer limitations, without inhibiting the bioreaction. Biochemical and physical phe nomena were explored through a specific experimental set up asso ciating in situ and ex situ analyses.
Non Newtonian behaviour associated with non negligible yield stress stand as the major factors limiting process efficiency and progress towards high solid loading. The uniqueness of dimensionless time viscosity curves was observed whatever the operating conditions, and suggests a similar mechanism forfibre degradation. The evolution of biophysical parameters during hydrolysis was observed as the results of a combination offibre fragmentation, which dominated during the first step, and solid solubilisation. Kinetics modelling enabled demonstration of the successive phenomenological limitations and their magnitude. All these elements lead to the proposal of a reference feed rate which would be used in a cumulative feeding strategy for reaching high solid loading and balancing energy consumption and process efficiency.
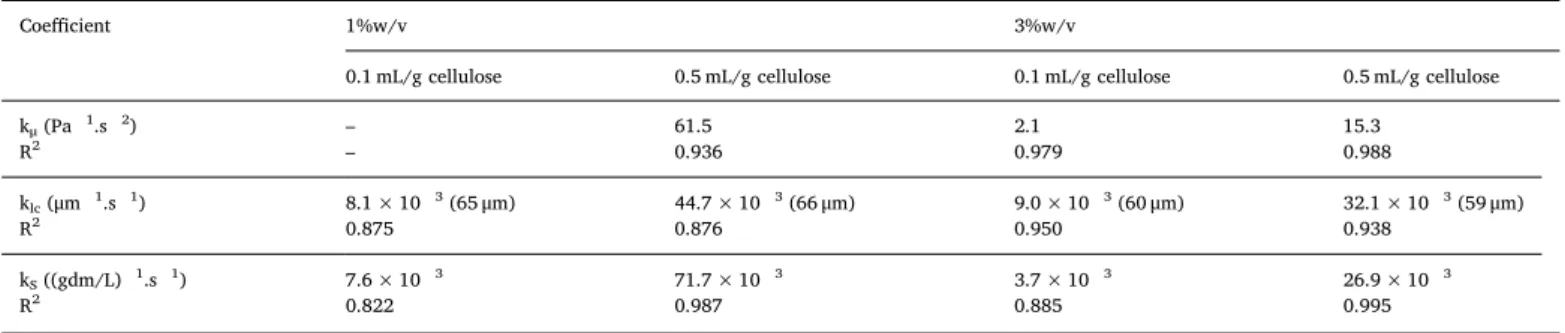
Table 2
Kinetic coefficients of rheological, granulometric (lcm∞inμm) and biochemical parameters, and associated correlation coefficients R2.
Coefficient 1%w/v 3%w/v
0.1 mL/g cellulose 0.5 mL/g cellulose 0.1 mL/g cellulose 0.5 mL/g cellulose
kμ(Pa 1.s 2) – 61.5 2.1 15.3 R2 – 0.936 0.979 0.988 klc(μm 1.s 1) 8.1 × 10 3(65μm) 44.7 × 10 3(66μm) 9.0 × 10 3(60μm) 32.1 × 10 3(59μm) R2 0.875 0.876 0.950 0.938 kS((gdm/L) 1.s 1) 7.6 × 10 3 71.7 × 10 3 3.7 × 10 3 26.9 × 10 3 R2 0.822 0.987 0.885 0.995
Fig. 8. Reduction of physico-biochemical parameters during hydrolysis using kinetic models (for 3% w/v, 0.5 mL enzyme/g cellulose).
[1] K.-H. Chang, K.-R. Lou, C.-H. Ko, Potential of bioenergy production from biomass wastes of rice paddies and forest sectors in Taiwan, J. Clean. Prod. 206 (2019) 460–476.
[2] W.R. Gibbons, S.R. Hughes, Integrated biorefineries with engineered microbes and high-value co-products for profitable biofuels production, Vitro Cell Dev. Biol. Plant 45 (3) (2009) 218–228.
[3] P. Vallette, C. De Choudens, Le bois, la pêtes, le papier, Centre Technique de l'Industrie des Papiers, Cartons et Celluloses, 2-906579-00-9, 1987 199 pages. [4] M. Moshkelani, M. Marinova, M. Perrier, J. Paris, The forest biorefinery and its
implementation in the pulp and paper industry: energy overview, Appl. Therm. Eng. 50 (2) (2013) 1427–1436.
[5] Z.L. Fan, C. South, K. Lyford, J. Munsie, P. van Walsum, L.R. Lynd, Conversion of paper sludge to ethanol in a semicontinuous solids-fed reactor, Bioproc. Biosyst. Eng. 26 (2) (2003) 93–101.
[6] A. Herrera, S.J. Téllez-Luis, J.A. Ramı́rez, M. Vázquez, Production of xylose from sorghum straw using hydrochloric acid, J. Cereal. Sci. 37 (3) (2003) 267–274. [7] X. Zhao, K. Cheng, D. Liu, Organosolv pretreatment of lignocellulosic biomass for
enzymatic hydrolysis, Appl. Microbiol. Biotechnol. 82 (5) (2009) 815–827. [8] T. Eggeman, R.T. Elander, Process and economic analysis of pretreatment
tech-nologies, Bioresour. Technol. 96 (18) (2005) 2019–2025.
[9] M. Wiman, B. Palmqvist, E. Tornberg, G. Liden, Rheological characterization of dilute acid pretreated softwood, Biotechnol. Bioeng. 108 (2011) 1031–1041. [10] T.C. Nguyen, D. Anne-Archard, L. Fillaudeau, Rheology of lignocellulose
suspen-sions and impact of hydrolysis: a review, in: R. Krull, T. Bley (Eds.), Filaments in Bioprocesses, Springer International Publishing, 2015, pp. 325–357.
[11] P. Alvira, M.J. Negro, M. Ballesteros, Effect of endoxylanase and alpha-L-arabino-furanosidase supplementation on the enzymatic hydrolysis of steam exploded wheat straw, Bioresour. Technol. 102 (6) (2011) 4552–4558.
[12] S.P. Govumoni, S. Koti, S.Y. Kothagouni, V. S, V.R. Linga, Evaluation of pretreat-ment methods for enzymatic saccharification of wheat straw for bioethanol pro-duction, Carbohydr. Polym. 91 (2) (2013) 646–650.
[13] R. Damani, R.L. Powell, N. Hagen, Viscoelastic characterization of medium con-sistency pulp suspensions, Can. J. Chem. Eng. 71 (5) (1993) 676–684. [14] H.J. Walls, S.B. Caines, A.M. Sanchez, S.A. Khan, Yield stress and wall slip
phe-nomena in colloidal silica gels, J. Rheol. 47 (4) (2003) 847–868 1978-present. [15] J.J. Stickel, J.S. Knutsen, M.W. Liberatore, W. Luu, D.W. Bousfield,
D.J. Klingenberg, C.T. Scott, T.W. Root, M.R. Ehrhardt, T.O. Monz, Rheology
measurements of a biomass slurry: an inter-laboratory study, Rheol. Acta 48 (9) (2009) 1005–1015.
[16] T.C. Nguyen, D. Anne-Archard, V. Coma, X. Cameleyre, E. Lombard, C. Binet, A. Nouhen, K.A. To, L. Fillaudeau, In situ rheometry of concentrated cellulosefibre suspensions and relationships with enzymatic hydrolysis, Bioresour. Technol. 133 (2013) 563–572.
[17] Y. Sun, J. Cheng, Hydrolysis of lignocellulosic materials for ethanol production: a review, Bioresour. Technol. 83 (1) (2002) 1–11.
[18] F. Carvalheiro, L.C. Duarte, F.M. Gírio, Hemicellulose biorefineries: a review on biomass pretreatments, J. Sci. Ind. Res. 67 (2008) 849–864.
[19] G. Pierre, Z. Maache-Rezzoug, F. Sannier, S.A. Rezzoug, T. Maugard, High-perfor-mance hydrolysis of wheat straw using cellulase and thermomechanical pretreat-ment, Process Biochem. 46 (11) (2011) 2194–2200.
[20] W.E. Kaar, M.T. Holtzapple, Benefits from Tween during enzymic hydrolysis of corn stover, Biotechnol. Bioeng. 59 (4) (1998) 419–427.
[21] C. Roche, C. Dibble, J. Knutsen, J. Stickel, M. Liberatore, Particle concentration and yield stress of biomass slurries during enzymatic hydrolysis at high-solids loadings, Biotechnol. Bioeng. 104 (2009) 290–300.
[22] L. Rosgaard, P. Andric, K. Dam-Johansen, S. Pedersen, A.S. Meyer, Effects of sub-strate loading on enzymatic hydrolysis and viscosity of pretreated barley straw, Appl. Biochem. Biotechnol. 143 (1) (2007) 27–40.
[23] M. Vázquez, M. Oliva, S.J. Téllez-Luis, J.A. Ramírez, Hydrolysis of sorghum straw using phosphoric acid: evaluation of furfural production, Bioresour. Technol. 98 (16) (2007) 3053–3060.
[24] M. Chang, T.C. Chou, G. Tsao, Structure, Pretreatment and Hydrolysis of Cellulose, Springer Berlin Heidelberg, Bioenergy, 1981, pp. 15–42.
[25] R. Dasari, K. Dunaway, R. Berson, A scraped surface bioreactor for enzymatic saccharification of pretreated corn stover slurries, Energy Fuel. 23 (2009) 492–497. [26] C.C. Geddes, J.J. Peterson, M.T. Mullinnix, S.A. Svoronos, K.T. Shanmugam,
L.O. Ingram, Optimizing cellulase usage for improved mixing and rheological properties of acid-pretreated sugarcane bagasse, Bioresour. Technol. 101 (23) (2010) 9128–9136.
[27] L.T.C. Pereira, L.T.C. Pereira, R.S.S. Teixeira, E.P.D. Bon, S.P. Freitas, Sugarcane bagasse enzymatic hydrolysis: rheological data as criteria for impeller selection, J. Ind. Microbiol. Biotechnol. 38 (8) (2011) 901–907.
[28] B.-H. Um, Optimization of Ethanol Production from Concentrated Substrate, Auburn University, 2007, p. 268.
[29] J. Du, F.Z. Zhang, Y.Y. Li, H.M. Zhang, J.R. Liang, H.B. Zheng, H. Huang, Enzymatic liquefaction and saccharification of pretreated corn stover at high-solids con-centrations in a horizontal rotating bioreactor, Bioproc. Biosyst. Eng. 37 (2) (2014) 173–181.
[30] N.V. Pimenova, A.R. Hanley, Effect of corn stover concentration on rheological characteristics, Appl. Biochem. Biotechnol. 113 (2004) 347–360.
[31] B. Frémaux, Eléments de cinétique et de catalyse, Lavoisier, Paris, 1989. [32] L. Michaelis, M.L. Menten, Die Kinetik der Invertinwirkung, Biochem 49 (1913)
333–369.
[33] J. Chrastil, Enzymatic product formation curves with the normal or diffusion lim-ited reaction mechanism and in the presence of substrate receptors, Int. J. Biochem. 20 (7) (1988) 683–693.
Acknowledgements
This work was realised within the ProBio3 project ANR 11 BTBR 0003, selected in the Investissements d’Avenir Programme, with fi nancial support from the French government, managed by the National Research Agency. The authors are grateful to the “Programme de Bourses d’Excellence 2011” of the French Embassy in Vietnam. References