Chronic consumption of a Western diet modifies the DNA
methylation profile in the frontal cortex of mice
Amy S. Yokoyamaa, Keith Dunawayb, Jennifer Rutkowskyc, John C. Rutledgea, and Dragan
Milenkovica,d
aDepartment of Internal Medicine, Division of Cardiovascular Medicine, School of Medicine,
University of California Davis, Davis, California, 95616, United States of America
bDepartment of Medical Microbiology and Immunology, School of Medicine, University of
California Davis, Davis, California, 95616, United States of America
cDepartment of Molecular Biosciences, School of Veterinary Medicine, University of California
Davis, Davis California, 95616, United States of America
dUniversité Clermont Auvergne, INRA, UNH, CRNH Auvergne, F-63000 Clermont-Ferrand,
France
Abstract
In our previous work in mice, we have shown that chronic consumption of a Western diet (WD; 42% kcal fat, 0.2% total cholesterol and 34% sucrose) is correlated with impaired cognitive function. Cognitive decline has also been associated with alterations in DNA methylation.
Additionally, although there have been many studies analyzing the effect of maternal consumption of a WD on DNA methylation in the offspring, few studies have analyzed how an individual’s consumption of a WD can impact his/her DNA methylation. Since the frontal cortex is involved in the regulation of cognitive function and is often affected in cases of cognitive decline, this study aimed to examine how chronic consumption of a WD affects DNA methylation in the frontal cortex of mice. Eight-week-old male mice were fed either a control diet (CD) or a WD for 12 weeks, after which time alterations in DNA methylation were analyzed. Assessment of global DNA methylation in the frontal cortex using dot blot analysis revealed that there was a decrease in global DNA methylation in the WD-fed mice compared with the CD-fed mice. Bioinformatic analysis identified several networks and pathways containing genes displaying differential methylation, particularly those involved in metabolism, cell adhesion and cytoskeleton integrity, inflammation and neurological function. In conclusion, the results from this study suggest that consumption of a WD alters DNA methylation in the frontal cortex of mice and could provide one of the mechanisms by which consumption of a WD impairs cognitive function.
HHS Public Access
Author manuscript
Food Funct
. Author manuscript; available in PMC 2019 February 21.Published in final edited form as:
Food Funct. 2018 February 21; 9(2): 1187–1198. doi:10.1039/c7fo01602f.
A
uthor Man
uscr
ipt
A
uthor Man
uscr
ipt
A
uthor Man
uscr
ipt
A
uthor Man
uscr
ipt
1. Introduction
Dementia is a progressive neurodegenerative disorder characterized by gradual cognitive decline to the point of interference with independent living. Due to advances in medicine and healthcare, average life expectancy is increasing. As the population ages, the prevalence of age-related disorders, such as dementia, also increases1, 2. In 2010, dementia affected approximately 35.6 million individuals worldwide3. This number is expected to double every 20 years, such that 65.7 million individuals will be affected in 2030 and 115.4 million individuals will be affected in 20503. In terms of the economic burden of dementia in the United States, the annual cost per case was between $41,000 and $56,000 in 2010, which amounted to a total cost of between $159 billion and $215 billion4. That same year, the total estimated worldwide cost of dementia was approximately $604 billion US dollars5. Despite its substantial societal and economic burden, the etiology of dementia remains unknown. There are several well-characterized risk factors for dementia, including non-modifiable risk factors such as age, family history and the presence of genetically susceptible alleles6–10. However, the impact of modifiable risk factors such as obesity, hypertension, diabetes and hyperlipidemia on dementia is less clear7, 11–13. With the alarming rise in the prevalence of obesity in the industrialized world, an understanding of these modifiable risk factors for dementia has become more pressing14. One contributing factor to the obesity epidemic is increased consumption of a Western diet (WD), due in part to the advent of Industrial-era foods as well as the increased availability and popularity of fast food15. In vivo rodent feeding studies demonstrate that consumption of a WD, defined here as a diet with high fat, moderately high sucrose and added cholesterol, is linked to insulin resistance and
hyperlipidemia16–19. Several controlled epidemiological studies have shown that
consumption of a WD is correlated with cognitive impairment20–24. Additionally, we and others have found this association in vivo using rodent models (J. Rutkowsky, unpublished work)20, 24–28. Importantly, the frontal cortex is a region that is significantly impacted by dementia; studies analyzing frontal cortex biopsies of patients with Alzheimer’s disease suggest that synaptic loss within the frontal cortex is associated with cognitive decline29–32. Because the frontal cortex functions in cognition and works in close association with other brain regions to modulate learning and memory33, 34, this region is often examined in studies that focus on dementia and cognitive decline. However, the mechanisms by which
consumption of a WD might contribute to cognitive impairment are still unclear.
As interest in genomics research increases, studies on genetic mechanisms of disease have gained popularity. It has recently been shown that epigenetic alterations, such as DNA methylation, are often associated with various disease pathologies35–38. DNA methylation is the process by which a methyl group is transferred to a cytosine base by DNA
methyltransferase enzymes (DNMTs) to form 5-methylcytosine (5mC)39. DNA methylation preferentially occurs at cytosines followed by guanines (CpGs), and DNA methylation within regions of high CpG content is often associated with decreased gene expression40. DNA methylation is thought to inhibit gene expression in one of two ways: 1) methyl groups recruit methyl CpG binding domain proteins, which in turn recruit transcriptional co-repressors, chromatin remodeling proteins and histone deacetylases that act together to inhibit gene expression41–44; and 2) 5mC directly interferes with the binding of transcription
A
uthor Man
uscr
ipt
A
uthor Man
uscr
ipt
A
uthor Man
uscr
ipt
A
uthor Man
uscr
ipt
factors necessary for gene transcription44. Importantly, multiple studies have demonstrated that both dementia and consumption of a high-fat diet (HFD), a primary component of a WD, are associated with alterations in DNA methylation within the brain45–51. For instance, one study reported a global decrease in the methylation level of DNA in hippocampal region of AD patients compared to non-demented, age-matched controls46. Similarly, another study found a decrease in the methylation near the transcription start site of the Mc4r gene in response to a HFD51. However, most of these papers are focused primarily on maternal or paternal consumption of a HFD and the subsequent effects on methylation status in the offspring50, 52, 53. Relatively few papers have examined the effect of chronic HFD consumption on DNA methylation across time within the same individual54–56, to say nothing of the lack of data concerning the effect of chronic WD consumption on DNA methylation. The primary aim of this study was to determine whether DNA methylation is altered in the frontal cortex of mice following chronic consumption of a WD (42% kcal fat, 0.2% total cholesterol and 34% sucrose by weight).
2. Methods
2.1 Animals and diet
Male C57Bl/6J mice were purchased at six-and-a-half weeks of age from JAX West Laboratory (Sacramento, CA, USA). Upon arrival at the University of California, Davis, where the experiments were conducted, mice were housed two-per-cage in cages fitted with a transparent divider that had small holes to allow for visual and olfactory interaction and were temporarily maintained ad libitum on a Teklad Global 18% Protein Rodent Diet (Envigo, Indianapolis, IN, USA) prior to administration of the specialized diet. Mice were kept in a temperature-controlled room with a 12 h light: 12 h dark cycle. At eight weeks of age, mice were given semi-synthetic diets, either a Western diet (WD; 42% kcal fat, 0.2% total cholesterol and 34% sucrose by weight (Envigo, IN, USA) or a low-fat, low-sucrose control diet (CD; 19.2% kcal fat, 0% added total cholesterol and 12% sucrose by weight) (Envigo, IN, USA) ad libitum for 12 weeks. A detailed composition of the diets can be found in Supplemental Table 1. Mice were sacrificed at 20 weeks of age by exsanguination under isoflurane anesthesia, and the brain was removed and immediately frozen in liquid nitrogen. Frontal cortex was grossly dissected from the ~2mm section of frozen brain caudal to the olfactory bulb and pulverized over dry ice. All procedures were approved by the Institutional Animal Care and Use Committee at the University of California, Davis, follow institutional guidelines, and are in compliance with national and state laws or guidelines. The IACUC protocol number was 17818
2.2 Analysis of global DNA methylation by dot blot analysis
Genomic DNA was isolated from the frontal cortex using a DNeasy Blood and Tissue Kit (Qiagen). The concentration and purity of the DNA was determined by measuring
absorbance at 230 nm, 260 nm and 280 nm. Global DNA methylation was analyzed by dot blot analysis as previously described57. Briefly, 50 ng of genomic DNA was denatured, loaded in triplicate onto a nitrocellulose membrane and crosslinked to the membrane using ultraviolet radiation. The membrane was blocked in Odyssey Blocking Buffer (LI-COR Biosciences) and then incubated at 4°C with anti-5-methylcytidine primary antibody
A
uthor Man
uscr
ipt
A
uthor Man
uscr
ipt
A
uthor Man
uscr
ipt
A
uthor Man
uscr
ipt
(Eurogentec) in Odyssey Blocking Buffer containing 0.1% Tween-20 overnight. The membrane was subsequently washed in 1× PBS containing 0.1% Tween-20 and incubated at room temperature with 680-IR secondary antibody (LI-COR Biosciences) for 1 h. The blot was imaged using the infrared Odyssey Imager (LI-COR Biosciences) and washed in 2× saline-sodium citrate buffer followed by equilibration in PerfectHyb Plus Hybridization Buffer (Sigma) at 42°C. Biotin-labeled gDNA was hybridized overnight at 42°C to serve as a loading control and then incubated with Streptavidin 800-IR secondary antibody (LI-COR Biosciences) in Odyssey Blocking Buffer containing 0.1% Tween-20 for one hour at room temperature. Finally, the blot was imaged on the Odyssey Imager and integrated intensities were quantified using Odyssey software (LI-COR Biosciences). Methylation integrated intensities were normalized to total genomic DNA intensities.
2.3 Quantitative RT-PCR analysis of gene transcription
Total RNA was extracted from brain using the Direct-zol RNA Mini Prep kit (Zymo Research) according to the manufacturer’s instructions. 2.67 µg of total RNA was reverse-transcribed to obtain cDNA in a final volume of 21 µL using the SuperScript III First-Strand Synthesis System (Invitrogen). Quantitative RT-PCR (qRT-PCR) utilizing SYBR as the fluorescent reporter was used to quantify the expression of Dnmt1, Dnmt3a and Dnmt3b. Reactions were carried out in duplicate in 384-well optical plates containing 25 ng RNA in each well. Gene expression was measured using the ABI ViiA7 Real-Time PCR System (Applied Biosystems) and normalized to Gapdh. cDNA was denatured at 95°C for 10 min and amplified during a sequence of 40 cycles consisting of a melting step at 95°C for 15 s and an annealing and extension step at 60°C for 1 min. The Livak method58 was used to calculate relative changes in gene expression. Briefly, the Ct, which is inversely correlated with target mRNA levels, was defined as the cycle number at which the SYBR Green emission reaches a preset threshold level. The target mRNA transcripts were expressed as the fold change between transcript levels in WD-fed animals compared with those from CD-fed animals. The sequences for the primers used are available in Supplemental Table 2. 2.4 Whole genome bisulfite sequencing
Library preparation and sequencing—Six frontal cortex DNA samples were chosen from mice fed either a CD or WD based on the quality of their Nanodrop parameters (n = 3 per group). Bisulfite treatment of genomic DNA was performed on these samples using the EZ DNA Methylation-Lightning kit (Zymo Research) according to the manufacturer’s instructions. Bisulfite-treated samples were submitted to the QB3 Vincent J. Coates Genomics Sequencing Laboratory for library preparation and sequencing. Libraries were constructed using TruSeq DNA Methylation kit (Illumina). Briefly, a specialized DNA polymerase that recognizes uracil nucleotides was used to randomly prime bisulfite-treated ssDNA and synthesize DNA strands containing a unique sequence tag. Tagged DNA was purified for subsequent amplification using a 1.6× concentration of AMPure XP beads. Amplification of the library, generation of a second strand of DNA and addition of sequencing primers to both ends of the original DNA strand was subsequently achieved through a 10-cycle PCR program. The final library was cleaned using a 1.0× concentration of AMPure XP beads, and any primer dimers were removed. Samples were run using the Illumina HiSeq 2500 as per the manufacturer’s instructions.
A
uthor Man
uscr
ipt
A
uthor Man
uscr
ipt
A
uthor Man
uscr
ipt
A
uthor Man
uscr
ipt
2.4.1 Differentially methylated region (DMR) analysis—Analysis of WGBS data was performed by Keith Dunaway of Janine LaSalle’s laboratory. All custom scripts and code are available for download at github.com/kwdunaway/WGBS_Tools as well as instructions on how to use them. Brief descriptions of each script are also on the wiki of this site.
2.4.2 WGBS alignment—Raw FASTQ files were filtered using Illumina quality score check, then split into two files based on adapter contamination. If adapters were present, the reads were trimmed to remove the adapters as well as the last 10 bases before the adapters. This was done to remove biased hypomethylation contamination known to occur at DNA within 10 bases of the 3’ adapter59. Reads were then aligned to the mouse genome (hg38) using BS-Seeker260. An example bash script can be found under examples/
Example_WGBSalignment.bash on the github site. Conversion efficiency was determined by analyzing methylation percentage of mitochondria DNA since it is expected to have no detectable levels of methylation60. Conversion efficiency was determined by analyzing the conversion rate of the mitochondrial DNA using ConvEff_SAM.pl.
2.4.3 Windowing—Average coverage of each CpG was around 3×, which is enough to confidently call 20kb windows61. Methylation data for CpGs found within CpG islands were masked before windowing. Windows that had less than 20 CpGs assayed for any of the six brain samples were also removed. Methylation was determined for each 20kb using Window_permeth_readcentric.pl through the following formula:
Significant differential methylation between WD and CD was determined through an unpaired 2-tailed t-test resulting in p < 0.05. Hypomethylation was called if WD methylation was less than CD and hypermethlation was called if the inverse pattern was observed. 2.5 Bioinformatic analyses
Bioinformatic analyses of genes presenting changes in DNA methylation were performed using independent software. For canonical pathway analysis, KEGG (Kyoto Encyclopedia of Genes and Genomes) (http://www.genome.jp/kegg/tool/map_pathway2.html) and MetaCore software packages MetaCore™ (GeneGo, St Joseph, MO, USA; https://portal.genego.com) were used to identify significantly overrepresented pathways. Gene-gene interaction networks were identified using a data-mining approach through MetaCore™. 2.6 Statistical analyses
Statistical analyses were performed using SigmaStat statistical software, version 3.5 (Systat Software, Inc). Prior to statistical analyses, the data was tested for normality and equal variance, and if necessary, transformations were applied to the data to meet these assumptions. A 2-tailed Student’s t-test was used to determine statistically significant differences between treatment groups. Data are presented as mean ± SEM, unless otherwise noted. A p-value < 0.05 was considered significant.
A
uthor Man
uscr
ipt
A
uthor Man
uscr
ipt
A
uthor Man
uscr
ipt
A
uthor Man
uscr
ipt
3. Results
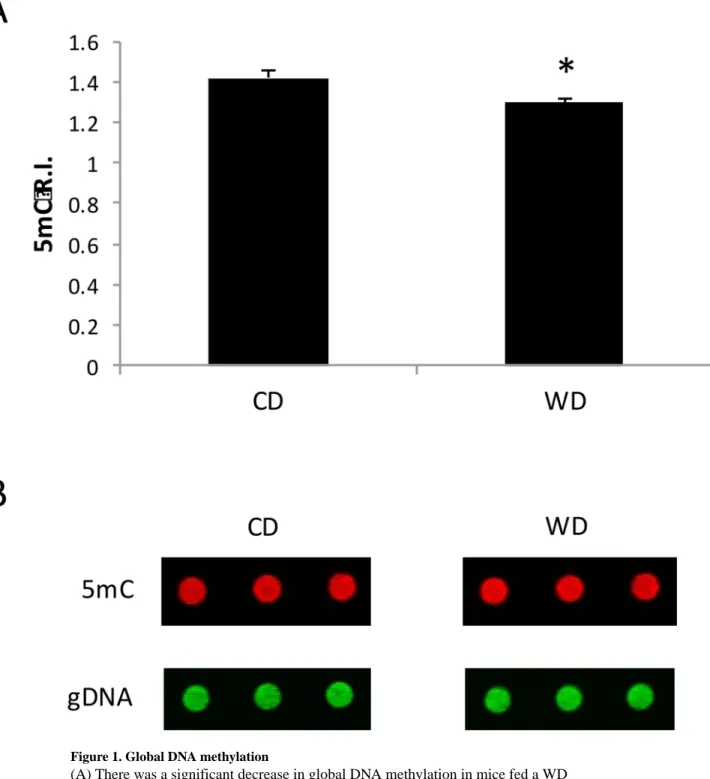
3.1 Consumption of a Western diet reduces global DNA methylation in the frontal cortex To test the hypothesis that consumption of a WD alters DNA methylation in the frontal cortex, we initially evaluated the effect of a WD on global DNA methylation. Dot blot analysis revealed that there was a significant decrease in DNA methylation from a relative intensity of 1.42 to a relative intensity of 1.29 in the frontal cortex of mice fed a CD compared with those fed a WD (p = 0.026) (Figure 1).
3.3 Transcript levels of the DNA methyltransferases are not affected by diet
Because DNMT enzymes are responsible for DNA methylation, we sought to quantify the expression of these genes in the frontal cortex of mice from the two diet groups. Transcript levels of Dnmt1, Dnmt3a and Dnmt3b did not differ between mice fed a WD and mice fed a CD (p = 0.587, p = 0.780, p = 0.449, respectively) (Supplemental Figure 1).
3.4 Consumption of a Western diet modulates the DNA methylation status of genes in the frontal cortex
To further define DNA methylation differences in the frontal cortex of mice fed a CD or a WD, we performed whole genome bisulfite sequencing (WGBS). We identified 3,660 differentially methylated regions (DMRs), of which 1,819 were hypomethylated and 1,841 were hypermethylated in WD-fed mice compared with CD-fed mice (Figure 2).
Additionally, we found sites of differential methylation that were localized within 743 genes. Among these genes, 317 were hypomethylated and 426 were hypermethylated in mice fed a WD compared with mice fed a CD.
We then performed bioinformatic analyses to characterize the cellular functions and processes associated with the differentially methylated genes identified above. Initially, we used MetaCore software to identify gene networks using a text-mining approach to
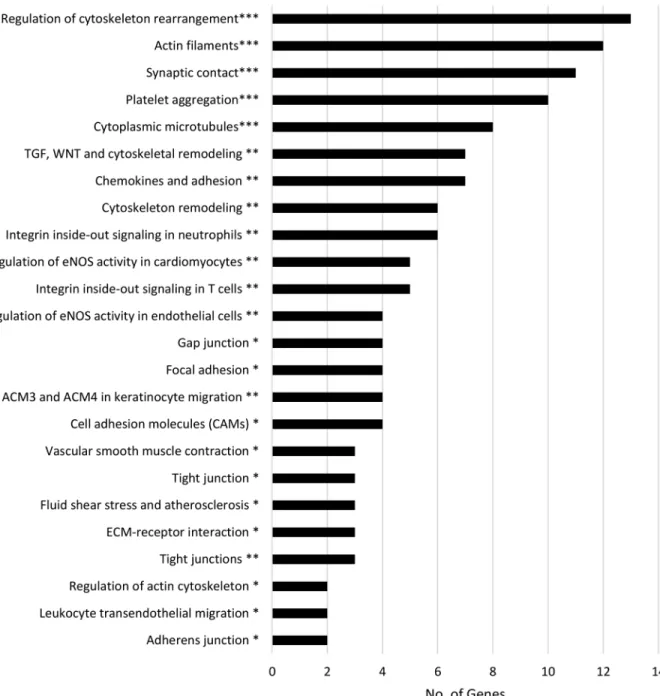
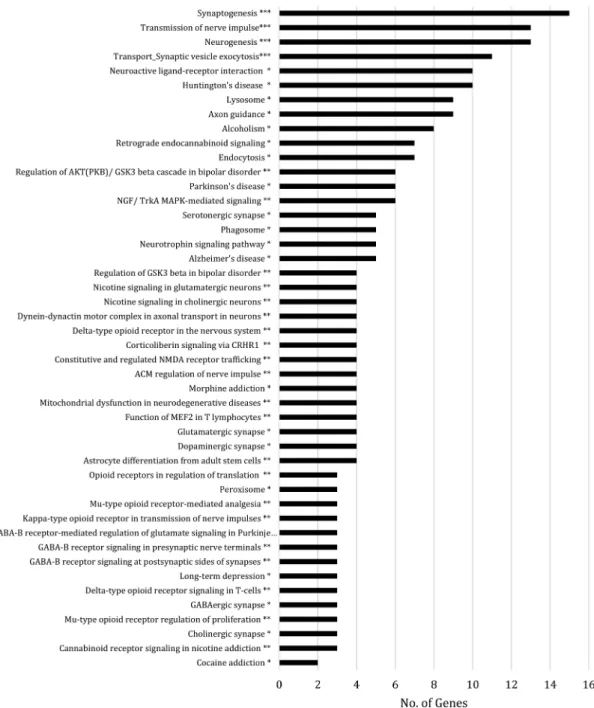
determine gene-gene interactions and identified 19 significant networks that are involved in regulating different cellular processes, particularly those involved in metabolism, cell adhesion and cytoskeleton integrity, inflammation and, importantly, neurological function. To further refine the specific cellular pathways in which these genes are involved, we utilized both the KEGG database and MetaCore software to identify overrepresented pathways (Figures 3, 4, 5 and 6). Using KEGG, we identified several pathways related to neurological function and disease, including neuroactive ligand-receptor interaction, axon guidance, Huntington’s disease, Parkinson’s disease and Alzheimer’s disease (AD). Furthermore, numerous genes were involved in the regulation of metabolism, cell adhesion, leukocyte transendothelial migration and inflammation. Pathway analysis using MetaCore produced similar results and identified pathways related to neurological function (e.g. astrocyte differentiation and neuronal signaling pathways), cell adhesion (e.g. chemokine adhesion), inflammation (e.g. platelet activating factor receptor (PTAFR) signaling pathway, histamine signaling pathway) and cytoskeleton remodeling and regulation. Thus, we identified four main biological processes regulated by the genes presenting genes in DNA methylation: metabolism, cell adhesion and cytoskeleton integrity, inflammation and neurological function (Figures 3, 4, 5 and 6, respectively).
A
uthor Man
uscr
ipt
A
uthor Man
uscr
ipt
A
uthor Man
uscr
ipt
A
uthor Man
uscr
ipt
4. Discussion
While there are likely a considerable number of biological mechanisms contributing to dementia, it has been shown that 1) consumption of a WD is associated with dementia20–28; and 2) both consumption of a WD and dementia are associated with alterations in DNA methylation45–51. Despite numerous studies analyzing the effect of maternal WD
consumption on DNA methylation in the offspring, few studies have looked at how chronic consumption of a WD might impact DNA methylation within an individual. Here, we fed male C57Bl/6J mice either a WD or a CD for 12 weeks, and our results suggest that consumption of a WD significantly alters DNA methylation in the frontal cortex. Dot blot analysis revealed that there was a significant decrease in global DNA methylation in the frontal cortex of mice fed a WD compared with mice fed a CD, though this was not accompanied by significant changes in the transcript levels of any of the DNMTs. Finally, bioinformatics analysis of WGBS data suggested that genes within pathways related to metabolism, cell adhesion and cytoskeleton integrity, inflammation and neurological function displayed differential DNA methylation following consumption of a WD. Firstly, consumption of a WD was associated with decreased global DNA methylation in mice, although there were no significant changes in gene expression in any of the DNMTs. Despite ample evidence that maternal consumption of a WD or a HFD influences DNA methylation in the offspring, this phenomenon has not been widely studied within a single individual. That is, to the best of our knowledge, our study is one of the first to show that DNA methylation can change within a lifetime in response to an environmental factor such as diet. This is particularly important as the study of the impact of modifiable risk factors on dementia gains popularity. Importantly, like the results presented here, dementia is often associated with global DNA hypomethylation in the brain62–64. Thus, our novel finding that consumption of a WD results in global DNA hypomethylation in the brain can potentially provide a mechanism by which consumption of a WD impacts dementia pathology. Interestingly, a global DNA hypomethylation in the brains of offspring from dams that consumed the HF diet has also been observed50, suggesting a potentially similar effect of WD on DNA methylation in individual as in offspring of parents that consumed WD diet. However, it appears that the alterations in DNA methylation in response to a WD do not come about due to downregulation of DNMTs, as we did not find any differences in the transcript levels of Dnmt1, Dnmt3a or Dnmt3b. Instead, it is possible that post-translational modifications of DNMTs, such as lysine methylation, account for the functional change in DNA methylation reported here65–67. Additionally, dot blot analysis and WGBS, both of which utilize bisulfite treatment of DNA to distinguish methylated cytosines from
unmethylated cytosines, cannot differentiate 5-hydroxymethylcytosine, the product of DNA hydroxymethylation, from 5-methylcytosine, the product of DNA methylation. Thus, the changes reported here could reflect either modification in DNA methylation or in DNA hydroxymethylation, which is thought to be an intermediate step in the process of DNA demethylation. Because of the antithetical effects of these modifications on gene expression, it is important for future studies to distinguish between the two.
Secondly, WGBS analysis of the brain revealed that there were several pathways that contained genes with altered DNA methylation profiles when mice were exposed to a WD.
A
uthor Man
uscr
ipt
A
uthor Man
uscr
ipt
A
uthor Man
uscr
ipt
A
uthor Man
uscr
ipt
We found that pathways related to metabolism, cell adhesion and cytoskeleton, inflammation and neurological function were especially impacted. Using the KEGG and MetaCore databases, we identified several pathways related to metabolism that were significantly affected by consumption of a WD. We observed DNA methylation alterations in the genes that code for the subunits of NADH dehydrogenase, succinate dehydrogenase, cytochrome C reductase and cytochrome C oxidase, all of which are essential components of the electron transport chain, which is the site of oxidative phosphorylation in prokaryotic cells. For instance, we observed significant DNA hypomethylation in Cox8 and Cox11, both of which are subunits of the larger cytochrome C oxidase complex. Interestingly, studies indicate that consumption of a WD is associated with an increase in mitochondrial oxidative stress due to the upregulation of electron transport chain components, which could contribute to cognitive decline68, 69. Because there have been very few studies analyzing DNA methylation in Cox8 and Cox11 and its effect on gene expression, it is not known how DNA methylation in these genes could impact gene expression. However, DNA methylation is canonically associated with reduced gene expression; therefore, the DNA hypomethylation observed following consumption of a WD in Cox8 and Cox11 could conceivably increase the transcription of these genes and thus contribute to increased oxidative stress and potentially cognitive decline.
The blood-brain barrier (BBB) is the regulated interface between the peripheral circulation and the central nervous system (CNS). The cerebral microvascular endothelium is essential for the health and function of the CNS70. More specifically, the endothelial cells of the BBB play an important role in regulating the permeability of the BBB to both solutes and cells71. There are many cellular proteins that are involved in the regulation of BBB permeability, such as transmembrane proteins (junctional adhesion molecule-1, occludin and claudins) and cytoplasmic proteins (zonula occludens-1 and -2, cingulin, AF-6 and 7H6). These proteins are further linked to the cellular actin cytoskeleton and are regulated by several intrinsic signaling pathways, including the focal adhesion kinase pathway. Importantly, disruption of endothelial cell permeability through alterations in the expression of these proteins can lead to impaired BBB function and thus compromise the CNS.
One of the proteins involved in the focal adhesion pathway is SHC1. Overexpression of the p66Shc isoform in endothelial cells resulted in increased endothelial cell permeability and leukocyte transmigration through the endothelial monolayer72. It has also been shown that genetic inactivation of p66Shc is neuroprotective in mice73. In our study, consumption of a WD decreased methylation in the promoter region of this gene, which suggests that its gene expression will increase. This overexpression could be associated with a potential increase endothelial cell permeability and consequently a decrease in cognitive function. This would agree with the results of a study that showed that genetic ablation of p66Shc reverses hippocampus-dependent cognitive deficits in a transgenic mouse model of AD74. Another gene that displayed differential methylation in response to a WD was Gab1, a member of the IRS1-like multisubstrate docking protein family that functions as a signaling protein regulating cell migration and cytoskeletal dynamism. In endothelial cells, it has been shown that Gab1 plays an important role in the regulation of monocyte adhesion and vascular leakage75. More specifically, it activates p28 Mapk, which in turn is required for
A
uthor Man
uscr
ipt
A
uthor Man
uscr
ipt
A
uthor Man
uscr
ipt
A
uthor Man
uscr
ipt
Ang-2-mediated disruption of the endothelial cell barrier75. We observed a significant decrease in the methylation of Gab1 in response to WD consumption, which could result in its overexpression and ultimately disruption of the BBB.
Thirdly, we identified several pathways related to inflammation that contained genes with differential methylation upon consumption of a WD. For example, we observed a decrease in the methylation status of the NFAT1 promoter region following consumption of a WD. NFAT1 is a transcription factor that, upon translocation to the nucleus in response to its activation by calcineurin, plays an essential role in regulating cytokine expression76. Importantly, NFAT1 translocation to the nucleus is associated with the mild cognitive impairment often seen in the early stages of AD76. The hypomethylation in the promoter region of NFAT1 observed here could potentially result in increased gene expression of this transcription factor and therefore could contribute to the increased inflammation seen in the early stages of cognitive decline.
Finally, bioinformatics analysis of our WGBS data revealed that there were a variety of genes displaying differential methylation involved in pathways related to neurological function. We observed that consumption of a WD resulted in hypermethylation of the dopamine transporter gene (Dat). Dat encodes a protein that pumps the neurotransmitter dopamine from the synaptic cleft back into the cytosol and so is the primary mechanism by which dopamine is cleared from the synapses following its release upon excitatory
stimulation of the neuron. DNA methylation within Dat is inversely associated with gene expression levels77; therefore, although we did not measure the gene expression of Dat in our study, it is plausible that the hypermethylation in Dat observed here could result in downregulation of the gene expression levels and therefore the protein expression levels of Dat. Importantly, decreased Dat levels are associated with cognitive impairment78–81, and DNA hypermethylation within this gene could at least partially explain how consumption of a WD contributes to cognitive decline observed in our mice.
In conclusion, we found that consumption of a WD for 12 weeks decreased global DNA methylation in the frontal cortex, a region implicated in several dementia pathologies, and could potentially provide an explanation for how consumption of a WD impacts dementia. Finally, we provide evidence that several gene networks and pathways contain genes with altered DNA methylation upon consumption of a WD, and that these pathways primarily affect metabolism, cell adhesion and cytoskeleton integrity, inflammation and neurological function. This study demonstrates for the first time that chronic consumption of a WD can affect DNA methylation of genes and gene patterns related to cognitive decline.
Supplementary Material
Refer to Web version on PubMed Central for supplementary material.
Acknowledgments
Sources of Funding
This study was supported by the Richard A. and Nora Eccles Harrison Endowed Chair in Diabetes Research Fund (to J.C.R.) and the National Institutes of Health through the following grants: the National Institute on Aging Grant
A
uthor Man
uscr
ipt
A
uthor Man
uscr
ipt
A
uthor Man
uscr
ipt
A
uthor Man
uscr
ipt
AG039094 (to J.C.R.) and the National Institute of Diabetes and Digestive and Kidney Diseases Grants U24 DK092993-05S1 (to J.C.R.) and U24 DK092993 (to Kent Lloyd). J.C.R. was partially funded through Grant U24 DK092993, which was awarded to Kent Lloyd. Kent Lloyd did not contribute to this manuscript.
References
1. Plassman BL, Langa KM, Fisher GG, Heeringa SG, Weir DR, Ofstedal MB, Burke JR, Hurd MD, Potter GG, Rodgers WL. Prevalence of dementia in the United States: the aging, demographics, and memory study. Neuroepidemiology. 2007; 29:125–132. [PubMed: 17975326]
2. Brookmeyer R, Gray S, Kawas C. Projections of Alzheimer's disease in the United States and the public health impact of delaying disease onset. American journal of public health. 1998; 88:1337– 1342. [PubMed: 9736873]
3. Prince M, Bryce R, Albanese E, Wimo A, Ribeiro W, Ferri CP. The global prevalence of dementia: a systematic review and metaanalysis. Alzheimers Dement. 2013; 9:63–75. e62. [PubMed: 23305823] 4. Hurd MD, Martorell P, Delavande A, Mullen KJ, Langa KM. Monetary costs of dementia in the
United States. N Engl J Med. 2013; 368:1326–1334. [PubMed: 23550670]
5. Wimo A, Jönsson L, Bond J, Prince M, Winblad B, A. D. International. The worldwide economic impact of dementia 2010. Alzheimer's & Dementia. 2013; 9:1–11. e13.
6. Ates MP, Karaman Y, Guntekin S, Ergun M. Analysis of genetics and risk factors of Alzheimer’s Disease. Neuroscience. 2016; 325:124–131. [PubMed: 27026590]
7. Baumgart M, Snyder HM, Carrillo MC, Fazio S, Kim H, Johns H. Summary of the evidence on modifiable risk factors for cognitive decline and dementia: A population-based perspective. Alzheimer's & Dementia. 2015; 11:718–726.
8. Xu W, Tan L, Wang H-F, Jiang T, Tan M-S, Tan L, Zhao Q-F, Li J-Q, Wang J, Yu J-T. Meta-analysis of modifiable risk factors for Alzheimer's disease. Journal of Neurology, Neurosurgery &
Psychiatry. 2015; 86:1299–1306.
9. Deckers K, Boxtel MP, Schiepers OJ, Vugt M, Muñoz Sánchez JL, Anstey KJ, Brayne C, Dartigues JF, Engedal K, Kivipelto M. Target risk factors for dementia prevention: a systematic review and Delphi consensus study on the evidence from observational studies. International journal of geriatric psychiatry. 2015; 30:234–246. [PubMed: 25504093]
10. Lorius N, Locascio JJ, Rentz DM, Johnson KA, Sperling RA, Viswanathan A, Marshall GA. Vascular disease and risk factors are associated with cognitive decline in the Alzheimer’s disease spectrum. Alzheimer disease and associated disorders. 2015; 29:18. [PubMed: 24787033] 11. Østergaard SD, Mukherjee S, Sharp SJ, Proitsi P, Lotta LA, Day F, Perry JR, Boehme KL, Walter
S, Kauwe JS. Associations between potentially modifiable risk factors and Alzheimer disease: a mendelian randomization study. PLoS Med. 2015; 12:e1001841. [PubMed: 26079503] 12. Kivipelto M, Ngandu T, Fratiglioni L, Viitanen M, Kåreholt I, Winblad B, Helkala E-L,
Tuomilehto J, Soininen H, Nissinen A. Obesity and vascular risk factors at midlife and the risk of dementia and Alzheimer disease. Archives of neurology. 2005; 62:1556–1560. [PubMed: 16216938]
13. Whitmer RA, Sidney S, Selby J, Johnston SC, Yaffe K. Midlife cardiovascular risk factors and risk of dementia in late life. Neurology. 2005; 64:277–281. [PubMed: 15668425]
14. Wang Y, Beydoun MA. The obesity epidemic in the United States—gender, age, socioeconomic, racial/ethnic, and geographic characteristics: a systematic review and meta-regression analysis. Epidemiologic reviews. 2007; 29:6–28. [PubMed: 17510091]
15. Cordain L, Eaton SB, Sebastian A, Mann N, Lindeberg S, Watkins BA, O’Keefe JH, Brand-Miller J. Origins and evolution of the Western diet: health implications for the 21st century. The American journal of clinical nutrition. 2005; 81:341–354. [PubMed: 15699220]
16. Akiyama T, Tachibana I, Shirohara H, Watanabe N, Otsuki M. High-fat hypercaloric diet induces obesity, glucose intolerance and hyperlipidemia in normal adult male Wistar rat. Diabetes research and clinical practice. 1996; 31:27–35. [PubMed: 8792099]
17. Merat S, Casanada F, Sutphin M, Palinski W, Reaven PD. Western-type diets induce insulin resistance and hyperinsulinemia in LDL receptor-deficient mice but do not increase aortic atherosclerosis compared with normoinsulinemic mice in which similar plasma cholesterol levels
A
uthor Man
uscr
ipt
A
uthor Man
uscr
ipt
A
uthor Man
uscr
ipt
A
uthor Man
uscr
ipt
are achieved by a fructose-rich diet. Arteriosclerosis, thrombosis, and vascular biology. 1999; 19:1223–1230.
18. Yan M-X, Li Y-Q, Meng M, Ren H-B, Kou Y. Long-term high-fat diet induces pancreatic injuries via pancreatic microcirculatory disturbances and oxidative stress in rats with hyperlipidemia. Biochemical and biophysical research communications. 2006; 347:192–199. [PubMed: 16814251] 19. Kanoski SE, Davidson TL. Western diet consumption and cognitive impairment: links to
hippocampal dysfunction and obesity. Physiology & behavior. 2011; 103:59–68. [PubMed: 21167850]
20. Francis H, Stevenson R. The longer-term impacts of Western diet on human cognition and the brain. Appetite. 2013; 63:119–128. [PubMed: 23291218]
21. Kalmijn S, Launer LJ, Ott A, Witteman J, Hofman A, Breteler M. Dietary fat intake and the risk of incident dementia in the Rotterdam Study. Annals of neurology. 1997; 42:776–782. [PubMed: 9392577]
22. Kalmijn, Sv, Van Boxtel, M., Ocke, M., Verschuren, W., Kromhout, D., Launer, L. Dietary intake of fatty acids and fish in relation to cognitive performance at middle age. Neurology. 2004; 62:275–280. [PubMed: 14745067]
23. Laitinen M, Ngandu T, Rovio S, Helkala E-L, Uusitalo U, Viitanen M, Nissinen A, Tuomilehto J, Soininen H, Kivipelto M. Fat intake at midlife and risk of dementia and Alzheimer’s disease: a population-based study. Dementia and geriatric cognitive disorders. 2006; 22:99–107. [PubMed: 16710090]
24. Morris M, Evans D, Bienias J, Tangney C, Wilson R. Dietary fat intake and 6-year cognitive change in an older biracial community population. Neurology. 2004; 62:1573–1579. [PubMed: 15136684]
25. Molteni R, Barnard R, Ying Z, Roberts C, Gomez-Pinilla F. A high-fat, refined sugar diet reduces hippocampal brain-derived neurotrophic factor, neuronal plasticity, and learning. Neuroscience. 2002; 112:803–814. [PubMed: 12088740]
26. Morrison CD, Pistell PJ, Ingram DK, Johnson WD, Liu Y, Fernandez-Kim SO, White CL, Purpera MN, Uranga RM, Bruce-Keller AJ. High fat diet increases hippocampal oxidative stress and cognitive impairment in aged mice: implications for decreased Nrf2 signaling. Journal of neurochemistry. 2010; 114:1581–1589. [PubMed: 20557430]
27. Pistell PJ, Morrison CD, Gupta S, Knight AG, Keller JN, Ingram DK, Bruce-Keller AJ. Cognitive impairment following high fat diet consumption is associated with brain inflammation. Journal of neuroimmunology. 2010; 219:25–32. [PubMed: 20004026]
28. Winocur G, Greenwood CE. Studies of the effects of high fat diets on cognitive function in a rat model. Neurobiology of aging. 2005; 26:46–49. [PubMed: 16219391]
29. DeKosky ST, Scheff SW. Synapse loss in frontal cortex biopsies in Alzheimer's disease: correlation with cognitive severity. Annals of neurology. 1990; 27:457–464. [PubMed: 2360787]
30. Whitehouse PJ, Price DL, Struble RG, Clark AW, Coyle JT, Delon MR. Alzheimer's disease and senile dementia: loss of neurons in the basal forebrain. Science. 1982; 215:1237–1239. [PubMed: 7058341]
31. Davies C, Mann D, Sumpter P, Yates P. A quantitative morphometric analysis of the neuronal and synaptic content of the frontal and temporal cortex in patients with Alzheimer's disease. Journal of the neurological sciences. 1987; 78:151–164. [PubMed: 3572454]
32. Terry RD, Masliah E, Salmon DP, Butters N, DeTeresa R, Hill R, Hansen LA, Katzman R. Physical basis of cognitive alterations in Alzheimer's disease: synapse loss is the major correlate of cognitive impairment. Annals of neurology. 1991; 30:572–580. [PubMed: 1789684]
33. Buchsbaum MS. Frontal cortex function. American Journal of Psychiatry. 2004; 161:2178–2178. [PubMed: 15569885]
34. Chayer C, Freedman M. Frontal lobe functions. Current neurology and neuroscience reports. 2001; 1:547–552. [PubMed: 11898568]
35. Esteller M, Herman JG. Cancer as an epigenetic disease: DNA methylation and chromatin alterations in human tumours. The Journal of pathology. 2002; 196:1–7. [PubMed: 11748635] 36. Egger G, Liang G, Aparicio A, Jones PA. Epigenetics in human disease and prospects for
epigenetic therapy. Nature. 2004; 429:457–463. [PubMed: 15164071]
A
uthor Man
uscr
ipt
A
uthor Man
uscr
ipt
A
uthor Man
uscr
ipt
A
uthor Man
uscr
ipt
37. Feinberg AP. Phenotypic plasticity and the epigenetics of human disease. Nature. 2007; 447:433– 440. [PubMed: 17522677]
38. Portela A, Esteller M. Epigenetic modifications and human disease. Nature biotechnology. 2010; 28:1057–1068.
39. Phillips T. The role of methylation in gene expression. Nature Education. 2008; 1:116. 40. Attwood JTY, L R, Richardson BC. DNA methylation and the regulation of gene transcription.
Cellular and Molecular Life Sciences. 2002; 59:241–257. [PubMed: 11915942]
41. Jones PL, Veenstra GCJ, Wade PA, Vermaak D, Kass SU, Landsberger N, Strouboulis J, Wolffe AP. Methylated DNA and MeCP2 recruit histone deacetylase to repress transcription. Nature genetics. 1998; 19:187–191. [PubMed: 9620779]
42. Nan X, Ng H-H, Johnson CA, Laherty CD, Turner BM, Eisenman RN, Bird A. Transcriptional repression by the methyl-CpG-binding protein MeCP2 involves a histone deacetylase complex. Nature. 1998; 393:386–389. [PubMed: 9620804]
43. Wade PA, Gegonne A, Jones PL, Ballestar E, Aubry F, Wolffe AP. Mi-2 complex couples DNA methylation to chromatin remodelling and histone deacetylation. Nature genetics. 1999; 23:62–66. [PubMed: 10471500]
44. Bird A. DNA methylation patterns and epigenetic memory. Genes & development. 2002; 16:6–21. [PubMed: 11782440]
45. Bakulski KM, Dolinoy DC, Sartor MA, Paulson HL, Konen JR, Lieberman AP, Albin RL, Hu H, Rozek LS. Genome-wide DNA methylation differences between late-onset Alzheimer's disease and cognitively normal controls in human frontal cortex. Journal of Alzheimer's disease : JAD. 2012; 29:571–588. [PubMed: 22451312]
46. Chouliaras L, Mastroeni D, Delvaux E, Grover A, Kenis G, Hof PR, Steinbusch HW, Coleman PD, Rutten BP, van den Hove DL. Consistent decrease in global DNA methylation and
hydroxymethylation in the hippocampus of Alzheimer's disease patients. Neurobiology of aging. 2013; 34:2091–2099. [PubMed: 23582657]
47. Coppieters N, Dieriks BV, Lill C, Faull RL, Curtis MA, Dragunow M. Global changes in DNA methylation and hydroxymethylation in Alzheimer's disease human brain. Neurobiology of aging. 2014; 35:1334–1344. [PubMed: 24387984]
48. Dunn GA, Bale TL. Maternal high-fat diet promotes body length increases and insulin insensitivity in second-generation mice. Endocrinology. 2009; 150:4999–5009. [PubMed: 19819967]
49. Mastroeni D, Grover A, Delvaux E, Whiteside C, Coleman PD, Rogers J. Epigenetic changes in Alzheimer's disease: decrements in DNA methylation. Neurobiology of aging. 2010; 31:2025– 2037. [PubMed: 19117641]
50. Vucetic Z, Kimmel J, Totoki K, Hollenbeck E, Reyes TM. Maternal high-fat diet alters methylation and gene expression of dopamine and opioid-related genes. Endocrinology. 2010; 151:4756–4764. [PubMed: 20685869]
51. Widiker S, Kärst S, Wagener A, Brockmann G. High-fat diet leads to a decreased methylation of theMc4r gene in the obese BFMI and the lean B6 mouse lines. Journal of applied genetics. 2010; 51:193–197. [PubMed: 20453306]
52. Ng S-F, Lin RC, Laybutt DR, Barres R, Owens JA, Morris MJ. Chronic high-fat diet in fathers programs [bgr]-cell dysfunction in female rat offspring. Nature. 2010; 467:963–966. [PubMed: 20962845]
53. Dudley KJ, Sloboda DM, Connor KL, Beltrand J, Vickers MH. Offspring of mothers fed a high fat diet display hepatic cell cycle inhibition and associated changes in gene expression and DNA methylation. PloS one. 2011; 6:e21662. [PubMed: 21779332]
54. Milagro F, Campion J, Garcia-Diaz D, Goyenechea E, Paternain L, Martinez J. High fat diet-induced obesity modifies the methylation pattern of leptin promoter in rats. Journal of physiology and biochemistry. 2009; 65:1–9. [PubMed: 19588726]
55. Vucetic Z, Kimmel J, Reyes TM. Chronic high-fat diet drives postnatal epigenetic regulation of μ-opioid receptor in the brain. Neuropsychopharmacology. 2011; 36:1199–1206. [PubMed: 21326195]
56. Jacobsen S, Brøns C, Bork-Jensen J, Ribel-Madsen R, Yang B, Lara E, Hall E, Calvanese V, Nilsson E, Jørgensen S. Effects of short-term high-fat overfeeding on genome-wide DNA
A
uthor Man
uscr
ipt
A
uthor Man
uscr
ipt
A
uthor Man
uscr
ipt
A
uthor Man
uscr
ipt
methylation in the skeletal muscle of healthy young men. Diabetologia. 2012; 55:3341–3349. [PubMed: 22961225]
57. Woods R, Vallero RO, Golub MS, Suarez JK, Ta TA, Yasui DH, Chi L-H, Kostyniak PJ, Pessah IN, Berman RF. Long-lived epigenetic interactions between perinatal PBDE exposure and Mecp2308 mutation. Human molecular genetics. 2012; 21:2399–2411. [PubMed: 22343140]
58. Livak KJ, Schmittgen TD. Analysis of relative gene expression data using real-time quantitative PCR and the 2− ΔΔCT method. methods. 2001; 25:402–408. [PubMed: 11846609]
59. Hansen KD, Langmead B, Irizarry RA. BSmooth: from whole genome bisulfite sequencing reads to differentially methylated regions. Genome biology. 2012; 13:R83. [PubMed: 23034175] 60. Guo W, Fiziev P, Yan W, Cokus S, Sun X, Zhang MQ, Chen P-Y, Pellegrini M. BS-Seeker2: a
versatile aligning pipeline for bisulfite sequencing data. BMC genomics. 2013; 14:774. [PubMed: 24206606]
61. Ziller MJ, Hansen KD, Meissner A, Aryee MJ. Coverage recommendations for methylation analysis by whole-genome bisulfite sequencing. Nature methods. 2015; 12:230–232. [PubMed: 25362363]
62. Chouliaras L, Mastroeni D, Delvaux E, Grover A, Kenis G, Hof PR, Steinbusch HW, Coleman PD, Rutten BP, van den Hove DL. Consistent decrease in global DNA methylation and
hydroxymethylation in the hippocampus of Alzheimer's disease patients. Neurobiol Aging. 2013; 34:2091–2099. [PubMed: 23582657]
63. Mastroeni D, Grover A, Delvaux E, Whiteside C, Coleman PD, Rogers J. Epigenetic changes in Alzheimer's disease: decrements in DNA methylation. Neurobiol Aging. 2010; 31:2025–2037. [PubMed: 19117641]
64. Mastroeni D, McKee A, Grover A, Rogers J, Coleman PD. Epigenetic differences in cortical neurons from a pair of monozygotic twins discordant for Alzheimer's disease. PloS one. 2009; 4:e6617. [PubMed: 19672297]
65. Estève P-O, Chang Y, Samaranayake M, Upadhyay AK, Horton JR, Feehery GR, Cheng X, Pradhan S. A methylation and phosphorylation switch between an adjacent lysine and serine determines human DNMT1 stability. Nature structural & molecular biology. 2011; 18:42–48. 66. Estève P-O, Chin HG, Benner J, Feehery GR, Samaranayake M, Horwitz GA, Jacobsen SE,
Pradhan S. Regulation of DNMT1 stability through SET7-mediated lysine methylation in mammalian cells. Proceedings of the National Academy of Sciences. 2009; 106:5076–5081. 67. Ling Y, Sankpal UT, Robertson AK, McNally JG, Karpova T, Robertson KD. Modification of de
novo DNA methyltransferase 3a (Dnmt3a) by SUMO-1 modulates its interaction with histone deacetylases (HDACs) and its capacity to repress transcription. Nucleic acids research. 2004; 32:598–610. [PubMed: 14752048]
68. Lin MT, Beal MF. Mitochondrial dysfunction and oxidative stress in neurodegenerative diseases. nature. 2006; 443:787. [PubMed: 17051205]
69. Zhang X, Dong F, Ren J, Driscoll MJ, Culver B. High dietary fat induces NADPH oxidase-associated oxidative stress and inflammation in rat cerebral cortex. Experimental neurology. 2005; 191:318–325. [PubMed: 15649487]
70. De Silva TM, Faraci FM. Microvascular dysfunction and cognitive impairment. Cellular and molecular neurobiology. 2016; 36:241–258. [PubMed: 26988697]
71. Hawkins BT, Davis TP. The blood-brain barrier/neurovascular unit in health and disease. Pharmacological reviews. 2005; 57:173–185. [PubMed: 15914466]
72. Laviola L, Orlando MR, Incalza MA, Caccioppoli C, Melchiorre M, Leonardini A, Cignarelli A, Tortosa F, Labarbuta R, Martemucci S. TNFα signals via p66Shc to induce E-selectin, promote leukocyte transmigration and enhance permeability in human endothelial cells. PLoS One. 2013; 8:e81930. [PubMed: 24349153]
73. Su KG, Savino C, Marracci G, Chaudhary P, Yu X, Morris B, Galipeau D, Giorgio M, Forte M, Bourdette D. Genetic inactivation of the p66 isoform of ShcA is neuroprotective in a murine model of multiple sclerosis. European Journal of Neuroscience. 2012; 35:562–571. [PubMed: 22277070] 74. Derungs R, Camici G, Spescha R, Welt T, Tackenberg C, Späni C, Wirth F, Grimm A, Eckert A,
Nitsch R. Genetic ablation of the p66Shc adaptor protein reverses cognitive deficits and improves
A
uthor Man
uscr
ipt
A
uthor Man
uscr
ipt
A
uthor Man
uscr
ipt
A
uthor Man
uscr
ipt
mitochondrial function in an APP transgenic mouse model of Alzheimer’s disease. Molecular psychiatry. 2016
75. Rathnakumar K, Savant S, Giri H, Ghosh A, Fisslthaler B, Fleming I, Ram U, Bera A, Augustin H, Dixit M. Angiopoietin-2 mediates thrombin-induced monocyte adhesion and endothelial
permeability. Journal of Thrombosis and Haemostasis. 2016; 14:1655–1667. [PubMed: 27241812] 76. Abdul HM, Sama MA, Furman JL, Mathis DM, Beckett TL, Weidner AM, Patel ES, Baig I,
Murphy MP, LeVine H. Cognitive decline in Alzheimer's disease is associated with selective changes in calcineurin/NFAT signaling. Journal of Neuroscience. 2009; 29:12957–12969. [PubMed: 19828810]
77. Vucetic Z, Carlin JL, Totoki K, Reyes TM. Epigenetic dysregulation of the dopamine system in diet-induced obesity. Journal of neurochemistry. 2012; 120:891–898. [PubMed: 22220805] 78. Cropley VL, Fujita M, Innis RB, Nathan PJ. Molecular imaging of the dopaminergic system and its
association with human cognitive function. Biological psychiatry. 2006; 59:898–907. [PubMed: 16682268]
79. Mozley LH, Gur RC, Mozley PD, Gur RE. Striatal dopamine transporters and cognitive functioning in healthy men and women. American Journal of Psychiatry. 2001; 158:1492–1499. [PubMed: 11532737]
80. Müller U, Wächter T, Barthel H, Reuter M, von Cramon DY. Striatal [123 I] β-CIT SPECT and prefrontal cognitive functions in Parkinson's disease. Journal of Neural Transmission. 2000; 107:303–319. [PubMed: 10821439]
81. Volkow ND, Chang L, Wang G-J, Fowler JS, Leonido-Yee M, Franceschi D, Sedler MJ, Gatley SJ, Hitzemann R, Ding Y-S. Association of dopamine transporter reduction with psychomotor impairment in methamphetamine abusers. American Journal of Psychiatry. 2001; 158:377–382. [PubMed: 11229977]
A
uthor Man
uscr
ipt
A
uthor Man
uscr
ipt
A
uthor Man
uscr
ipt
A
uthor Man
uscr
ipt
Figure 1. Global DNA methylation
(A) There was a significant decrease in global DNA methylation in mice fed a WD compared with mice fed a CD (p = 0.026). (B) Representative images of 5-methylcytosine (5mC) and total genomic DNA (gDNA). Each dot in each treatment group represents an individual sample from one mouse, in triplicate. 5mC relative intensity (R.I.) represents the fluorescence intensity of 5mC normalized to the fluorescence intensity of gDNA. n = 6 per treatment group, and results are expressed as mean ± SEM. * p < 0.05 was considered significant.
A
uthor Man
uscr
ipt
A
uthor Man
uscr
ipt
A
uthor Man
uscr
ipt
A
uthor Man
uscr
ipt
Figure 2. A volcano plot comparing p-value versus fold change in the percent DNA methylation for genes from mice fed a Western diet versus mice fed a control diet
The negative log10-transformed p-values of each gene, represented as a single point on the graph, are plotted against the log ratios of the DNA methylation fold change (FC). Black points represent non-significant genes. Blue and red points represent genes that were significantly hypomethylated and significantly hypermethylated, respectively, in mice fed a Western diet compared with mice fed a control diet. p < 0.05 was considered significant.
A
uthor Man
uscr
ipt
A
uthor Man
uscr
ipt
A
uthor Man
uscr
ipt
A
uthor Man
uscr
ipt
Figure 3. Visual representation of metabolism-related overrepresented genes with significant DNA methylation differences between mice fed a Western diet and mice fed a control diet
Each network or pathway (displayed on the y-axis) was graphed against the number of significant genes within that network or pathway (displayed on the x-axis). * Pathway identified using the KEGG database. ** Gene network identified using the MetaCore database. *** Pathway identified using the MetaCore database. p < 0.05 was considered significant.
A
uthor Man
uscr
ipt
A
uthor Man
uscr
ipt
A
uthor Man
uscr
ipt
A
uthor Man
uscr
ipt
Figure 4. Visual representation of overrepresented genes related to cell adhesion and
cytoskeleton integrity with significant DNA methylation differences between mice fed a Western diet and mice fed a control diet
Each network or pathway (displayed on the y-axis) was graphed against the number of significant genes within that network or pathway (displayed on the x-axis). * Pathway identified using the KEGG database. ** Gene network identified using the MetaCore database. *** Pathway identified using the MetaCore database. p < 0.05 was considered significant.
A
uthor Man
uscr
ipt
A
uthor Man
uscr
ipt
A
uthor Man
uscr
ipt
A
uthor Man
uscr
ipt
Figure 5. Visual representation of overrepresented genes related to inflammation with significant DNA methylation differences between mice fed a Western diet and mice fed a control diet
Each network or pathway (displayed on the y-axis) was graphed against the number of significant genes within that network or pathway (displayed on the x-axis). * Pathway identified using the KEGG database. ** Gene network identified using the MetaCore database. *** Pathway identified using the MetaCore database. p < 0.05 was considered significant.
A
uthor Man
uscr
ipt
A
uthor Man
uscr
ipt
A
uthor Man
uscr
ipt
A
uthor Man
uscr
ipt
Figure 6. Visual representation of overrepresented genes related to neurological function with significant DNA methylation differences between mice fed a Western diet and mice fed a control diet
Each network or pathway (displayed on the y-axis) was graphed against the number of significant genes within that network or pathway (displayed on the x-axis). * Pathway identified using the KEGG database. ** Gene network identified using the MetaCore database. *** Pathway identified using the MetaCore database. p < 0.05 was considered significant.


![[PDF] Cours complet pour apprendre Ruby | Formation informatique](data:image/gif;base64,R0lGODlhAQABAIAAAP///wAAACH5BAEAAAAALAAAAAABAAEAAAICRAEAOw==)