Effets à court terme des éclaircies précommerciales
sur les oiseaux chanteurs dans le sud du Québec
Mémoire
Renée Roy
Maîtrise en sciences forestières
Maître ès sciences (M. Sc.)
Québec, Canada
© Renée Roy, 2015
iii
Résumé
La conservation de la biodiversité est une des valeurs mises à l’avant-plan de l’aménagement forestier. Des traitements ayant comme objectif d’atténuer certains impacts négatifs de l’exploitation forestière sur la faune sont fréquemment réalisés afin de répondre à ces valeurs. J’ai étudié les effets d’éclaircies précommerciales (EPC), avec et sans mesures d’atténuation, sur les oiseaux chanteurs et les paramètres de végétation. Les mesures d’atténuation étaient essentiellement des réductions d’intensité des coupes. Un dispositif expérimental de type before-after-control-impact (BACI) a été mis sur pied par une équipe multidisciplinaire afin de répondre aux objectifs. Le dispositif comportait en moyenne 19 répétitions des traitements suivants : témoin, EPC régulière, EPC avec mesures d’atténuation faunique. Je n’ai trouvé aucune différence d’occurrence des différentes guildes d’oiseaux chanteurs en nidification entre les EPC avec mesures d’atténuation faunique et les EPC régulières. Les résultats suggèrent également que les EPC régulières pratiquées dans cette région ont un effet négligeable sur les guildes par rapport à des peuplements non éclaircis. Pour les paramètres de végétation, les travaux n’ont influencé significativement que l’obstruction visuelle latérale et le couvert forestier vertical de conifères. Cette étude ne remet pas en cause les conclusions d’études similaires pratiquées dans d’autres régions, mais indique que les EPC peuvent être pratiquées sans impact majeur sur les oiseaux forestiers de la région concernée.
Mots clés : Éclaircie précommerciale, oiseaux chanteurs, dispositifs expérimentaux (BACI), mesures d’atténuation, biologie de la conservation, aménagement.
v
Abstract
Biodiversity conservation is a key aspect of forest management. Silvicultural regimes that aim to mitigate some of the negative effects of logging on wildlife are often used to meet biodiversity conservation objectives. I studied the effects of wildlife mitigation measures for precommercial thinning (PCT) on songbirds and vegetation to check whether these measures have the desired effect. A before-after-control-impact (BACI) experimental design was established by a multidisciplinary team to assess the objectives. The design consisted of an average of 19 replicates for the following treatments: control, regular PCT, and wildlife-mitigated PCT. I found no difference in nesting songbird guilds between wildlife-mitigated PCT and regular PCT. The results also suggest that regular PCT had little or no effect on guilds, when compared to unthinned stands. The lack of an significant effect on birds likely arose from the weak effect of the treatments on vegetation, which affected only lateral visual obstruction and coniferous vertical forest cover. This study does not question the findings of similar studies performed in other regions, but indicates that PCT can be practiced without major impacts on forest songbirds in the region concerned with this study.
Keywords : Precommercial thinning, songs birds, experimental design (BACI), mitigation, conservation biology, management .
vii
Table des matières
Résumé ... iii
Abstract ... v
Liste des tableaux ... ix
Liste des figures ... xi
Liste des annexes ... xiii
Avant-Propos ... xv
Introduction ... 1
Complexité structurale des peuplements et biodiversité ... 1
Au Québec ... 2
Traitements sylvicoles avec mesures d’atténuation ... 3
Éclaircie précommerciale ... 3
Mesures d’atténuation ... 5
En Chaudière-Appalaches ... 5
Objectifs ... 7
Chapitre 1: Short-term Effects of Precommercial Thinning on Songbirds in southern Québec: a BACI Experiment ... 9 Introduction ... 10 Methods ... 12 Study Area ... 12 Experimental Design ... 12 Precommercial Thinning ... 13 Vegetation Sampling ... 14 Songbird Sampling ... 14 Data Analysis ... 15 Results ... 17 Vegetation ... 17 Songbirds ... 24 Discussion ... 29 Vegetation ... 29 Songbirds ... 30
Experimental design and analysis ... 31
Conclusion ... 32
viii Conclusion ... 35 Végétation ... 35 Oiseaux chanteurs ... 37 Bibliographie ... 43 Annexes ... 51
Annexe 1. Modalités pour l’éclaircie précommerciale de plantation avec conservation d’îlots, d’après Chaudière et Appalaches, 2010 ... 52
Annexe 2. Modalités pour l’éclaircie précommerciale résineuse adaptée, d’après Chaudière et Appalaches, 2010 ... 53
Annexe 3. GLMM, extraits de programmation SAS ... 56
Annexe 4. Modèles d’occupation (R) ... 57
Annexe 5. Puissance statistique (R) ... 58
Annexe 6. Liste des espèces observées. Les espèces surlignées ont été observées à plus de 5% des visites. ... 60
ix
Liste des tableaux
Table 1. Characteristics (mean (SD)) of vegetation Parameters in Precommercial Thinning,
Wildlife-Mitigated Precommercial Thinning and Control, before and after treatment. ... 21 Table 2. Significance tests (P) and Estimates of Generalized Linear Mixed Models of the Effects of Precommercial Thinning (PCT) and Wildlife-Mitigated PCT (wmPCT) on Vegetation Parameters. ... 23 Table 3. Ratios of Occurrences/Visit (mean (SD)) of song birds in Precommercial Thinning,
Wildlife-Mitigated Precommercial Thinning and Control, before and after treatment. Only species reported in > 5 % of points counts are shown. ... 25 Table 4. Occurrences (mean (SD)) of nesting and foraging guilds in Precommercial Thinning, Wildlife-Mitigated Precommercial Thinning and Control, before (2009) and after (2011 and 2012) treatment. ... 27 Table 5. Generalized Linear Mixed Model estimates for the year * treatment interaction on nesting and foraging guilds. Treatments were precommercial thinning, wildlife-mitigated precommercial thinning and control. ... 27
xi
Liste des figures
Figure 1 Study area and locations of selected stands (source: Ministère des Forêts, de la Faune et des Parcs). ... 13 Figure 2. Coniferous vertical forest cover changes (± standard error) between treatments, among years. The vertical dashed line represents the year in which there were treatments. Different letters over the bars indicate significant differences at P < 0.05. Note that the bars represent a “cross-section” of treatments across plots and, therefore, do not capture random effects caused by initial plot differences (as opposed to other statistical analyses presented elsewhere in the text). ... 18 Figure 3. Lateral obstruction changes (± standard error) between treatments, among years. The vertical dashed line represents the year in which treatments were applied. Different letters over the bars indicate significant differences within year, at P < 0.05. Note that bars represent a “cross-section” of treatments across plots and, therefore, do not capture random effects (compared with other statistical analyses presented elsewhere in the text). ... 20 Figure 4. Mean number of birds (SD) reported in responses to Precommercial Thinning, Wildlife-Mitigated Precommercial Thinning and Control, before and after treatment. ... 28
xiii
Liste des annexes
Annexe 1. Modalités pour l’éclaircie précommerciale de plantation avec conservation d’îlots,
d’après Chaudière et Appalaches, 2010 ... 52
Annexe 2. Modalités pour l’éclaircie précommerciale résineuse adaptée, d’après Chaudière et Appalaches, 2010 ... 53
Annexe 3. GLMM, extraits de programmation SAS ... 56
Annexe 4. Modèles d’occupation (R) ... 57
Annexe 5. Puissance statistique (R) ... 58
Annexe 6. Liste des espèces observées. Les espèces surlignées ont été observées à plus de 5% des visites. ... 60
xv
Avant-Propos
Un gros merci à André Desrochers et à Pierre Blanchette pour tous leurs bons conseils tout au long de ma maîtrise. Merci à Pascale Forget, qui a pensé à moi pour cette maîtrise et avec qui j’ai eu beaucoup de plaisir à travailler. Merci à ma famille, mes amis et mon amour pour tout le support apporté durant cette aventure. Merci également à tous les aides terrains pour leur précieux travail, à Louis Imbeau pour le temps pris afin d’évaluer et commenter mon mémoire et à Aliké Harel et William (Bill) F.J. Parsons pour la révision linguistique. Finalement, merci à mes confrères et consœurs de labo pour toute l’aide apportée et tous ces dîners qui m’ont changé les idées!
Cette étude a été possible grâce à la collaboration de plusieurs partenaires financiers, soit la Conférence régionale des élu(e)s de la Chaudière-Appalaches, le ministère des Forêts, de la Faune et des Parcs, la Fondation de la faune du Québec, l’Agence de mise en valeur des forêts privées des Appalaches, l’Université Laval et l’Agence régionale de mise en valeur des forêts privées de la Chaudière.
Le chapitre principal de ce mémoire est rédigé en anglais puisqu’il sera soumis à la revue Forest Ecology and Management. Je serai l’auteur principal, André Desrochers et Pierre Blanchette seront les deuxième et troisième auteurs.
CHAPITRE 1:
Roy, R., A. Desrochers and P. Blanchette. Short-term Effects of Precommercial Thinning on Songbirds in southern Québec: a BACI Experiment.
1
Introduction
On estime que les forêts fournissent un habitat aux deux tiers des espèces terrestres (World Commission on Forests and Sustainable Development, 1999). Cependant, depuis trois siècles, une perte nette de forêts sur l’ensemble du globe a été estimée à entre sept et onze millions de km2 (Foley et al., 2005). De plus, deux millions de km2 de forêts aménagées ont remplacé les forêts naturelles (Turner, 1990). Ces altérations massives du paysage forestier sont préoccupantes puisque la perte d’habitats, leur modification et leur fragmentation sont parmi les principales causes du déclin de la biodiversité mondiale (Pimm & Raven, 2000; Fahrig, 2003; Foley et al., 2005).
Complexité structurale des peuplements et biodiversité
La conservation de la biodiversité est une des valeurs mises à l’avant-plan non seulement à l’intérieur des zones protégées, mais également à l’intérieur des forêts aménagées (Bengtsson et al., 2000). La conservation de la biodiversité en forêt exploitée dépend, entre autres, du maintien de la complexité structurale des peuplements, constituée de différents attributs (Lindenmayer et al., 2006). Parmi ceux-ci, notons la présence d’arbres de différents âges à l’intérieur du peuplement, particulièrement les arbres de grandes dimensions (Linder & Ostlund, 1998; Lindenmayer et al., 2006); le maintien des débris ligneux et des chicots ainsi que l’hétérogénéité du couvert vertical et horizontal (Berg et al., 1994; Linder & Ostlund, 1998; Franklin & Van Pelt, 2004). Le maintien des arbres de grande dimension s’avère un attribut-clé particulièrement important pour certaines espèces, comme les grands rapaces et certains pics, qui en ont besoin pour nicher ou s'alimenter (Linder & Ostlund, 1998; Imbeau & Desrochers, 2002; Drapeau et al., 2009). Bon nombre d’animaux et de végétaux dépendent du bois mort, que ce soit pour se nourrir, trouver un site de repos ou bien nicher (Darveau & Desrochers, 2001; Crête et al., 2004). Le maintien de la complexité structurale permet aux organismes de maintenir leurs populations dans les zones exploitées où, autrement, ils n’auraient pu subsister. Ce maintien peut également faciliter un retour plus rapide d’habitats adéquats pour les espèces qui ont été déplacées à la suite d’un traitement sylvicole (Lindenmayer et al., 2006).
2
Pour s’adapter aux nouveaux défis posés par la conservation de la biodiversité, la foresterie ne cible plus la simple production de bois, mais incorpore, depuis plusieurs années, de nouvelles valeurs à la gestion des forêts (Rosenvald & Lohmus, 2008). Certaines approches de gestion des travaux sylvicoles concilient les principes généraux de conservation de la biodiversité. L’une de ces approches consiste à imiter les perturbations naturelles (Hunter, 1993; Bengtsson et al., 2000; Mitchell et al., 2002). L’hypothèse de base de cette approche est que la faune et la flore sont plus susceptibles de persister dans un écosystème aménagé si les perturbations d’origine humaine, telles que l’exploitation forestière, s’inspirent des patrons de perturbations d’origine naturelle (Mitchell et al., 2002). Cette approche, qui est au cœur de l'aménagement écosystémique, a pour but de réduire les écarts entre la forêt aménagée et la forêt naturelle, de manière à créer des paysages qui maintiennent une structure qui se rapproche des paysages naturels (Gauthier et al., 2008).
Au Québec
En 2010, le gouvernement du Québec adoptait la Loi sur l’aménagement forestier durable au Québec (L.R.Q., c. A-18.1), qui confère désormais un rôle central à l’aménagement écosystémique (Gouvernement du Québec, 2010). De plus, au Québec, l’approvisionnement des usines est assuré à plus de 20 % par les forêts privées (Gouvernement du Québec, 2008). Ce pourcentage pourrait s’accroître au cours des prochaines années si l’on tient compte du volume additionnel de bois qui devrait être généré grâce aux deux milliards de dollars investis en travaux sylvicoles au cours des quarante dernières années (Gouvernement du Québec, 2011). La forêt privée est située principalement dans le sud du Québec et a la particularité d’occuper les sols les plus fertiles de la province, d’être sillonnée par un réseau routier bien développé et d’être située à proximité des usines de transformation, des marchés et des zones habitées (Gratton et al., 2010). D’un point de vue économique, ce sont tous des avantages profitables aux compagnies forestières et aux propriétaires puisque le temps de rotation de coupe est plus court et les coûts de transports sont moindres. Les forêts du Québec méridional abritent la biodiversité la plus riche du territoire québécois, et les espèces les plus à risque à l’échelle québécoise se concentrent dans le sud de la province (Tardif et al., 2005; Gratton et al., 2010). L’intensification des travaux d’aménagement en forêt privée pourrait accroître la pression sur la biodiversité locale. Comme la tenure de la majorité du territoire forestier du
3
Québec méridional est privée, la conservation et la gestion du milieu forestier dans cette région ne peut appliquer les mêmes principes directeurs qu’en forêt publique (Gratton & Hone, 2006).
Traitements sylvicoles avec mesures d’atténuation Éclaircie précommerciale
Depuis plusieurs années, des traitements ayant comme objectif d’atténuer certains impacts jugés négatifs de l’exploitation forestière sur la faune sont mis en application. Par exemple, l’éclaircie précommerciale, dite régulière dans le présent contexte, est appliquée sans mesure particulière d’atténuation pour la faune. Ce traitement est idéalement pratiqué dans de jeunes peuplements, lorsque les arbres ont atteint une hauteur de 2 à 3 m (Gouvernement du Québec, 2003; ARFPC, 2010) ou entre 6 et 35 ans, selon l’endroit où il est effectué dans le monde (Chisholm, 2008; Griffin, 2007; Cole, 2010). L’objectif de l'éclaircie précommerciale est d’éliminer des tiges qui nuisent à la croissance d’arbres sélectionnés (Brissette et al., 1999; ARFPC, 2010). Ainsi, la croissance d’un nombre restreint d’arbres d’essences recherchées sera stimulée afin qu’ils atteignent une dimension marchande plus rapidement (Smith et al., 1997; Brissette et al., 1999; Gouvernement du Québec, 2003). Cette intervention n’inclut généralement aucune récupération de volume (ARFPC, 2010). Pour un propriétaire, selon les conditions économiques, l’éclaircie précommerciale peut être un investissement intéressant sur les sites de qualité supérieure qui sont situés à proximité des infrastructures de transformation du bois (Pitt et al., 2013). En effet, selon Bataineh et al. (2013), une augmentation substantielle de la croissance du bois marchand est observée après l’éclaircie précommerciale, ce qui génère des gains de production totale et en droits de coupe. Du point de vue de la conservation, les éclaircies précommerciales ont un impact sur la biodiversité des jeunes peuplements car fréquemment, elles altèrent l’abondance de certaines espèces fauniques (Bujold, 2004; Etcheverry et al., 2005; Griffin & Mills, 2007; Taki et al., 2010), modifient la proportion de certaines espèces floristiques et simplifient la structure des peuplements (Homyack et al., 2004; Taki et al., 2010).
Un des effets connus de l’éclaircie précommerciale sur la structure de la végétation est la réduction du couvert vertical et de l’obstruction latérale (Blanchette et al., 2003; Bujold,
4
2004; Homyack et al., 2004). De plus, ce traitement peut augmenter le couvert végétal du sous-bois, modifier la composition végétale et diminuer l’hétérogénéité structurale (Etcheverry et al., 2005; Belle-Isle & Kneeshaw, 2007; Cole et al., 2010). Sur le plan faunique, l’éclaircie précommerciale suscite certaines craintes puisqu’elle se pratique à un stade important du processus de rétablissement des communautés fauniques après l'application de la coupe avec protection de la régénération et des sols (Sansregret, 2000). Puisqu’une proportion non négligeable des forêts québécoises est aménagée à l’aide de ce traitement, il pourrait en résulter une modification majeure de l’habitat pour plusieurs espèces animales (Etcheverry et al., 2005). Par exemple, le lièvre d’Amérique (Lepus americanus), souvent associé à une strate arbustive dense, riche en nourriture et en abris, peut diminuer en abondance après une éclaircie précommerciale (Griffin & Mills, 2007; Homyack et al., 2007; Abele et al., 2013). On a aussi noté un déclin de la Grive de Bicknell (Catharus bicknelli), une espèce d’habitats denses, suite à des éclaircies précommerciales (Chisholm & Leonard, 2008). Par contre, les espèces qui utilisent les forêts plus matures peuvent bénéficier de ce traitement (Lautenschlager et al., 1997; Homyack, 2003). En effet, les peuplements traités par éclaircie précommerciale acquièrent plus rapidement des attributs de forêt mature tels que des diamètres d’arbres supérieurs, une structure de sous-étage diversifiée et une canopée composée de plus de trouées (Homyack et al., 2005). Ainsi, pour les oiseaux forestiers, l’éclaircie précommerciale peut favoriser les espèces de milieux ouverts et colonisatrices, telles que le Junco ardoisé (Junco hyemalis) et le Bruant à gorge blanche (Zonotrichia albicollis) (Sansregret, 2000). Quant aux micromammifères, le campagnol à dos roux (Clethrionomys gapperi), une espèce de forêt mature, a vu son abondance augmenter suite à une éclaircie précommerciale effectuée au Maine (Homyack et al., 2005). La richesse et l’abondance des espèces d’insectes étudiées par Taki et al. (2010) ont augmenté dans les peuplements traités par éclaircie précommerciale. La réduction de la diversité spécifique et de la densité végétale résultant de ce traitement semblent peu compatibles avec le maintien à court terme des espèces associées aux peuplements denses et aux premiers stades de la succession forestière (Woodcock et al., 1997; Harvey, 2009).
5 Mesures d’atténuation
À la suite des constatations issues des études sur les éclaircies précommerciales, des recommandations ont été faites afin d’atténuer les effets sur la faune (Gouvernement du Québec, 2002). Ainsi, les normes du traitement pourraient être modifiées pour protéger certains attributs d’habitats, par exemple conserver les arbustes, les arbrisseaux, les arbres fruitiers et les autres espèces végétales qui ne nuisent pas directement à la croissance des tiges d’avenir (Gouvernement du Québec, 2002; Bujold, 2004). On encourage la protection des tiges des essences secondaires comme le thuya occidental (Thuja occidentalis), le pin blanc (Pinus strobus) ou le bouleau jaune (Betula alleghaniensis) afin de conserver une certaine diversité floristique (Gouvernement du Québec, 2002). Afin de maintenir la diversité des écosystèmes à l’échelle du paysage, les gestionnaires devraient exclure certains peuplements de l’éclaircie précommerciale après une coupe avec protection de la régénération et des sols ou une perturbation naturelle (Etcheverry et al., 2005; Abele et al., 2013). Également, d’autres pratiques pourraient être développées afin de diversifier les options disponibles en matière de protection de la valeur des habitats. Par exemple, les éclaircies précommerciales par bosquets, par bandes refuges ou par le maintien d’îlots non traités ont été suggérées (Woodcock et al., 1997; De Bellefeuille et al., 2001; Gouvernement du Québec, 2002). L’impact de l’éclaircie précommerciale régulière sur la structure et la biodiversité de la végétation des peuplements et de la faune a largement été documenté (Harvey, 2009), mais peu d’études ont été faites sur les éclaircies précommerciales avec mesures d’atténuation. Major & Desrochers (2013) ont montré que les mesures d’atténuation maintiennent généralement l’abondance d’arbustes fruitiers. Par contre, selon Sansregret (2000), aucune des mesures d’atténuation testées jusqu’à maintenant ne serait efficace pour maintenir des communautés aviaires, du moins dans la sapinière à bouleau blanc de l’est dans la région du Saguenay Lac-Saint-Jean, Québec. L’efficacité de ces pratiques pourrait varier grandement selon le domaine bioclimatique.
En Chaudière-Appalaches
Des traitements, appelés travaux forêt-faune, ont été élaborés par l’Agence régionale de mise en valeur des forêts privées de la Chaudière, en collaboration avec la Fondation de la faune (ARFPC & AMVAP, 2010). Ces traitements visent à concilier l’aménagement forestier avec les besoins d’habitat des espèces fauniques du milieu (Fondation de la faune
6
du Québec, 2009). Depuis 2006, la Conférence régionale des élu(e)s de la Chaudière-Appalaches a investi environ 55 % des 5,3 millions de dollars de son Programme de mise en valeur des ressources du milieu forestier – Volet II dans les travaux forêt-faune (données non publiées, ARFPC). Les travaux forêt-faune sont en constante évolution et se modulent selon les résultats obtenus, les domaines d’expertise développés et l’acquisition de nouvelles connaissances (ARFPC & AMVAP, 2010). Certains traitements sont encore au stade expérimental (ARFPC & AMVAP, 2010) et doivent être évalués afin d’estimer leur efficacité et l’atteinte des objectifs (Fondation de la faune du Québec, 2009). Dans cette optique, une étude sur les travaux forêt-faune a vu le jour en 2008. Cette étude mise sur un partenariat régional entre l’Agence régionale de mise en valeur des forêts privées de la Chaudière, le ministère des Forêts, de la Faune et des Parcs, l’Agence régionale de mise en valeur des forêts privées des Appalaches, la Fondation de la Faune du Québec, la Conférence régionale des élu(e)s et la Commission régionale des ressources naturelles et du territoire Chaudière-Appalaches.
La présente étude se base sur un dispositif expérimental de type before-after-control-impact (BACI; (Rasmussen et al., 1993; Underwood, 1994), qui tente d’estimer la valeur des peuplements traités en éclaircie précommerciale, en tant qu’habitat pour la faune (ARFPC & AMVAP, 2010). En plus des éclaircies précommerciales régulières, deux traitements forêt-faune sont abordés, soit l’éclaircie précommerciale de plantation avec conservation d’îlots et l’éclaircie précommerciale résineuse adaptée. L’éclaircie précommerciale de plantation avec conservation d’îlots s’applique aux plantations qui comptent plus de 7 500 tiges/ha répondant aux critères d’admissibilité du dégagement de plantation (ARFPC & AMVAP, 2010). L’objectif de cette pratique est de conserver 6 à 9 îlots/ha non traités d’au minimum 49 m2 et répartis uniformément dans le peuplement (voir l’annexe 1 pour les modalités de ce traitement). Le but est d’atténuer l’effet du traitement régulier qui réduit normalement la disponibilité de nourriture et d’abris pour la faune (ARFPC & AMVAP, 2010). L’éclaircie précommerciale résineuse adaptée est un autre type de traitement forêt-faune qui s’applique à de jeunes peuplements résineux ou à dominance résineuse comptant plus de 7 500 tiges/ha issus de coupe totale et régénérés naturellement (ARFPC & AMVAP, 2010). Ce traitement cherche à maintenir des éléments de biodiversité et à
7
conserver des secteurs denses en réalisant le traitement par bandes ou par blocs d’un hectare maximum en alternance avec des secteurs non traités d’une largeur minimale de 50 m (voir l’annexe 2 pour les modalités de ce traitement). Un des objectifs de l’étude est de vérifier si les mesures d’atténuation faunique proposées et utilisées dans les forêts privées de la Chaudière-Appalaches pour ces travaux atteignent les objectifs. Le cas échéant, l’étude dans laquelle s’inscrit ce mémoire permettrait de bonifier ces mesures ou d’identifier d’autres mesures d’atténuation qui pourraient être plus efficaces ou nécessaires au maintien de la biodiversité (ARFPC & AMVAP, 2010). Trois groupes fauniques ou d’espèces ont été ciblés pour répondre à ces questions : l’herpétofaune, le lièvre d’Amérique et les passereaux. Le présent projet de maîtrise s’intéresse spécifiquement à la faune aviaire. Puisqu’il inclut des réplicats temporelles et spatiales, le dispositif de cette étude permet de déterminer si les changements observés sont causés par le traitement, en tenant compte de la variation naturelle, temporelle et d’autres facteurs particuliers aux peuplements choisis (Rasmussen et al., 1993; Underwood, 1994).
Objectifs
Ce projet de maîtrise a pour objectif d’évaluer l’impact à court terme des traitements forêt-faune sur les passereaux et certains paramètres couramment utilisés pour décrire la végétation. Les peuplements aménagés à l’aide de ces traitements seront comparés à des peuplements témoins non éclaircis et à des éclaircies précommerciales régulières. Il est attendu que, dans les peuplements traités, l'évolution interannuelle de l’occurrence des espèces, des différentes guildes et des paramètres de végétation différeront entre les peuplements traités en éclaircie précommerciale régulière et ceux où un traitement forêt-faune a été pratiqué, ces derniers se rapprochant des peuplements sans traitements.
9
Chapitre 1: Short-term Effects of Precommercial
Thinning on Songbirds in southern Québec: a BACI
10
Introduction
Precommercial thinning (PCT) is practiced in early successional forests across North America (Homyack, 2003; Griffin & Mills, 2007; Cole et al., 2010), Europe (Fahlvik et al., 2005; Huuskonen & Hynynen, 2006; Gunulf et al., 2012) and Asia (Taki et al., 2010). The goal of this treatment is to remove stems that interfere with the growth of selected trees, in order to stimulate the growth of the remaining trees so that they reach a timber market size more quickly (Smith et al., 1997; Brissette et al., 1999; Zhang et al., 2006). PCT is occurring in an increasing number of forested areas in northeastern North America, and forest managers are increasingly required to justify this practice in terms of wildlife habitat and biodiversity conservation (Homyack et al., 2007).
In terms of wildlife, PCT raises some concerns given that it is practiced during the recovery of the original wildlife community following clear-cutting (Sansregret, 2000). Since PCT aims to reduce stem density, one of its most obvious side effects for wildlife is the decline in vertical and lateral cover (Bujold, 2004; Homyack et al., 2004). Additional side effects of this treatment on wildlife habitat include an increase in forest floor tangling, a reduction of structural heterogeneity, and even a change in vegetation composition (Etcheverry et al., 2005; Belle-Isle & Kneeshaw, 2007; Cole et al., 2010). The loss of vegetation diversity and stand density incurred by this treatment seems incompatible with the short-term conservation of species that are associated with dense stands and early forest successional stages (Woodcock et al., 1997; Harvey, 2009). Following PCT, a decrease in the availability of food for many wildlife species and a reduction of the stand effectiveness in providing protection from predators are to be expected (Sansregret, 2000; Lavoie, 2001; Etcheverry et al., 2005). For example, snowshoe hare (Lepus americanus) is associated with dense vegetation cover (Beaudoin et al., 2004), and can decrease in abundance following PCT (Griffin & Mills, 2007; Homyack et al., 2007; Abele et al., 2013). Similarly, Bicknell's Thrush (Catharus bicknelli), can be affected negatively by PCT (Chisholm & Leonard, 2008). In contrast, species that use mature forests may benefit from these treatments (Homyack, 2003). Stands that are treated with PCT more quickly recover the characteristic attributes of mature forests, such as greater stem diameters, structurally diverse understories, and a canopy layer with more openings (Homyack et al., 2005). Thus,
11
the Red-backed Vole (Clethrionomys gapperi), a mature forest species, may increase in abundance following PCT (Homyack et al., 2005). Also, for forest birds, PCT may benefit species that colonize open areas, such as Dark-eyed Junco (Junco hyemalis) and White-throated Sparrow (Zonotrichia albicollis) (Sansregret, 2000). Finally, species richness and abundance of insect groups increased in thinned forest stands, as reported in the study by Taki et al. (2010).
PCT research has led to mitigation recommendations for wildlife. PCT could be designed to retain morevegetation, such as shrubs, fruit trees, plants that do not directly affect the growth of crop trees, and some less common tree species like eastern white cedar (Thuja occidentalis L.), eastern white pine (Pinus strobus L.) and yellow birch (Betula alleghaniensis Britt.) to maintain floristic diversity (Gouvernement du Québec, 2002; Bujold, 2004). To maintain ecosystem diversity at the landscape level, forest managers should exclude some stands from PCT when clear-cutting or stand-initializing disturbances have previously occurred (Etcheverry et al., 2005; Abele et al., 2013). In contrast, solutions could be developed to diversify the means of reducing forestry impacts on wildlife habitat, such as precommercial thinning on thickets, refuge strips or untreated patches (Woodcock et al., 1997; De Bellefeuille et al., 2001; Gouvernement du Québec, 2002). The impacts of regular PCT on stand structure and biodiversity have been studied extensively, but few studies have been performed on PCT that includes mitigation measures for wildlife. Major & Desrochers (2013) showed that mitigated precommercial thinning generally maintained the density of fruit shrubs that were available in the study stands. Sansregret (2000), however, found that none of the mitigation measures tested seemed effective in maintaining the bird populations, but this study was conducted in the balsam fir-paper birch east ecozone. Consequently, these results may not apply in other ecozones.
Here, we examine the short-term influence of wildlife-mitigated PCT (wmPCT) on songbirds and vegetation parameters to determine whether applied mitigation measures have the expected outcome. These treatments were compared with control stands and regular PCT under a Before-After-Control-Impact experimental design. We predicted that
12
the vegetation parameters and the presence of songbirds would differ between treated stands in regular PCT and wmPCT, with the latter being more similar to the control stands.
Methods
Study AreaThe study was conducted in southern Québec, Canada (Figure 1). Elevations in the region range from < 150 m to 916 m (CRÉ Chaudière-Appalaches, 2005). Average daily temperature near the centre of the study area (46°09'N, 70°42' W) is 4.2 °C, while annual precipitation includes 794 mm as rainfall and 195 cm of snowfall (Environment Canada, 2007). The study area extends through maple-yellow birch, maple-basswood, and fir-yellow birch bioclimatic domains (Robitaille & Saucier, 1998). The forest stands that were selected for the study had all been managed exclusively for timber production. They were dominated by white spruce (Picea glauca [Moench] Voss), black spruce (Picea mariana [Mill.] BSP), or balsam fir (Abies balsamea [L.] Mill.) on undifferentiated till deposits, with moderate to poor drainage, and originated from plantations or natural succession.
Experimental Design
A before-after-control-impact (BACI) (Smith et al., 1993) experimental design was used to assess the effectiveness of the wmPCT on vegetation properties and songbirds. BACI designs simultaneously account for unwanted spatial and temporal variation, thereby providing reliable inference about treatment effects (Rasmussen et al., 1993; Underwood, 1994). This type of design takes into account the particularities of each stand, for example, whether they were plantations or not. Our experimental design consisted of young stands (1.5 to 5 m high) subjected to two types of treatments: PCT vs wmPCT, together with control (untreated) stands. During the spring of 2009, we sampled a total of 56 stands: 20 PCT; 18 wmPCT; and 18 Control. Of these 56 stands, 46 % were plantations. We conducted thinning treatments during autumn and winter of 2010 and collected data in each of the 56 stands in the following two years (2011-2012).
13
Figure 1 Study area and locations of selected stands (source: Ministère des Forêts, de la Faune et des Parcs).
Precommercial Thinning
PCT was conducted in selected stands that had > 5000 commercial stems ha-1 and which were 1.5 to 5 m in height. Densities were reduced to 2500 stems ha-1 after thinning (for more details, see ARFPC, 2010). WmPCT was performed in young conifer stands that were 1.5 to 5 m tall, with > 7500 coniferous stems ha-1. Loggers were asked to retain thinned strips with a maximum 1 ha area, alternating with untreated areas with a minimum width of 50 m in regenerated stands. In plantations, they were asked to retain six to nine small and dispersed unthinned patches of at least 49 m2 ha-1. In thinned areas, trees and berry bushes were retained when they did not impede selected stems (e.g., less then 1/3 of selected stem height). Riparian areas and snags that posed no threat to workers were retained. Interventions were made after the third week of July, outside the nesting period of the birds (ARFPC & AMVAP, 2010).
14
Vegetation Sampling
We conducted vegetation surveys in 2009, 2011 and 2012 along 200 m of transects in each stand. Transects were uniformly distributed in the stand at least 50 m from edges and 30 m from one another. We estimated vertical cover of coniferous and deciduous trees with the line intersection method (Canfield, 1941) every 10 m along the transect in three height classes: 0.5-1 m; 1-4 m; and > 4 m. The presence of vertical cover was noted and means presence was calculated for each vertical cover class in each stand. We assessed lateral obstruction at six points along the transects with a 200 x 30 cm vertical profile board that was positioned at eye level 15 m from the observer (Nudds, 1977). We estimated the volume of woody debris > 9 cm in diameter per hectare with the intersection method (Canfield, 1941; Van Wagner, 1968; Bertrand & Potvin, 2003) along the 15 m line that was used to estimate lateral obstruction. Herbaceous and vegetation cover (< 0.6 m tall) were measured in 2009 and 2012 only. These variables were measured in six 4 m² plots distributed every 50 m along each transect for the following classes: herbaceous; raspberry-blackberry-currant; mosses; and deciduous, coniferous and Vaccinium. In three 400 m² plots, the diameter at breast height (dbh) and species of all trees were recorded. In the same plots and years, we counted and measured dbh and height, and determined snag decay classes (Tremblay et al., 2009). We measured height, condition, and age of five representative trees (dbh > 9 cm) in each plot. To be representative, the tree had to be a dominant or codominant individual and one of the main commercial species in the plot. Finally, we counted and identified saplings (> 0.6 m height, dbh < 9 cm) in three 40 m² plots. Variables that were measured in 2011 were those most likely to have an impact after treatment and to be important for the tree species. Those measured in 2012 were related mainly to vegetation growth following treatment. Also, we did not have sufficient financial resources to conduct a complete survey of vegetation the two years following treatment.
Songbird Sampling
We conducted three bird point counts per nesting season in each stand in 2009, 2011 and 2012, between mid-May and early July. No count was made under windy (> 15 km/h) or rainy conditions. Each point count was performed simultaneously by two experienced observers between 6h00 and 10h00, at a predetermined GPS position that was located in the centre of the selected stand. After one minute of silence, each observer recorded all birds
15
that were seen or heard < 50 m from the observer for 10 minutes (Buskirk & McDonald, 1995; Dunn et al., 2006). We rotated observers (six each year) through the stands between visits to reduce bias (Campbell & Francis, 2011). We measured wind speed and precipitation at each point count. After the 10-min passive count, we broadcasted song recordings of six selected species in the following sequence: Canada Warbler (Cardellina canadensis), Brown Creeper (Certhia americana), Red-breasted Nuthatch (Sitta canadensis), Black-backed Woodpecker (Picoides arcticus), Yellow-bellied Sapsucker (Sphyrapicus varius), and Pileated Woodpecker (Dryocopus pileatus). These species were selected because they are threatened (i.e., Canada Warbler, (COSEWIC, 2008)) or are associated with snags and dead wood, which are often limited attributes in managed forest (i.e., the other five species (Darveau & Desrochers, 2001)). Vocalizations were played at maximum volume from a 5 W amplifier for 30 seconds, with intervening 30 second periods of silence to facilitate detection. Finally, a 5-min playback of Black-capped Chickadee (Poecile atricapillus) and Red-breasted Nuthatch (Sitta canadensis) mobbing calls was played, again to facilitate detection (Gunn et al., 2000).
Data Analysis
We used GLMMs (Generalized Linear Mixed Models) to assess the effects of treatment, year and their interaction on each vegetation parameter, with stand as a random effect (proc GLIMMIX, (SAS Institute, 2010)) for one year and two years after treatment. We set overall Type I error at α = 0.05. We used a GLMM to assess the effect of PCT and wmPCT on the occurrence of each of the species that were observed in > 5 % of the individual point counts. For each visit, data from the two observers were combined and converted to “presence” (if recorded at least once by at least one observer), or “absence” (when the species was not recorded by either observer). We modelled the ratio of occurrences/visit for each stand in each year, with occurrences as Bernoulli events that were weighted by the number of visits. All species that had been observed during the study were assigned to nesting and foraging guilds (Gauthier & Aubry, 1995; Poole, 2005). Guild analyses allowed us to include species that were observed in < 5 % of the point counts. We modelled treatment, year and their interaction as fixed effects, and stand as a random effect. We performed statistical analyses with the Glimmix procedure (SAS Institute (2010)) for one year and two years after treatment (see Appendix 3). GLMMs do not take imperfect
16
detection into account; in addition to GLMM, we also used occupancy modelling (MacKenzie et al., 2003) on the same species to assess treat effects on colonization, extinction and detection processes (package unmarked, (Fiske & Chandler, 2011; R Development Core Team, 2014). We have taken into account the effects of precipitation, Julian day and wind as covariates for detection (see Appendix 4). However, occupancy models do not easily allow the use of random effects and, thus, do not fully account for the BACI design, at least within a frequentist framework. This is why we decided to use GLMM and occupancy as complementary approaches. We set overall Type I error at α = 0.05; because of the large number of tests that were performed, we used Bonferroni corrections (Peres-Neto, 1999). We conducted separate power analyses for single species and guilds, based on the assumption that the respective probabilities of occurrence and abundances changed by a factor of two between control and thinned sites. We ran 1,000 simulations using the same fixed and random effects on the actual data, but using simulated Bernoulli trials and Poisson counts that varied by a factor of two around population means (p = 0.236 for individual species, λ = 5.95 for guild abundances). We based power analysis simulations on reruns of the function glmer() from the R package lme4 (Bates et al., 2014; R Development Core Team, 2014), see Appendix 5).
17
Results
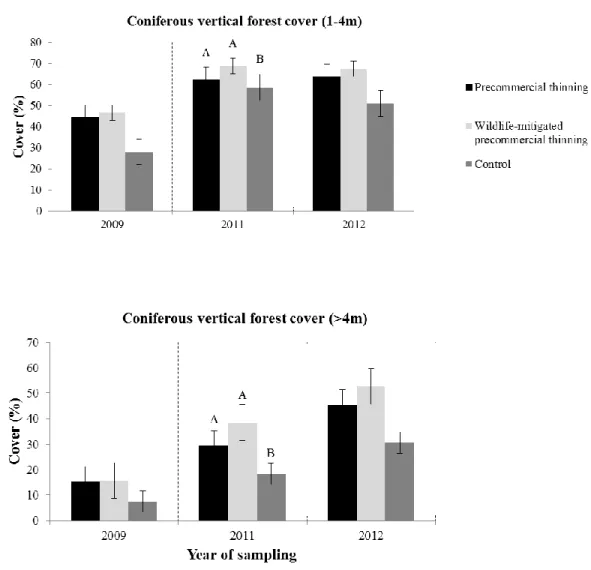
Vegetation
Vegetation parameters varied greatly among plots (Table 1). One year after treatment, thinning affected coniferous vertical cover in the 1-4 m and > 4 m height classes (Table 2). At one to four metres from the ground, coniferous vertical cover was greater in both types of thinned stands compared to controls (Figure 2). Conversely, vertical cover of conifers > 4 m in height was lower in both types of thinned stands compared to the controls (Figure 2). Coniferous vertical cover at 0.5-1 m height and deciduous vertical cover in 0.5-1 m, 1-4 m, and > 4 m height classes did not significantly differ after thinning within given plots.
18
Figure 2. Coniferous vertical forest cover changes (± standard error) between treatments, among years. The vertical dashed line represents the year in which there were treatments. Different letters over the bars indicate significant differences at P < 0.05. Note that the bars represent a “cross-section” of treatments across plots and, therefore, do not capture random effects caused by initial plot differences (as opposed to other statistical analyses presented elsewhere in the text).
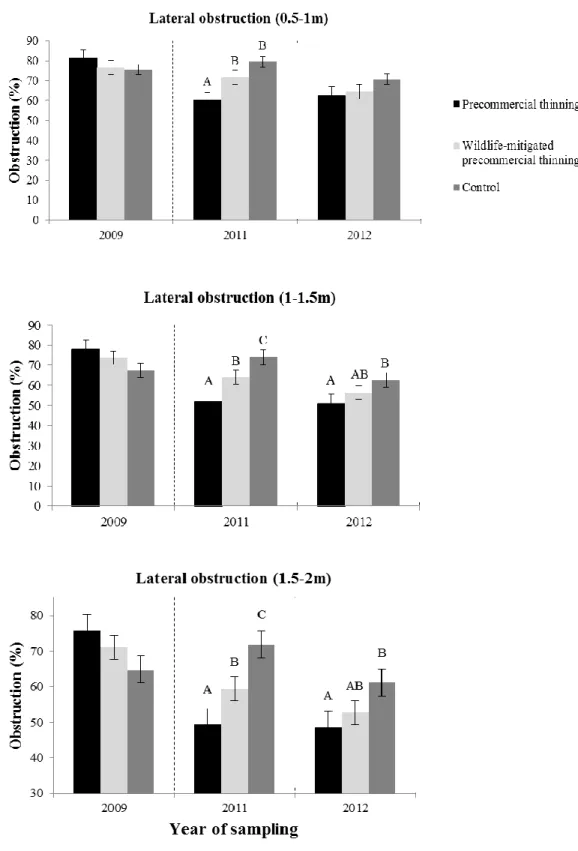
We found no evidence for thinning effects on lateral obstruction at 0-0.5 m height, but obstruction was greater at 0.5-1 m in stands that were treated with wmPCT than in stands treated with PCT, and lower in stands treated with PCT than in the controls (Figure 3, Table 2). WmPCT stands had greater lateral obstruction in the 1-1.5 m and 1.5-2 m height classes than PCT stands. Both thinned stand types had lower obstruction than the controls.
19
Two years after treatment, lateral cover for the 0.5-1 height class significantly differed for deciduous stems (Figure 3, Table 2). Within this height class, stands treated with wmPCT were greater than stands treated with PCT, while the latter were lower than the controls. Lateral obstruction responded to treatment only in the 1-1.5 m and 1.5-2 m height classes, with lower obstruction in PCT stands than in controls (Figure 3, Table 2). For both years following treatment, we found no thinning effects on woody debris volume of per hectare, herbaceous or shrub cover, deciduous and coniferous sapling numbers, and the number of snags per hectare.
20
Figure 3. Lateral obstruction changes (± standard error) between treatments, among years. The vertical dashed line represents the year in which treatments were applied. Different letters over the bars indicate significant differences within year, at P < 0.05. Note that bars represent a “cross-section” of treatments across plots and, therefore, do not capture random effects (compared with other statistical analyses presented elsewhere in the text).
21
Table 1. Characteristics (mean (SD)) of vegetation Parameters in Precommercial Thinning, Wildlife-Mitigated Precommercial Thinning and Control, before and after treatment.
Variable
Precommercial thinning Wildlife-mitigated precommercial thinning Control Before One year after Two years
after Before One year After Two years after Before One year After Two years after vertical cover > 4 m deciduous trees 22.19 (20.14) 10.91 (15.21) 10.91 (20.19) 14.97 (20.06) 16.41 (20.16) 30.05 (26.09) 21.97 (26.65) 36.11 (29.35) 38.89 (31.15) coniferous trees 15.27 (13.71) 29.32 (26.48) 45.23 (34.22) 15.61 (15.94) 38.38 (29.51) 52.53 (34.62) 7.32 (13.33) 18.18 (17.64) 30.56 (23.58) Total 35.15 (21.90) 38.41 (27.09) 52.96 (35.31) 26.84 (26.71) 49.49 (30.67) 62.37 (30.86) 27.78 (28.62) 50.25 (29.02) 58.59 (28.27) vertical cover 1-4 m deciduous trees 35.48 (25.29) 23.64 (23.58) 23.64 (26.39) 30.53 (22.20) 32.32 (24.79) 40.66 (25.40) 39.65 (22.53) 61.11 (19.17) 53.03 (28.19) coniferous trees 44.21 (25.57) 62.27 (16.12) 63.64 (27.28) 46.58 (25.57) 68.69 (16.12) 67.42 (27.28) 27.78 (25.94) 58.59 (21.48) 51.01 (23.78) Total 68.32 (18.24) 74.09 (18.72) 72.27 (29.23) 65.29 (19.60) 81.57 (12.71) 81.31 (19.02) 55.56 (23.42) 85.86 (8.23) 73.74 (26.48) vertical cover 0.5-1 m deciduous trees 15.70 (12.46) 28.64 (22.95) 48.41 (21.39) 13.72 (13.45) 29.55 (24.56) 44.95 (25.52) 23.74 (14.50) 34.34 (20.64) 34.34 (18.53) coniferous trees 31.19 (12.84) 26.14 (15.53) 36.14 (27.69) 34.52 (19.12) 30.05 (22.76) 39.65 (24.89) 22.22 (19.90) 39.90 (18.55) 30.30 (23.49) Total 44.62 (14.87) 47.05 (26.14) 69.55 (20.65) 44.41 (17.95) 46.21 (29.55) 72.22 (19.53) 41.67 (15.61) 61.87 (22.55) 56.31 (26.51) lateral obstruction 0-0,5 m 85.42 (6.86) 79.75 (11.92) 82.42 (9.07) 85.19 (8.87) 78.52 (13.93) 76.78 (14.66) 82.04 (12.99) 84.72 (6.62) 81.67 (12.33) 0,5-1,0 m 81.42 (7.52) 60.17 (18.10) 62.67 (19.38) 76.57 (12.29) 71.76 (16.90) 64.46 (15.34) 75.46 (15.37) 79.44 (11.01) 70.56 (18.40) 1,0-1,5 m 77.92 (7.43) 51.83 (20.37) 51.08 (21.93) 73.70 (12.05) 64.07 (16.01) 56.46 (14.85) 67.31 (16.22) 73.89 (14.29) 62.59 (24.23) 1,5-2,0 m 75.92 (9.79) 49.50 (20.00) 48.67 (21.00) 71.02 (14.22) 59.44 (13.06) 52.74 (15.45) 64.81 (16.78) 71.76 (15.46) 61.11 (22.61) low vegetation cover
deciduous 5.35 (5.42) 12.28 (14.46) 4.17 (3.31) 10.74 (10.29) 4.85 (4.44) 9.51 (7.79) coniferous 2.05 (2.10) 4.09 (5.26) 2.61 (2.64) 2.60 (1.99) 1.94 (2.21) 2.02 (1.88)
Vaccinium 4.44 (6.36) 2.68 (5.45) 3.45 (5.87) 3.02 (5.82) 1.40 (2.23) 1.24 (2.15) herbaceous 54.83 (17.47) 62.36 (18.12) 57.87 (16.54) 59.98 (19.02) 56.71 (17.09) 59.82 (22.96)
22 raspberry-blackberry-currant 9.54 (13.80) 8.19 (10.26) 7.31 (13.90) 4.06 (4.72) 9.89 (9.52) 5.59 (7.26) mosses 30.39 (21.95) 30.41 (19.91) 32.29 (23.92) 29.93 (18.96) 17.43 (14.82) 24.83 (19.49) Total 9.96 (10.61) 15.38 (16.28) 10.00 (12.26) 12.45 (11.44) 7.28 (6.27) 10.63 (9.32) Trees ha-1 deciduous 51 (76) 59 (114) 35 (60) 49 (76) 66 (93) 136 (164) coniferous 349 (381) 534 (397) 301 (379) 610 (535) 181 (249) 345 (341) Total 404 (385) 598 (401) 346 (386) 663 (530) 259 (268) 484 (347) saplings ha-1 deciduous 34900 (21672) 26938 (19464) 45118 (32415) 21750 (19276) 68458 (54361) 34903 (26262) coniferous 38738 (37633) 27138 (29947) 35029 (28098) 24653 (19356) 44528 (66657) 55583 (128934) Total 73763 (43593) 54400 (25263) 80265 (38479) 46681 (25311) 113097 (79773) 90639 (122007) volume of woody debris ha-1 13 (21) 44 (132) 76 (104) 18 (26) 44 (109) 30 (28) 13 (11) 77 (159) 70 (78)
23
Table 2. Significance tests (P) and Estimates of Generalized Linear Mixed Models of the Effects of Precommercial Thinning (PCT) and Wildlife-Mitigated PCT (wmPCT) on Vegetation Parameters.
Variables
One year after treatment Two years after treatment treat*year wmPCT vs PCT
wmPCT vs
control PCT vs Control treat*year wmPCT vs PCT
wmPCT vs
Control PCT vs Control
P P Estimate P Estimate P Estimate P P Estimate P Estimate P Estimate
Deciduous vertical forest cover (0.5-1m) 0.08 0.002 0.0009 29.62 0.5 0.008 -37.91 Coniferous vertical forest cover (1-4m) 0.02 0.8 0.03 13.65 0.01 21.22 0.07 Coniferous vertical forest cover (>4m) 0.02 0.8 0.01 -9.85 0.02 -13.76 0.3 Lateral obstruction (0.5-1m) 0.0008 0.02 11.59 0.10 0.0008 -19.28 0.1 Lateral obstruction (1-1.5m) < 0.0001 0.01 12.24 0.04 -9.81 < 0.0001 -22.06 0.03 0.1 0.3 0.01 -11.51 Lateral obstruction (1.5-2m) < 0.0001 0.01 9.94 0.03 -12.31 < 0.0001 -22.26 0.02 0.2 0.1 0.005 -12.44
24
Songbirds
We observed 88 species, including 39 reported in >5% of the point counts (Appendix 6). The most common species were the White-throated Sparrow, Magnolia Warbler (Setophaga magnolia), Nashville Warbler (Oreothlypis ruficapilla), and the Ruby-crowned Kinglet (Regulus calendula). See Table 3 for the ratio of occurrences/visit for each of these species. We found no evidence for significant changes in species composition as a result of PCT and wmPCT treatments for the GLMM or the occupancy models when the sequential Bonferroni method was applied. Statistical power of single-species models, with changes in occupancy by a factor of two, was low (1 – β = 0.51).
25
Table 3. Ratios of Occurrences/Visit (mean (SD)) of song birds in Precommercial Thinning, Wildlife-Mitigated Precommercial Thinning and Control, before and after treatment. Only species reported in > 5 % of points counts are shown.
Scientific Name
Precommercial thinning Wildlife-mitigated precommercial thinning Control Before One year after
Two years
after Before One year after
Two years
after Before One year after
Two years after Bombycilla cedrorum 0.03 (0.10) 0.03 (0.10) 0.08 (0.15) 0.04 (0.11) 0.09 (0.19) 0.09 (0.19) 0.03 (0.10) 0.07 (0.14) 0.09 (0.15) Bonasa umbellus 0.08 (0.13) 0.15 (0.17) 0.00 (0.00) 0.11 (0.19) 0.06 (0.13) 0.00 (0.00) 0.08 (0.16) 0.11 (0.16) 0.04 (0.11) Cardellina canadensis 0.28 (0.31) 0.12 (0.26) 0.22 (0.29) 0.23 (0.28) 0.16 (0.25) 0.19 (0.35) 0.24 (0.24) 0.23 (0.29) 0.32 (0.42) Carpodacus purpureus 0.15 (0.24) 0.10 (0.19) 0.29 (0.31) 0.11 (0.16) 0.09 (0.15) 0.11 (0.16) 0.06 (0.19) 0.07 (0.18) 0.06 (0.13) Catharus fuscescens 0.25 (0.33) 0.21 (0.23) 0.15 (0.30) 0.11 (0.22) 0.25 (0.36) 0.27 (0.38) 0.13 (0.23) 0.32 (0.32) 0.33 (0.34) Catharus guttatus 0.15 (0.22) 0.31 (0.28) 0.38 (0.29) 0.11 (0.16) 0.43 (0.38) 0.43 (0.41) 0.16 (0.22) 0.37 (0.34) 0.33 (0.38) Catharus ustulatus 0.40 (0.35) 0.32 (0.31) 0.33 (0.37) 0.35 (0.38) 0.26 (0.35) 0.43 (0.45) 0.17 (0.29) 0.17 (0.21) 0.19 (0.33) Colaptes auratus 0.10 (0.18) 0.08 (0.15) 0.11 (0.23) 0.04 (0.19) 0.15 (0.15) 0.13 (0.23) 0.09 (0.19) 0.09 (0.15) 0.11 (0.23) Corvus brachyrhynchos 0.13 (0.20) 0.15 (0.26) 0.20 (0.27) 0.16 (0.23) 0.24 (0.32) 0.15 (0.21) 0.09 (0.19) 0.19 (0.21) 0.14 (0.18) Cyanocitta cristata 0.17 (0.18) 0.21 (0.25) 0.26 (0.34) 0.19 (0.31) 0.22 (0.26) 0.27 (0.30) 0.26 (0.20) 0.20 (0.28) 0.24 (0.29) Empidonax alnorum 0.34 (0.35) 0.27 (0.33) 0.25 (0.32) 0.28 (0.36) 0.30 (0.37) 0.30 (0.39) 0.35 (0.38) 0.33 (0.34) 0.32 (0.35) Empidonax minimus 0.05 (0.14) 0.08 (0.17) 0.10 (0.19) 0.07 (0.18) 0.02 (0.08) 0.05 (0.14) 0.02 (0.08) 0.04 (0.11) 0.00 (0.00) Geothlypis trichas 0.30 (0.38) 0.48 (0.40) 0.41 (0.43) 0.31 (0.32) 0.44 (0.42) 0.55 (0.43) 0.29 (0.34) 0.49 (0.43) 0.36 (0.35) Junco hyemalis 0.03 (0.15) 0.22 (0.27) 0.18 (0.26) 0.06 (0.13) 0.28 (0.35) 0.13 (0.26) 0.08 (0.20) 0.19 (0.31) 0.04 (0.11) Mniotilta varia 0.31 (0.30) 0.33 (0.25) 0.33 (0.35) 0.17 (0.29) 0.25 (0.26) 0.36 (0.33) 0.17 (0.24) 0.58 (0.39) 0.40 (0.34) Oreothlypis ruficapilla 0.62 (0.37) 0.68 (0.37) 0.58 (0.44) 0.50 (0.25) 0.69 (0.26) 0.53 (0.41) 0.50 (0.40) 0.67 (0.30) 0.38 (0.32) Parkesia noveboracensis 0.02 (0.07) 0.08 (0.16) 0.02 (0.07) 0.11 (0.22) 0.10 (0.26) 0.06 (0.24) 0.02 (0.08) 0.09 (0.15) 0.09 (0.18) Passerella iliaca 0.09 (0.19) 0.03 (0.15) 0.05 (0.12) 0.06 (0.17) 0.07 (0.14) 0.02 (0.08) 0.03 (0.10) 0.04 (0.11) 0.11 (0.28) Pheucticus ludovicianus 0.11 (0.20) 0.02 (0.07) 0.12 (0.25) 0.06 (0.15) 0.00 (0.00) 0.06 (0.15) 0.06 (0.13) 0.02 (0.08) 0.22 (0.40) Poecile atricapillus 0.13 (0.15) 0.50 (0.34) 0.43 (0.34) 0.28 (0.27) 0.43 (0.39) 0.51 (0.36) 0.16 (0.23) 0.44 (0.34) 0.53 (0.33) Regulus calendula 0.58 (0.36) 0.42 (0.34) 0.46 (0.41) 0.43 (0.32) 0.37 (0.39) 0.24 (0.39) 0.35 (0.30) 0.24 (0.30) 0.25 (0.27) Regulus satrapa 0.13 (0.20) 0.37 (0.37) 0.23 (0.28) 0.09 (0.15) 0.26 (0.33) 0.20 (0.33) 0.06 (0.24) 0.13 (0.20) 0.10 (0.17) Seiurus aurocapilla 0.11 (0.20) 0.25 (0.30) 0.11 (0.20) 0.19 (0.21) 0.26 (0.37) 0.22 (0.36) 0.15 (0.29) 0.17 (0.26) 0.08 (0.20) Setophaga caerulescens 0.05 (0.16) 0.10 (0.18) 0.03 (0.10) 0.02 (0.08) 0.14 (0.22) 0.04 (0.11) 0.04 (0.11) 0.23 (0.33) 0.06 (0.17)
26 Setophaga castanea 0.03 (0.09) 0.12 (0.27) 0.18 (0.28) 0.04 (0.11) 0.09 (0.19) 0.04 (0.11) 0.02 (0.08) 0.12 (0.27) 0.13 (0.28) Setophaga coronata 0.14 (0.19) 0.45 (0.36) 0.54 (0.39) 0.10 (0.17) 0.37 (0.39) 0.44 (0.30) 0.15 (0.21) 0.31 (0.20) 0.44 (0.37) Setophaga magnolia 0.65 (0.28) 0.64 (0.33) 0.73 (0.28) 0.62 (0.30) 0.80 (0.23) 0.82 (0.25) 0.65 (0.28) 0.89 (0.20) 0.84 (0.22) Setophaga pensylvanica 0.17 (0.31) 0.22 (0.34) 0.28 (0.42) 0.10 (0.21) 0.32 (0.37) 0.15 (0.29) 0.21 (0.28) 0.51 (0.36) 0.25 (0.34) Setophaga ruticilla 0.21 (0.31) 0.08 (0.19) 0.27 (0.31) 0.20 (0.22) 0.14 (0.27) 0.32 (0.37) 0.08 (0.19) 0.20 (0.26) 0.28 (0.39) Setophaga striata 0.12 (0.31) 0.07 (0.17) 0.07 (0.23) 0.05 (0.14) 0.09 (0.22) 0.04 (0.16) 0.04 (0.11) 0.11 (0.23) 0.13 (0.33) Setophaga virens 0.28 (0.32) 0.44 (0.41) 0.29 (0.33) 0.24 (0.31) 0.44 (0.41) 0.32 (0.35) 0.26 (0.35) 0.40 (0.33) 0.36 (0.33) Sitta canadensis 0.05 (0.14) 0.15 (0.23) 0.43 (0.27) 0.09 (0.19) 0.24 (0.28) 0.52 (0.33) 0.09 (0.15) 0.15 (0.23) 0.39 (0.23) Sphyrapicus varius 0.04 (0.10) 0.13 (0.23) 0.09 (0.17) 0.07 (0.22) 0.13 (0.20) 0.11 (0.16) 0.04 (0.16) 0.15 (0.21) 0.10 (0.17) Spinus tristis 0.09 (0.23) 0.03 (0.15) 0.07 (0.23) 0.13 (0.23) 0.13 (0.33) 0.24 (0.36) 0.03 (0.10) 0.06 (0.17) 0.06 (0.13) Troglodytes hiemalis 0.12 (0.20) 0.50 (0.38) 0.15 (0.30) 0.16 (0.29) 0.26 (0.29) 0.26 (0.37) 0.09 (0.16) 0.17 (0.26) 0.20 (0.31) Turdus migratorius 0.31 (0.30) 0.57 (0.36) 0.42 (0.36) 0.44 (0.34) 0.56 (0.36) 0.35 (0.24) 0.26 (0.32) 0.59 (0.33) 0.39 (0.32) Vireo olivaceus 0.42 (0.40) 0.09 (0.19) 0.41 (0.35) 0.25 (0.25) 0.18 (0.22) 0.34 (0.33) 0.35 (0.33) 0.16 (0.18) 0.41 (0.41) Vireo solitarius 0.04 (0.12) 0.15 (0.27) 0.11 (0.26) 0.12 (0.21) 0.03 (0.12) 0.06 (0.17) 0.10 (0.20) 0.08 (0.16) 0.06 (0.15) Zonotrichia albicollis 0.82 (0.27) 0.92 (0.15) 0.97 (0.10) 0.73 (0.26) 0.87 (0.23) 0.89 (0.23) 0.71 (0.24) 0.87 (0.33) 0.88 (0.23)
27
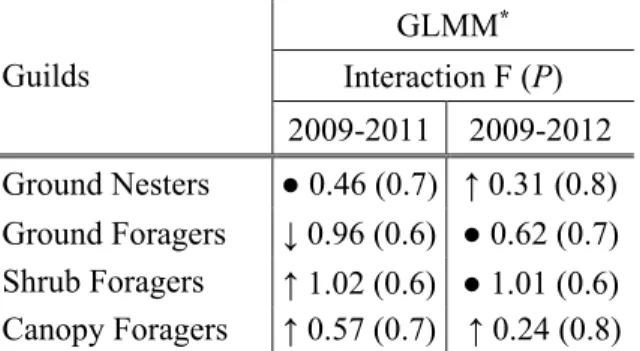
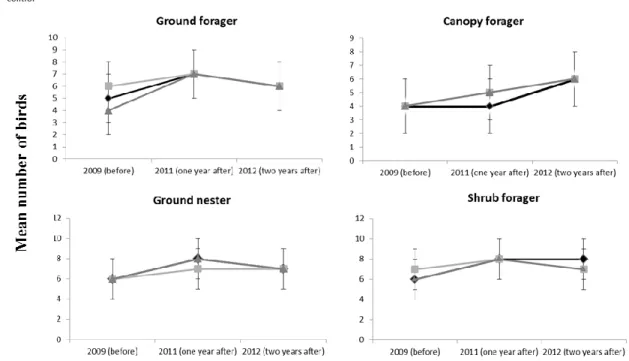
In the guild analyses, we also found no evidence of changes among nesting and foraging guild as a result of PCT and wmPCT treatments (See table 4 for the occurrence of nesting and foraging guilds, table 5 for the estimates of the GLMM and figure 4). Statistical power for detecting increases or decreases of guild abundances by a factor of two was high (1 – β = 0.999).
Table 4. Occurrences (mean (SD)) of nesting and foraging guilds in Precommercial
Thinning, Wildlife-Mitigated Precommercial Thinning and Control, before (2009) and after (2011 and 2012) treatment.
Guilds Precommercial thinning
wildlife-mitigated
precommercial thinning Control
2009 2011 2012 2009 2011 2012 2009 2011 2012 Ground Nesters 6 (2) 8 (2) 7 (1) 6 (2) 7 (2) 7 (1) 6 (2) 8 (2) 7 (3) Ground Foragers 5 (2) 7 (2) 6 (1) 6 (2) 7 (2) 6 (2) 4 (2) 7 (2) 6 (2) Shrub Foragers 6 (2) 8 (2) 8 (2) 7 (2) 8 (2) 7 (1) 6 (2) 8 (1) 7 (2) Canopy Foragers 4 (2) 4 (2) 6 (2) 4 (2) 5 (1) 6 (2) 4 (2) 5 (2) 6 (2)
Table 5. Generalized Linear Mixed Model estimates for the year * treatment interaction on nesting and foraging guilds. Treatments were precommercial thinning, wildlife-mitigated precommercial thinning and control.
Guilds GLMM* Interaction F (P) 2009-2011 2009-2012 Ground Nesters ● 0.46 (0.7) ↑ 0.31 (0.8) Ground Foragers ↓ 0.96 (0.6) ● 0.62 (0.7) Shrub Foragers ↑ 1.02 (0.6) ● 1.01 (0.6) Canopy Foragers ↑ 0.57 (0.7) ↑ 0.24 (0.8)
*Changes, significant or not, are indicated by arrows. Up arrows indicate cases where the control had the largest increase (or smaller decrease), down arrows indicate cases where the control had the largest decrease (or smaller increase), and cases where the control was intermediate were denoted with a point.
28
Figure 4. Mean number of birds (SD) reported in responses to Precommercial Thinning, Wildlife-Mitigated Precommercial Thinning and Control, before and after treatment.
29
Discussion
Precommercial thinning and mitigation measures that were designed for this study induced only subtle changes in vegetation parameters, and no change for the study guilds of forest songbirds. Of all vegetation parameters, only lateral obstruction and vertical forest cover changed significantly in response to treatment.
Vegetation
One year after treatment, lateral obstruction in the 0.5-2 m height class was lower. Similar results have been observed by Homyack et al. (2004), Blanchette et al. (2003), and Bujold (2004). It is noteworthy that mitigation measures were effective for this aspect of the vegetation: WmPCT lateral obstruction was intermediate in comparison to control stands and PCT stands. PCT lateral obstruction was lower than that of WmPCT. This result can be attributed to complete elimination by regular precommercial thinning of crop tree competitors in a given radius throughout the stand. In contrast, WmPCTs comprise thinned areas and untreated areas, and some plant species are purposefully not thinned. Therefore, lateral obstruction was greater than in PCT stands. However, two years after treatment, only PCTs exhibited lateral obstruction lower than control stands, which Blanchette et al. (2003) also observed. The effect of WmPCT on lateral obstruction appeared to be short-lived. The growth peak in WmPCT could have been caused by stool shoots and unthinned species, which eventually benefitted from increased light inputs that resulted from the selective thinning (Pothier & Margolis, 1991).
Effects of mitigation measures were observed on vertical forest cover, particularly for conifers, but only during the first year after treatment. Vertical cover was greater than the control stands for the shrub class (1-4 m) in both types of treatments. Yet, WmPCT and PCT results that pertained to conifers were similar, and contrast with those of Homyack et al. (2004) and Blanchette et al. (2003), where significant coniferous vertical forest greater forest cover is an unexpected result. Conifers that were < 1 m tall may hypothetically benefit from higher light inputs following clearance of the tree cover (Pothier & Margolis, 1991). Therefore, shrub cover growth may have been more rapid than in control stands to have reached 1 m height one year after thinning. In the tree class (> 4 m), cover diminished
30
on all treated sites, again with no major differences between the two treatment types. The study results concur with those of Blanchette et al. (2003) and Bujold (2004). In the latter studies, forest cover remained lower in treated stands than controls in the second year, whereas our study noted no differences. Regional context likely explains why more rapid cover growth was observed. In Chaudière-Appalaches, growth can be faster than in Capitale-Nationale, Abitibi-Témiscamingue and Nord-du-Québec regions. Several factors may affect PCT effects on vegetation, such as growth season, stand age, thinning density, the species that are present, and site quality (Cole et al., 2010).
Songbirds
Guild-level analyses had very high statistical power, which enabled us to infer that there was no significant impact of thinning on guild structure for the two years after treatment. Grouping bird species into guilds, therefore, is an interesting alternative approach that would avoid the use of a large and costly number of replicates, which would be required in the study of a single species. Due to its low power, i.e., a high probability of Type II error, the current study cannot infer a lack of treatment response for individual species. Even though we specifically designed the study to test for silvicultural impacts on the reporting rates of songbirds, larger sample sizes would be required to measure whether significant impacts on single species actually occur. Other studies on short-term impacts of regular precommercial thinning on birds offer comparison to the current study (Woodcock et al., 1997; Sansregret, 2000; Chisholm & Leonard, 2008), but did not evaluate statistical power. Insufficient replication in previous studies on the effects of silvicultural practices on bird populations seems to be a recurring problem in the literature (Sallabanks et al., 2000). This study and Woodcock et al. (1997) agree in that treatments resulted no major modification in bird species composition. Yet Sansregret (2000) found that after PCT or WmPCT, songbird species in open habitats increased in abundance, while species that were associated with a more developed shrub layer declined. It should be noted that, unlike the present study, the treatments that were studied by Sansregret radically changed stand structure while reducing stand density, which may explain our contrasting results. As Woodcock et al. (1997) observed, the presence of untreated vegetation patches in most treatments helped maintain the diversity of the avian community. However, there was
31
considerable variation in partial harvesting levels at which individual species were expected to exhibit a reduction in abundance (Vanderwel et al., 2007).
Experimental design and analysis
Studies of timber harvesting effects on bird populations rarely incorporate experimental treatments that provide pre- and post-timber harvest comparisons (Sallabanks et al., 2000). The BACI experimental design used in this study took into account pre- and post-timber harvest comparisons and the characteristics of each stand (Rasmussen et al., 1993; Underwood, 1994). The use of BACI experimental design, good regional coverage, and more replicates than in the other studies on the subject are advantages of this study. Given that another part of this study, which focused on snowshoe hare (Lepus americanus), showed a response to thinning (ARFPC & MDDEFP, 2013), we know that silvicultural treatments implemented in this study were strong enough to influence the fewest species that rely upon specific vegetation attributes that are targeted by thinning.
It should be further emphasized that this study used two statistical approaches (GLMM and Occupancy Model) to assess the consistency of estimated responses. Generally, inconsistent results that are based on GLMM and occupancy approaches are a significant concern, given that different conclusions could be drawn if one type of analysis or another is used. We encourage further comparisons between the two statistical approaches to understand how robust species response estimates to silvicultural treatments are to assumptions of GLMM vs. Occupancy Model approaches.
Publication bias should be considered when studies observe significant changes, because these may lead to an exaggerated perception of PCT effects on wildlife and vegetation (Møller & Jennions, 2001). Available evidence suggests that studies with non-significant effects are encountered less frequently than are studies with significant effects. This imbalance affects our ability to retrieve information on completed studies and provide an appropriate review for a given field of research (Møller & Jennions, 2001). Another factor that could explain the contrasting results is that other studies on PCT have been conducted in contrasting geographical locations, ranging from Sweden (Fahlvik et al., 2005) to the USA (Homyack, 2003; Griffin & Mills, 2007; Cole et al., 2010) and throughout Canada