OATAO is an open access repository that collects the work of Toulouse researchers and makes it freely available over the web where possible
Any correspondence concerning this service should be sent
to the repository administrator: [email protected]
This is an author’s version published in:
http://oatao.univ-toulouse.fr/21401
To cite this version:
Lacaze, Jacques and Thebault, Yannick and Freulon, Alexandre and Guesser, Wilson Luiz Effect of Cooling Rate on the Eutectoid Transformation in Compacted
Graphite Cast Iron. (2018) Materials Science Forum, 925. 12-19. ISSN 1662-9752
Effect of Cooling Rate on the Eutectoid Transformation
in Compacted Graphite Cast Iron
Jacques Lacaze
1,a*, Yannick Thébault
1,b, Alexandre Freulon
1,cand Wilson Luiz Guesser
2,d,c1CIRIMAT, Université de Toulouse, Toulouse, France 2Tupy and UDESC, Joinville, Brazil
a[email protected], b[email protected], c[email protected], d[email protected]
Keywords: compacted graphite cast iron, eutectoid transformation, graphite shape.
Abstract. Differential thermal analysis has been used to characterize the effect of cooling rate on the eutectoid transformation of a compacted graphite iron. The samples were machined out from an as-cast thermal cup, austenitized at 950°C and then cooled to room temperature at various rates within the range 1−55.5°C/min. It was found that even at the highest investigated cooling rate, significant amounts of ferrite could be observed. When comparing the microstructure before and after Nital etching on samples cooled at intermediate cooling rates, it appeared that ferrite formed preferentially along the worms. This is discussed in terms of graphite shape and microsegregation and this latter seems prevalent. Finally, analysis of the thermal records was performed to characterize the temperatures for the start of the stable and metastable eutectoid reactions which confirms the eutectoid transformation sets up in compacted graphite irons as in lamellar and spheroidal graphite irons.
Introduction
As is the case of other graphitic cast irons, the mechanical properties of compacted graphite irons (CGI) depend on their microstructure, i.e. graphite shape and matrix constituents. As for other irons, graphite shape in CGI is determined during solidification and has been the subject of numerous works which have been reviewed by König [1] and Gorny [2]. On the contrary, not so many studies investigated the eutectoid transformation that determines the final matrix microstructure.
It is however well accepted that ferrite grows much more easily in compacted graphite irons when compared to lamellar graphite irons (LGI) and spheroidal graphite irons (SGI). This has long been related to the fact that graphite precipitates in CGI present much more prismatic planes facing the matrix than do LGI and SGI [3].
Growth conditions of ferrite during the eutectoid transformation of SGI have been clarified for long as recently reviewed [4]. Analysis of experimental literature data confirms that, upon continuous cooling, ferrite grows only when the temperature of the material has decreased below the three-phase austenite-ferrite-graphite temperature range given by the relevant equilibrium phase diagram [5]. This approach has been extended to LGI though very little experimental results are available in this case [6], and it was postulated it should apply to CGI as well. The present work was intended to check this assumption by means of differential thermal analysis of a standard CGI submitted to reaustenitizing and cooling at various rates.
Experimental Details
The alloy used for this investigation was cast in a thermal analysis (TA) cup (QC 4010 from Heraus Electro Nite) which was withdrawn from the apparatus at 1000°C and air cooled. This alloy had the composition listed in Table 1. All analyzed elements appear in this table, and it was found that the
aluminum content was lower than the detection limit. The alloy carbon equivalent CE was 4.31 when calculated as:
CE = %C + 0.31·%Si − 0.027·%Mn + 0.076·%Cu + 0.33·%P + 0.4·%S. (1) where %i is the mass percent content of the alloy in element i.
Table 1 – Composition (mass.%) of the investigated alloy.
C Si Mn P S Cu
3.53 2.34 0.34 0.023 0.0009 0.72
Ti Sn Mg Al Sb Fe
0.008 0.083 0.014 <0.005 0.0007 balance
For differential thermal analysis (DTA), cylindrical samples 3.8 mm in diameter and 4-5 mm in height were cut out from a vertical central section of the cup. DTA was carried out using a SETARAM SETSYS 16/18 apparatus. The experiments were performed under a constant and low flow of argon and consisted in heating to 950°C, holding for 30 minutes, and finally cooling to room temperature. The various heating and cooling rates used in the present work are listed in Table 2. The maximum achievable cooling rate was 55.5°C/min as measured just before the eutectoid transformation started.
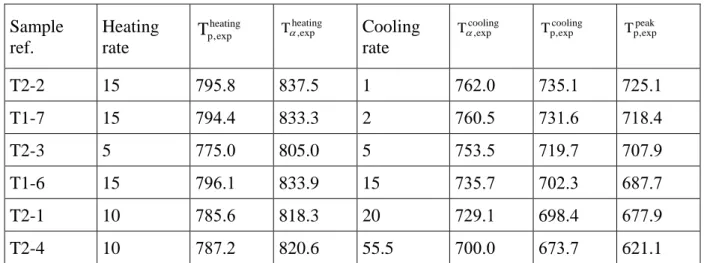
Table 2 – Samples' reference, heating and cooling rates (°C/min), and observed characteristic temperatures (°C).
Sample ref. Heating rate heating exp , p
T Taheating,exp Cooling
rate
cooling exp ,
Ta Tpcooling,exp Tppeak,exp
T2-2 15 795.8 837.5 1 762.0 735.1 725.1 T1-7 15 794.4 833.3 2 760.5 731.6 718.4 T2-3 5 775.0 805.0 5 753.5 719.7 707.9 T1-6 15 796.1 833.9 15 735.7 702.3 687.7 T2-1 10 785.6 818.3 20 729.1 698.4 677.9 T2-4 10 787.2 820.6 55.5 700.0 673.7 621.1
Preparation of the samples for metallographic observations was performed according to standard procedures. For light microscopy, the microstructure was observed before and after etching with Nital (4%). Microanalyses were performed on polished and unetched samples using an energy dispersive spectrometer (EDX) XFLASH 6130 from Bruker installed on a scanning electron microscope (SEM) QUANTA 450 from FEI. The SEM was operated at 15 kV with a beam intensity of about 1 nA except for recording EDX maps when it was increased to 10 nA for increasing counts.
Results
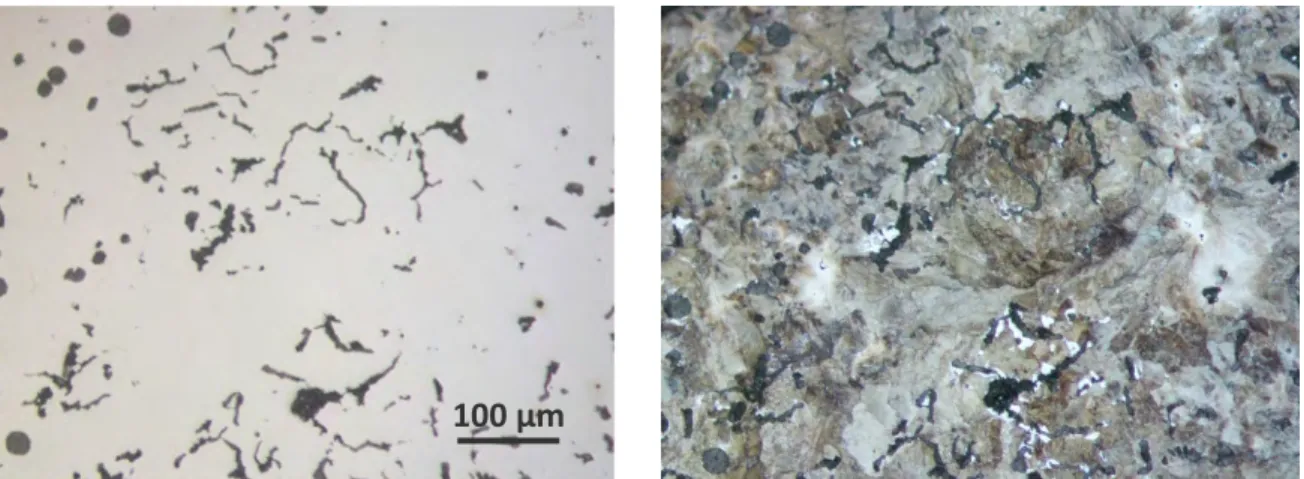
Figure 1 shows the as-cast microstructure of the alloy, before and after Nital etching. As for all micrographs in the following, note that both pictures correspond to the same area. It is seen very little ferrite formed in this alloy when the TA cup was air cooled.
After DTA runs, the samples were similarly observed. It was not noticed any significant change in graphite shape and distribution in these samples as compared to the as-cast microstructure. As an example, Fig. 2 shows micrographs of the DTA sample cooled at 15°C/min. It is seen that there is a
significant amount of ferrite in this sample. As expected, the amount of ferrite did decrease with increasing cooling rate from 1°C/min to 55.5°C/min, still being about 25% at the highest cooling rate.
A close comparison of the two micrographs in Fig. 2 shows that ferrite is much thicker around the worms than around the more rounded graphite particles and nodules. It was verified this was so for the other cooling rates.
100 µm
Figure 1 – Micrographs of the as-cast microstructure before (left) and after (right) Nital etching. The scale is the same for both micrographs.
100 µm
Figure 2 – Micrographs of the DTA sample cooled at 15°C/min
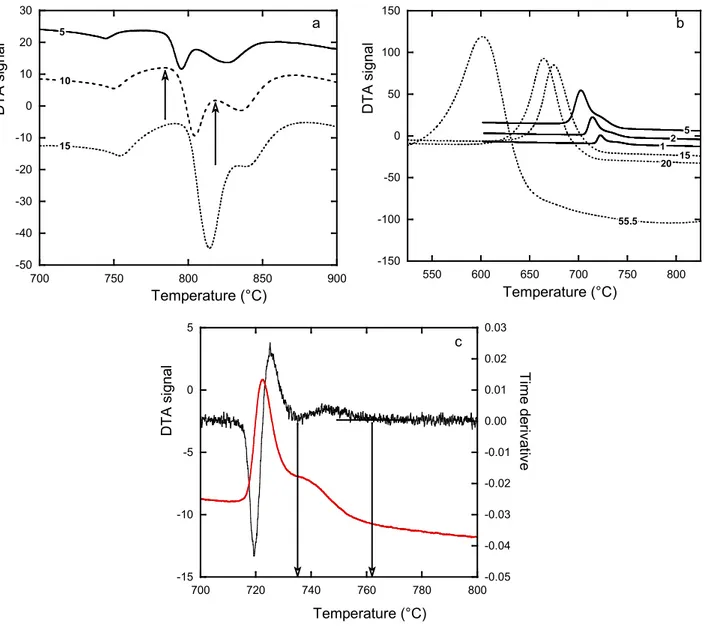
before (left) and after (right) Nital etching. The scale is the same for both micrographs. Figure 3-a compares the DTA records on heating for the three scanning rates used in the present work. All three curves show three thermal arrests (peaks):
- the nearly symmetrical peak at about 750°C corresponds to the Curie temperature of ferrite; - the two other peaks relate to the reverse eutectoid reactions and are seen to partly overlap.
Also, it is seen that the relative amplitude of these latter peaks change with heating rate, the one at lower temperature being predominant at higher heating rate. Owing to the microstructure seen in Fig. 1, this peak should correspond to pearlite decomposition, and the peak at higher temperature to ferrite transformation.
The arrows in Fig. 3-a illustrate for one heating rate how the temperatures were selected to characterize the reverse eutectoid transformation, namely the base of the two thermal arrests which should be the very start of each transformation. These temperatures will be denoted heating
exp , p T and heating exp ,
Ta for experimental start of decomposition of pearlite and ferrite respectively. The values
obtained are listed in Table 2.
Fig. 3-b shows the whole series of DTA records obtained upon cooling. On the three slowest cooling curves, two thermal arrests are easily identified which relate to ferrite (high temperature arrest) and pearlite (low temperature arrest) reactions. Note that the peak corresponding to the Curie
transformation is not seen because the eutectoid transformation, or most of it at lower cooling rates, proceeds below the Curie temperature.
-50 -40 -30 -20 -10 0 10 20 30 700 750 800 850 900 D TA s ig nal Temperature (°C) 15 10 5 a -150 -100 -50 0 50 100 150 550 600 650 700 750 800 D TA s igna l Temperature (°C) 1 2 5 15 20 55.5 b -15 -10 -5 0 5 -0.05 -0.04 -0.03 -0.02 -0.01 0.00 0.01 0.02 0.03 700 720 740 760 780 800 D TA s ignal Time der iva tiv e Temperature (°C) c
Figure 3 – DTA records upon heating (a) and upon cooling (b) at scanning rates (°C/min) indicated on the curves. Characteristic temperatures were read directly on the records for heatings (arrows in a) while resorting to the time-derivative of the record was necessary for coolings (c). The curve in
graph (c) relates to the sample cooled at 1°C/min.
Evaluating the characteristic temperatures for transformation upon cooling was performed using both the DTA record and its time derivative as illustrated in Fig. 3-c. The temperatures cooling
exp ,
Ta (start
of the ferritic transformation) and cooling exp , p
T (start of the pearlitic transformation) thus obtained are
listed in table 2. In addition, the peak temperature peak exp , p
T was considered as giving the temperature
for completion of the pearlitic transformation. It is worth stressing that even at the highest cooling rate a small arrest related to ferrite formation could be evidenced.
Discussion
The results of reverse eutectoid transformation in Fig. 3-a are of limited interest for the present study. However, it is worth stressing that the evolution of the relative amplitude of the two peaks with heating rate does show that more pearlite transforms to ferrite before austenite formation when
the heating rate is decreased. In other words, the thermal stability of pearlite in this alloy is quite limited.
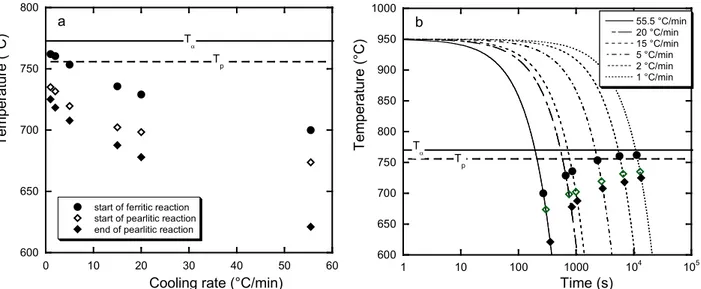
The characteristic temperatures recorded upon cooling and listed in table 2 have been plotted in Fig. 4 as function of cooling rate (Fig. 4-a) and of time as for a CCT diagram (Fig. 4-b). They are there compared with the lower limits of the three phase field in the stable (T ) and metastable (a T ) p systems calculated using formula derived from thermodynamic calculation of phase diagrams [5]. As expected, there is a clear effect of the cooling rate in decreasing the start temperature of both stable and metastable transformations. Further, it is seen that for the finite cooling rates used here the eutectoid transformation starts only when the sample has reached a temperature below the three-phase temperature range, either austenite-ferrite-graphite for the stable system (ferritic reaction) or austenite-ferrite-cementite for the metastable (pearlitic reaction) one. From these results, it may be concluded that the eutectoid transformations in compacted graphite irons are very similar to what has been reported in the case of spheroidal graphite cast irons. This is in line with results by Ekpoom and Heine [7] who did not notice any difference in the start of the eutectoid transformation for malleable, lamellar, compacted and spheroidal graphite cast irons.
600 650 700 750 800 0 10 20 30 40 50 60
start of ferritic reaction start of pearlitic reaction end of pearlitic reaction
Te m per at ur e (° C )
Cooling rate (°C/min)
Ta Tp a 600 650 700 750 800 850 900 950 1000 1 10 100 1000 104 105 55.5 °C/min 20 °C/min 15 °C/min 5 °C/min 2 °C/min 1 °C/min Tem per at ur e (° C ) Time (s) Ta Tp b
Figure 4 – Plot of the recorded characteristic temperatures upon DTA cooling versus cooling rate (a) and time (b). The meaning of the symbols is the same in both graphs. As noticed above, detailed observation of the DTA samples showed that ferrite forms preferentially around the worms than around globular or nodular graphite. Even when ferrite has appeared around nodules, its thickness is generally much smaller than around the worms. This observation could mean either that:
- globular and nodular graphite formed later during solidification, when pearlite promoter elements have started to accumulate because of microsegregation;
- transfer of carbon from the matrix (either austenite or ferrite) to graphite nodules is more difficult than to worms.
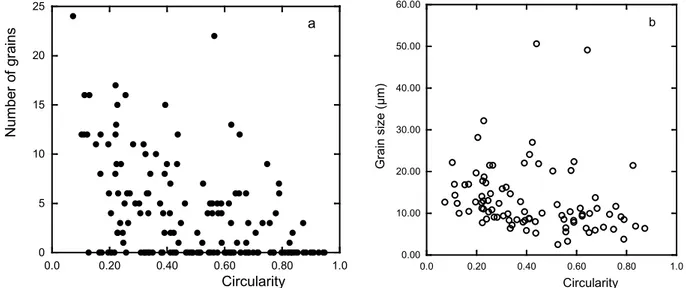
This suggested looking for differences in the ferrite grains nucleated along the graphite particles. One field of each DTA sample cooled at 1°C/min, 20°C/min and 55.5°C/min has thus been observed after etching of the sample and the ferrite grains have been drawn on the micrograph. Each image was then processed with ImageJ software to get the morphological characteristics of every graphite particle in the investigated field in relation to the neighboring ferrite grains. In Fig. 5-a is plotted the correlation between the number of ferrite grains in contact with the graphite particles versus the circularity of these particles for the sample cooled at 20°C/min, where circularity is 4·π·A/P2, with A and P the particle's area and perimeter. The number of grains is seen to increase when the circularity decreases. This certainly mainly results from the fact that particles with low circularity are also generally very large, thus exposing a high surface area to the matrix. The same trend was noticed for the two other samples investigated, with however more graphite
particles without ferrite grains touching them at higher cooling rate. The similarity of grain distribution at low and high cooling rates suggests the distribution of nucleation sites for ferrite along the graphite particles is not sensitive to cooling rate even though the actual number of nucleated grains is.
The average contact length of ferrite grains touching a given graphite particle was then estimated and the data obtained were plotted again as function of circularity. This is illustrated in Fig. 5-b for the sample cooled at 20°C/min. It appears a slight trend for the grain size to decrease with increasing circularity which could be assigned to the change in the distance between ferrite nuclei along the matrix/graphite interface. This would mean an increase of the density of nucleation sites when circularity increases. The same trend was observed for the lower cooling rate but not for the higher cooling rate where no effect of circularity could be observed. This latter observation may relate to the fact that the extension of the ferrite grains along the matrix/graphite interface at high cooling rate was then limited by the time left for their growth and not by the presence of neighboring grains. 0 5 10 15 20 25 0.0 0.20 0.40 0.60 0.80 1.0 N um be r o f gr ai ns Circularity a 0.00 10.00 20.00 30.00 40.00 50.00 60.00 0.0 0.20 0.40 0.60 0.80 1.0 G ra in si ze (µ m) Circularity b
Figure 5 – a) correlation between number of ferrite grains in contact with graphite particles versus the circularity of these particles; b) correlation between ferrite grain size and circularity of the
graphite particles. Measurements made on DTA sample cooled at 20°C/min.
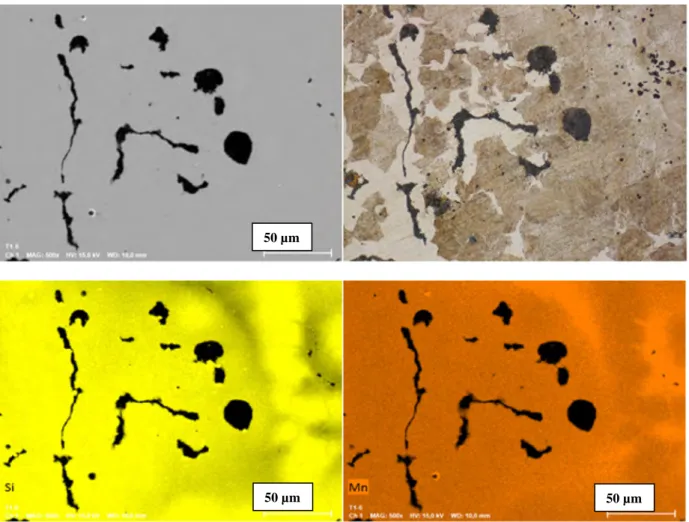
Finally, some limited microanalysis investigation was performed on the sample cooled at 15°C/min. For this an area was selected where an eutectic cell could be identified on the basis of graphite distribution. The SEM image of this zone appears at the top left of Fig. 6. Long-term mapping (11 hours) was then performed using a high intensity beam current (10 nA). Analysis of the data indicated that P, Sn, S and Cr were detected in addition to Fe, C, Al, Si, Mn and Cu. The original maps were processed for quantification (except carbon) and the results are illustrated in Fig. 6 with Si and Mn maps. It is seen that these maps show inverse contrast as expected from the opposite segregation behavior of these elements. The Cu map showed the same features as the Si one, while Cr and P maps were similar to the Mn one. Maps of Sn and S showed very little contrast and looked very much as the one for Cr. The Al map was striking, and it was finally found the observed high-Al spots were due to the final ODS polishing.
A dendrite is clearly seen on the right side of the Si and Mn maps in Fig. 6 in agreement with the slightly hypo-eutectic composition of the alloy though it has been reported that dendrites may also appear in hypereutectic CGI [8]. Finally, it seems that nodules formed late during the solidification process of the present alloy as they appear at the outer boundary of the eutectic cell. This leads concluding that the lower amount of ferrite around rounded and spherical graphite particles relates to solidification microsegregation. Finally, the light micrograph of the area after Nital etching (top right in Fig. 6) shows that the boundaries between ferrite and pearlite areas correspond to zones were distribution of Si and Mn are smooth. In other words, there is no sharp change in composition
related to ferrite or pearlite growth as already seen in the case of SGI [9] and in agreement with the previously described growth conditions of ferrite and pearlite in cast irons [4,6].
Figure 6 – SEM micrograph (top left) of the selected area of the DTA sample cooled at 15°C/min, light optical micrograph of the same area after Nital etching (top right), and Si and Mn EDS maps. The role of microsegregation issued from the solidification step may be further illustrated with the industrial case shown in Fig. 7. On the left of this figure, the micrograph demonstrates that dendrites and the matrix around large primary nodules transformed to ferrite, whilst the remaining of the structure consisted in pearlite. This is clearly related to the higher silicon content of austenite formed early during solidification and much in line with observations reported by Vazehrad [10].
Figure 7 – 3.0 L V6 cylinder block. Ferrite associated with ex-austenite dendrites and with large primary nodules.
50 µm 50 µm
Summary
The results of this study confirm that the eutectoid transformation in compacted graphite cast iron follows the same rules as in other cast irons as concerns the conditions for the start of growth of ferrite and pearlite. The role of solidification microsegregation was exemplified here by observing the formation of ferrite around large nodules when they formed early during the solidification process, while this hardly happens when they developed at the periphery of compacted graphite cells. Though acting as a second order parameter, the role of graphite shape on ferrite nucleation was also considered but would need further investigation to be demonstrated.
Acknowledgments
Jon Sertucha (Azterlan) is warmly thanked for chemical analysis of the alloy and Geogiana Constantinecu for her metallographic investigation during an internship at CIRIMAT in 2016.
References
[1] M. König, Literature review of microstructure formation in compacted graphite iron, Int. J. Cast Met. Res., 23 (2010) 185-192.
[2] M. Gorny, Cast iron: compacted graphite, in: R. Colás, G.E. Totten (Eds.), Encyclopedia of Iron, Steel, and Their Alloys, CRC Press, 2016, pp. 718-734.
[3]E.N. Pan, C.R. Loper, AFS Trans., 94 (1986) 545-556.
[4] J. Lacaze, J. Sertucha, L. Magnusson Åberg, Microstructure of as-Cast Ferritic-Pearlitic Nodular Cast Irons, ISIJ Int., 2016, vol. 56, pp. 1606-15.
[5] V. Gerval, J. Lacaze, Critical temperatures of spheroidal graphite cast irons : a review of literature data, ISIJ Int., 40 (2000) 386-92.
[6] J. Lacaze, The austenite to Pearlite/ferrite transformation, ASM Handbook, Vol. 1A, Cast Iron Science and Technology, 2017, pp. 106-113
[7] U. Ekpoom, R.W. Heine: Austenite transformation temperature range in cast irons, AFS Trans., 86 (1978) 281-86.
[8] M.G. Lopez, G.L. Rivera, J.M. Massone, R.E. Boeri, Study of the solidification structure of compacted graphite cast iron, Int. J. Cast Met. Res., 29 (2016) 266-271.
[9]A. Freulon, P. de Parseval, C. Josse, J. Bourdie, J. Lacaze: Study of the eutectoid transformation in nodular cast-irons in relation with solidification microsegregation, Metall. Mater. Trans. A, 47A (2016) 5362-5371.