www.earth-syst-dynam.net/7/183/2016/ doi:10.5194/esd-7-183-2016
© Author(s) 2016. CC Attribution 3.0 License.
Groundwater nitrate concentration evolution under
climate change and agricultural adaptation scenarios:
Prince Edward Island, Canada
Daniel Paradis1, Harold Vigneault2, René Lefebvre2, Martine M. Savard1, Jean-Marc Ballard2, and Budong Qian3
1Natural Resources Canada, Geological Survey of Canada, Quebec City, Canada 2Institut national de la recherche scientifique, Centre Eau Terre Environnement (INRS-ETE),
Quebec City, Canada
3Agriculture and Agri-Food Canada, Eastern Cereal and Oilseed Research Centre, Ottawa, Canada
Correspondence to: Daniel Paradis ([email protected])
Received: 17 June 2015 – Published in Earth Syst. Dynam. Discuss.: 11 August 2015 Revised: 22 January 2016 – Accepted: 15 February 2016 – Published: 9 March 2016
Abstract. Nitrate (N-NO3) concentration in groundwater, the sole source of potable water in Prince Edward
Island (PEI, Canada), currently exceeds the 10 mg L−1(N-NO3) health threshold for drinking water in 6 % of
domestic wells. Increasing climatic and socio-economic pressures on PEI agriculture may further deteriorate groundwater quality. This study assesses how groundwater nitrate concentration could evolve due to the fore-casted climate change and its related potential changes in agricultural practices. For this purpose, a tridimensional numerical groundwater flow and mass transport model was developed for the aquifer system of the entire Island (5660 km2). A number of different groundwater flow and mass transport simulations were made to evaluate the potential impact of the projected climate change and agricultural adaptation. According to the simulations for year 2050, N-NO3concentration would increase due to two main causes: (1) the progressive attainment of
steady-state conditions related to present-day nitrogen loadings, and (2) the increase in nitrogen loadings due to changes in agricultural practices provoked by future climatic conditions. The combined effects of equilibration with loadings, climate and agricultural adaptation would lead to a 25 to 32 % increase in N-NO3concentration
over the Island aquifer system. The change in groundwater recharge regime induced by climate change (with current agricultural practices) would only contribute 0 to 6 % of that increase for the various climate scenarios. Moreover, simulated trends in groundwater N-NO3concentration suggest that an increased number of domestic
wells (more than doubling) would exceed the nitrate drinking water criteria. This study underlines the need to develop and apply better agricultural management practices to ensure sustainability of long-term groundwater resources. The simulations also show that observable benefits from positive changes in agricultural practices would be delayed in time due to the slow dynamics of nitrate transport within the aquifer system.
1 Introduction
Significant increases in groundwater nitrate concentration ([NO3]) are caused largely by sewage leaks, wastewater
treatment without denitrification, improper management of wastewater effluents and overuse of fertilizers and/or animal waste. These nitrate sources are responsible for the contami-nation of numerous aquifers, especially in those areas where
groundwater is replenished directly from the surface over large areas. Nitrate contamination is often associated with anthropogenic activities at ground surface, such as the fertil-ization of agricultural crops. Once groundwater is contami-nated, remediation is difficult, thus the prevention of contam-ination is the primary strategy used for water quality manage-ment (Ghiglieri et al., 2009).
Groundwater is the sole source of potable water in the Province of Prince Edward Island (PEI) in eastern Canada, and it plays a dominant role in surface water quality as well. Besides being a concern for drinking water quality, excessive nitrate levels contribute to eutrophication of surface waters, especially in estuarine environments (Somers and Mutch, 1999). Only one watershed among the 50 watersheds de-lineated in PEI still has groundwater with a mean [NO3]
within natural background levels (< 1 mg L−1N-NO3).
Fur-thermore 6 % of supply wells exceed the recommended max-imum concentration limit of 10 mg L−1 (N-NO3) for
drink-ing water (Health Canada, 2004; Somers, 1998; Somers et al., 1999). Over the past decade, several studies have doc-umented the nitrate problem in PEI groundwater (Somers, 1998; Somers et al., 1999; Young et al., 2002; Savard et al., 2007) and suggested that elevated nitrate levels are often as-sociated with agricultural activities, especially the use of fer-tilizers for row crop production. In addition, water quality surveys have recorded important increases (more than dou-bling since 1980) of [NO3] in groundwater and surface water
in some areas of the province (Somers et al., 1999).
According to simulations made with the global circulation model (GCM) for Canada, temperature increases in the or-der of 2 to 4◦C by 2050 is expected at the country scale (Hengeveld, 2000). Projected changes in annual precipita-tion over Canada remain within 10 % of present levels un-til 2050, with most of the increases occurring during win-ter months. Since global warming is expected to change the hydrologic cycle (Gleick, 1986) as well as the agricultural practices (Olesen and Bindi, 2002; McGinn and Shepherd, 2003), it could, in turn, impact groundwater [NO3]. The
overall impact on groundwater [NO3] will likely depend on
both the magnitude of the change induced by climate change on the hydrologic cycle and how agriculture will adapt to these changes. The combined pressures of climatic change on groundwater recharge and agricultural practices, together with the need to preserve groundwater quality for the resi-dents of PEI, illustrate the importance of effective long-term strategies for water management. The aim of this study is then to assess the potential impact of both climate change and modified agricultural practices on future groundwater [NO3]
for the entire PEI (∼ 5660 km2).
Nitrate concentration in groundwater depends on the mass loadings and the amount of water infiltrating the soils down to the water table. In other words, future N-NO3
concentra-tion can be estimated as the mass of nitrate leached over the volume of recharge per unit area carrying out this mass to the aquifer (groundwater recharge) under projected climatic conditions. Climate change impacts were simulated using different GCMs and CO2 emission scenarios for the period
of 2040–2069, to assess the sensitivity of the climatic vari-ables. The stochastic weather generator AAFC-WG (Hay-hoe, 2000) was then used to adjust daily temperature and pre-cipitation of selected large-scale GCM scenarios to the scale of the Island and allow simulations of groundwater recharge
over the Island using the hydrologic infiltration model HELP (Schroeder et al., 1994). The physical parameters used by this infiltration model allow an assessment of the impact of changing climatic parameters on the hydrological cycle, which includes groundwater recharge. Moreover, the amount of nitrogen leaching to the aquifer was estimated on the ba-sis of the residual soil nitrogen (RSN) indicator (Yang et al., 2007) under present-day conditions as well as considering agricultural adaptation scenarios in response to the increase of crop heat units, effective growing degree-days and agro-economic trends (De Jong et al., 2008).
Studying the impacts of climate change and agricultural management scenarios on groundwater quality also neces-sitates understanding the aquifer system dynamics. Particu-larly, flow and transport simulations are needed to assess the nitrate residence time and the aquifer response to changes in practices or climatic conditions. While there have been many studies relating the effect of climate changes on groundwa-ter resources (e.g., Yussof et al., 2002; Allen et al., 2004, 2010; Scibek and Allen, 2006; Green et al., 2007a, b; Hsu et al., 2007; Jyrkama and Sykes, 2007; Serrat-Capdevila et al., 2007; Woldeamlak et al., 2007; Holman et al., 2009; Crosbie et al., 2010; McCallum et al., 2010; Okkonen et al., 2010; Rozell and Wong, 2010; Zhou et al., 2010; Beigi and Tsai, 2015), there are few published studies which attempt to relate climate change to changes in groundwater [NO3]
(e.g., De Jong et al., 2008; Ducharne et al., 2007; Holman et al., 2005a, b; Jackson et al., 2007). In their works, De Jong et al. (2008) and Jackson et al. (2007) estimated mass of nitro-gen (N) leaching through the unsaturated zone for different scenarios to relate with [NO3] measured in wells – that is,
assuming a direct relationship between nitrate leachate and groundwater [NO3] regardless of the aquifer system
dynam-ics. While the semi-empirical hydrological model proposed by Holman et al. (2005a, b) to predict [NO3] in both
sur-face water and groundwater includes a groundwater store, such model does not simulate spatial and temporal ground-water flow patterns that control nitrate transport in the aquifer system. For instance, Ducharne et al. (2007) demonstrated that modeling of the aquifer system using a physically based groundwater flow model allowed to simulate the inertia of the aquifer system, which has a considerable impact on [NO3]
measured in wells. In this study, the evolution of ground-water [NO3] under a changing climate was modeled using
the physically based groundwater flow and solute transport numerical simulator FEFLOW (Finite Element subsurface FLOW system; Diersch, 2010) considering the effect of the dual porosity of the fractured porous medium (sandstone), identified by Jackson et al. (1990) as being responsible for the persistence of pesticides in the aquifer system of PEI. In particular, the hydrogeological model developed for the entire province was based on knowledge gained from the Wilmot watershed (Jiang and Somers, 2009; Paradis et al., 2006, 2007), which is representative of most other regions of PEI regarding land use, soils, physiography, geology and
hy-(a) (b)
Wilmot River (23) Poplar Point (44)
Mill River (7)
Rainers Creek (18)
Winter River (31) Morell River (35)
Monticello Summerside Oleary Land Use Agriculture Urban Forest Wetland Weather station N Charlottetown 0 5 10 kilometer20 30 40 Alberton Alliston East Baltic New London New Glasgow Stanhope Bangor
Figure 1.(a) Location of Prince Edward Island (PEI) in eastern Canada. (b) Limits of the watersheds (numbered area delineated with brown lines, see names Table S1), with identification of the major rivers (names in blue), along with land use (see legend) and location of the weather stations (names in black).
drogeology. The hydrogeological model was calibrated with historical hydrogeological records of conditions specific to the Island: hydraulic heads, groundwater discharge to river and [NO3] measured in both wells and rivers.
The novelty of this study is to provide a quantitative com-parison of climate change effects and agricultural adapta-tion impacts on the future evoluadapta-tion of [NO3], taking into
account potential changes in groundwater recharge and ni-trate leached. Also, the general framework developed for the integration of the knowledge related to the aquifer system, climatic parameters and agricultural practices into a compre-hensive calibration approach with site-specific records to nar-row uncertainty in model parameters, could be applied else-where to guide groundwater resource and quality manage-ment.
2 Prince Edward Island study area
PEI, located in eastern Canada, covers approximately 5660 km2 and is 225 km long by 3 to 65 km wide (Fig. 1 and Table 1). Topographic elevation ranges from sea level to 140 m a.s.l. (above sea level). PEI is predominantly rural, with 39 % of its surface covered by agricultural lands and 45 % by forests. Forests mostly cover the eastern and west-ern portions of the Island, whereas agricultural activities are
Table 1.Main physiographic and land use characteristics of Prince Edward Island (land use based on a LANDSAT image for 2000).
Physiography Area 5660 km2 Width 3–65 km Length 225 km Elevation (a.s.l.) 0–140 m Land use (%) Forest 45 Agriculture 39 Wetland 7
Residential, urban, industrial 5.9
Recreational 0.3
Miscellaneous 2.8
mostly concentrated in the central part. Residential, urban and industrial activities occupy less than 6 % of the territory.
2.1 Climate and hydrology
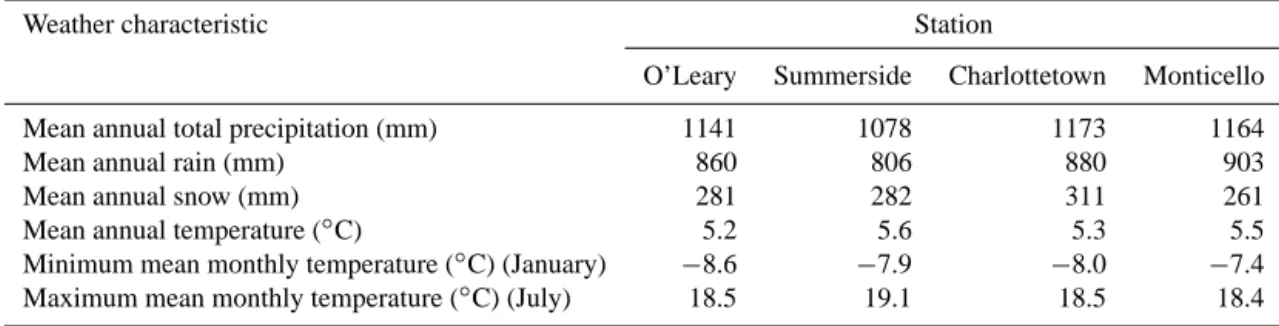
The climate in the Island is humid continental, with long, fairly cold, winters and warm summers. Data selected from four weather stations geographically distributed across the Island (Fig. 1) show relatively similar conditions (Table 2).
Table 2.Weather for Prince Edward Island (meteorological data for the 1971–2000 period). See Fig. 1 for locations of the weather stations.
Weather characteristic Station
O’Leary Summerside Charlottetown Monticello
Mean annual total precipitation (mm) 1141 1078 1173 1164
Mean annual rain (mm) 860 806 880 903
Mean annual snow (mm) 281 282 311 261
Mean annual temperature (◦C) 5.2 5.6 5.3 5.5
Minimum mean monthly temperature (◦C) (January) −8.6 −7.9 −8.0 −7.4
Maximum mean monthly temperature (◦C) (July) 18.5 19.1 18.5 18.4
As an example of the climatic conditions found on the Island, the mean annual precipitation at the Charlottetown weather station is 1173 mm, most of which falls as rain (75 %). The mean annual temperature is about 5.3◦C and means for monthly temperature range from −8◦C in January to 18.5◦C in July. The Island can be divided into 50 watersheds com-prising 241 sub-watersheds (Fig. 1). River basins are typi-cally small, and the main rivers are estuarial over a signifi-cant portion of their length. Mean annual streamflow ranges from less than 0.66 to 2.88 m3s−1(Table 3).
2.2 Geology and hydrogeological framework
PEI is a crescent-shaped cuesta of continental red beds, Up-per Pennsylvanian to Middle Permian in age, dipping to the northeast at about one to three degrees that consist of con-glomerate, sandstone and siltstone in which sandstones are dominant (Van de Poll, 1983). The rock sequence underlying the Island is almost entirely covered by a layer of uncon-solidated glacial material from a few centimeters to several meters in thickness (Prest, 1973). These deposits are gener-ally derived from local sedimentary rock and include both unsorted tills and water-worked fluvial and glacio-marine deposits.
With few exceptions, the surficial sediments over PEI do not represent significant aquifers as they are not water sat-urated, so the sandstone constitutes the main aquifer. Be-cause the geology of the Island is relatively homogeneous, the hydrogeological conceptual model for all PEI is assumed to be similar to the one defined for the Winter River and Wilmot River watersheds where Francis (1989) and Par-adis et al. (2006, 2007) carried out extensive hydrogeolog-ical characterization. Based on these studies several observa-tions relative to the hydrogeological framework of PEI can be made:
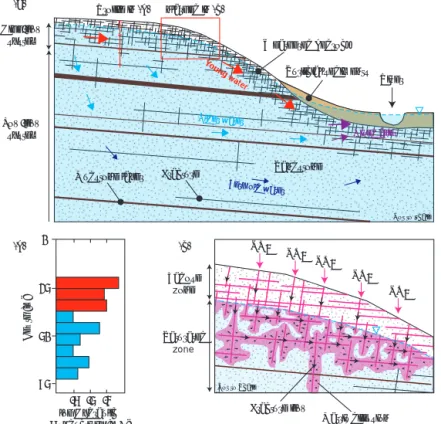
– The sandstone aquifer comprises a shallow high-flow
system overlying a deep low-flow system (Fig. 2a). This is based on hydraulic conductivity profiles obtained from field multi-level packer tests in rock aquifer wells that show a rapid decrease of hydraulic conductivity with depth (Fig. 2b). This decrease is significant under a depth of 18 to 36 m, according to location. The
shal-Table 3.Streamflow characteristics of selected rivers in Prince Ed-ward Island (records are for 1972 to 2005, 1961 to 1995 and 1965 to 1991 for Wilmot, Morell, and Winter rivers, respectively). See Fig. 1 for locations of the rivers.
Streamflow characteristics Watershed (drainage area in km2)
(m3s−1) Morell Wilmot Winter
(133) (45) (38)
Mean annual 2.88 0.92 0.66
Minimum monthly mean (September) 1.10 0.44 0.24 Maximum monthly mean (April) 6.77 1.89 1.61
low interval with higher permeability is defined as the high-flow system. Most domestic wells tap potable wa-ter in this high-flow system (Mutch, 1998; Rivard et al., 2008).
– The sandstone aquifer represents a double porosity
sys-tem with fractures providing groundwater flow paths and the porous matrix providing storage capacity, both for water and solutes, including nitrate. The fractured sandstone is characterized by relatively high hydraulic conductivity, between 1 × 10⁻⁶ and 3 × 10⁻⁴m s−1 (Fig. 2b), but it has a low storage capacity (1–3%), as obtained from modeling of baseflow recession curves (Paradis et al., 2006, 2007) and seasonal nitrate sources in groundwater from isotopes (Ballard et al., 2009). In contrast, the matrix has a high porosity of about 17 %, but a much lower hydraulic conductivity as mea-sured from laboratory core permeameter tests: mostly between 1 × 10⁻⁸ and 5 × 10⁻⁷m s−1 but as low as 5 × 10⁻¹⁰m s−1for mudstone (Francis, 1989).
– Comparison between field (Paradis et al., 2006, 2007;
Francis, 1989) and laboratory (Francis, 1989) hydraulic conductivity measurements suggests that fractures play an important role in the rock aquifer permeability, and the general decrease in hydraulic conductivity with depth is the result of decreasing fracture aperture and frequency. Horizontal bedding of the sandstone forms the main fracture network above 35 m depth (82 % of all fractures; Francis, 1989). Over a large area, the
rela-Sandstone Fracture Mudstone layer Weathered bedrock Surficial sediments River (a) NO3 NO3 NO3 NO3 NO3 Vadose zone Saturated zone Fracture flow Matrix diffusion (c) Enlarged in (c) Profile in (b) High-flow system Low-flow
system Mixed ages
Very old water Older water Youn g wa ter (b) -6 -5 -4 log Hydraulic Conductivity [m/s] Depth [m] 0 25 50 75 Not to scale Not to Scale
Figure 2.(a) Schematic conceptual model of the groundwater flow system along with (b) a typical profile of hydraulic conductivity showing distinct shallow high-flow (red) and deeper low-flow (blue) systems; and (c) a conceptualization of nitrate transport in the double-porosity sandstone aquifer with advective fracture flow and matrix diffusion.
tive homogeneity of the distribution and interconnection of fractures provides a typical “porous media” response to pumping, especially in the weathered high-flow rock aquifer system (Francis, 1989).
– Tritium analyses on groundwater samples in the
high-flow system indicate the presence of “modern ground-water” younger than 50 years. In the low-flow sys-tem, no tritium is observed but carbon-14 analyses pro-vide groundwater ages between 5000 and 7000 years at depths ranging between 50 and 85 m below the water table (Paradis et al., 2006, 2007).
– Transient modeling of baseflow recession curves (the
groundwater contribution to a river) for the Wilmot River watershed suggests that rivers gain water from the aquifer most of the year (Jiang and Somers, 2009) and there is a strong interaction between the high-flow sys-tem and the rivers (Paradis et al., 2007). This is also sup-ported by seasonal sampling of nitrate carried out over a period of 2 years in domestic wells and in the Wilmot River that shows similar average [NO3] as well as
wa-ter and nitrate isotope properties (Savard et al., 2007, 2010).
In summary, it is inferred from the development of the con-ceptual hydrogeological model that groundwater flow and
nitrate transport predominantly occur in the high-flow sys-tem (Fig. 2c). The shallow high-flow syssys-tem essentially fol-lows the ground topography and is hydraulically connected to rivers. Nitrate transported to the aquifer by infiltration of precipitation will first reach the shallow high-flow sys-tem and then eventually reach rivers mainly through frac-tures in weathered and fractured sandstone, which are signif-icantly more permeable than the sandstone matrix itself. Ni-trate transport rate through the aquifer system could however be reduced, as matrix diffusion occurs due to the contrast in [NO3] between fractures and matrices. The high
poros-ity of the sandstone matrix makes it an important repository for nitrate which could store or release nitrate, depending on geochemical conditions in the adjacent fracture network. Fi-nally, it is also likely that a proportion of the nitrate trans-ported in the high-flow system has reached the underlying low-flow system. Considering the reduced groundwater flow and the mostly old groundwater ages encountered in the low-flow system, the nitrate that may be present in the low-low-flow system may not have reached rivers yet. Note that in the case of the entire PEI, oxidizing aquifer conditions usually prevail in the sandstone aquifer and it was assumed that denitrifica-tion processes are negligible within the aquifer. Moreover, no natural geological sources of nitrate are expected to be present throughout the Island. The aquifer [NO3] would then
be controlled by water infiltration and nitrate leaching from the soil.
3 Study methodology
Figure 3 presents the general workflow followed to model the evolution of [NO3] in groundwater of the PEI aquifer system,
which is briefly described below with further details provided in the following sections:
– Climate change can itself be predicted on the basis
of meteorological models with a large degree of un-certainty. Therefore, different climate change scenarios have to be considered in order to represent the potential range of impacts related to predicted temperature and precipitation. In this study, four climate scenarios were selected to provide future daily weather conditions for the period 2040–2069. These scenarios are based on dif-ferent GCMs and CO2emission scenarios for the period
2040–2069.
– The daily temperatures and precipitations of the four
selected large-scale GCMs were downscaled using his-torical meteorological records of existing weather sta-tions using the stochastic weather generator AAFC-WG (Hayhoe, 2000) in order to provide more realistic cli-mate conditions of the Island.
– Groundwater recharge was obtained from the HELP
in-filtration model (Schroeder et al., 1994), which uses daily climate conditions and soil properties as input. As done by Croteau et al. (2010), recharge obtained from HELP was calibrated on the basis of present-day cli-mate conditions, so that future recharge could be esti-mated using the four climate scenarios.
– Nitrate leaching to the aquifer system was estimated
un-der present-day conditions and agricultural adaptation scenarios. This mass of nitrate leachate is determined on the basis of the residual soil nitrogen (RSN) indica-tor (Yang et al., 2007).
– Using present-day nitrate mass and groundwater
recharge, a three-dimensional numerical model of groundwater flow and nitrate transport was developed and calibrated to represent the specific hydrogeological conditions of PEI using FEFLOW (Diersch, 2010). This model was then used to simulate the future evolution of [NO3] under different climate change and agricultural
adaptation scenarios that implied potential changes in groundwater recharge and nitrate leachate.
3.1 Climate change scenarios and climate data downscaling
The Intergovernmental Panel on Climate Change Special Report on Emission Scenarios (Nakicenovic and Swart,
Global
Circulation Model (GCM)
Hydrogeological Flow and Transport Model (FEFLOW) Infiltration Model (HELP) Weather Generator (AAFC-WG) P, T° Downscaled P, T° GW Recharge NO3 Mass
NO3 Concentrations in Groundwater
Agricultural Adaptation Scenarios Residual Soil Nitrogen Indicator (RSN) Agricultural Practices P, T°
Figure 3.Workflow for the study of the potential impact of climate and agricultural practice changes on future groundwater nitrate con-centration in the Prince Edward Island aquifer system.
2000) provides 40 different scenarios, which are all deemed “equally likely”, but the A2 and B2 scenarios are widely adopted in climate change experiments and impact stud-ies (IPCC, 2001). The A2 scenario envisions a population growth to 15 billion by year 2100 with rather slow eco-nomic growth and development. Consequently, the projected equivalent CO2concentration rises from 476 ppm in 1990 to
1320 ppm in 2100. The B2 scenario envisions slower pop-ulation growth (10.4 billion by 2100) with a more rapidly evolving economy, but with more emphasis on environmen-tal protection. It therefore produces lower emissions (CO2
concentration of 915 ppm by 2100) and less warming than scenario A2. The A2 and B2 scenarios were simulated us-ing two different GCMs, which are the CGCM2 (Flato and Boer, 2001) developed at the Canadian Centre for Climate Modelling and Analysis, and HadCM3 (Gordon et al., 2000) developed at the Hadley Centre for Climate Prediction and Research of the UK Meteorological Office. Daily outputs of maximum and minimum air temperature, and total pre-cipitation were obtained electronically from the Canadian Centre for Climate Modelling and Analysis and the Hadley Centre through the Climate Impacts LINK project (Viner, 1996) for the four climate change scenarios labeled hereafter: CGCM2-A2, CGCM2-B2, HadCM3-A2 and HadCM3-B2.
The AAFC-WG (Hayhoe, 2000) was used to generate syn-thetic continuous daily weather records for the historical pe-riod (1971–2000) and for two (2040–2069) climate scenar-ios using different GCMs (Fig. 3). The time period 2040– 2069 is approximately corresponding to a doubling of atmo-spheric CO2 concentration (Qian et al., 2010). The
AAFC-WG is a stochastic weather generator that was developed for and evaluated in diverse Canadian climates (Qian et al., 2004). To obtain future climate data, daily outputs from the four climate change scenarios (CGCM2-A2, CGCM2-B2, HadCM3-A2 and HadCM3-B2) were downscaled with ob-served historical climate data from existing weather stations. A total of 11 weather stations were selected, covering PEI fairly evenly and having the best available historical weather data for 1971–2000 (Fig. 1). Observed historical weather data, including daily maximum and minimum air tempera-tures and daily precipitation, were provided by Environment Canada through their web site, and first used to calibrate an AAFC-WG model for each weather station. The parame-ters for the various statistical models used by the AAFC-WG were indeed estimated from historical observations indepen-dently for each station. Note that historical climate from syn-thetic weather data generated by AAFC-WG is generally not significantly different from observations (Qian and De Jong, 2007; Qian et al., 2011).
3.2 Groundwater recharge
Groundwater recharge simulations serving as input for the FEFLOW model was carried out with the physically based hydrologic model HELP (Schroeder et al., 1994) (Fig. 3). The model is quasi two-dimensional and the natural water balance components simulated include precipitation, inter-ception of rainwater by leaves, evaporation by leaves, surface runoff, evaporation from soil, plant transpiration, snow accu-mulation and melting, and percolation of water through the soil profile. The advantage of using such a model is that tem-perature and precipitation resulting from climate scenarios may be directly used in the model to predict future ground-water recharge, once the model has been calibrated based on present-day data (e.g., Jyrkama et al., 2002; Allen et al., 2004; Croteau et al., 2010; Rivard et al., 2014).
The spatial estimation of groundwater recharge over PEI was obtained using 500 × 500 m cells (total of 21 168). For each cell, model parameters were retrieved and analyzed with geographical information software and a database manage-ment system. The HELP parameters used are summarized below.
– Soil profile: the soil profile is the vertical combination
of natural soil and geological materials that compose the vadose and saturated zones. The surface soil infor-mation was assembled from various regional soil sur-veys conducted on the Island (Canadian Soil Informa-tion System, 2000). There were a total of 953 unique
soil types identified on PEI that were regrouped into six distinct soil classes according to the dominant soil texture (A – sand or coarser; B – loamy sand or grav-elly; C – sandy loam (< 8 % clay); D – fine sandy loam or very fine sandy loam; E – loam or silt loam; and F – sandy clay loam or clay loam). A typical soil profile consisting of three layers was used to their representa-tion. The top layer is 0.5 m thick and consists of one of the six soil classes; layer 2 is 1–17 m thick and consists of unconsolidated glacial material; and bottom layer is 10 m thick and consists of weathered sandstone (high-flow system).
– Initial moisture content: the initial water content of each
soil profile layer was computed by the model as steady state values. HELP indeed assigned values for the initial water moisture storage of layers and simulates a 1-year period. These values were then used as initial values for the simulations. A sensitivity analysis of initial water content reveals that this parameter does not affect signif-icantly groundwater recharge estimates as steady-state conditions can be assumed over the long simulation pe-riod.
– Surface runoff: surface runoff (also known as overland
flow) is the flow of water that occurs when excess rainfall or snowmelt flows over the soil surface. Sur-face runoff was estimated using a modified Soil Con-servation Service (SCS) curve-number method (USDA, 1986), as proposed by Monfet (1979). The modified method allows a more reliable estimation of surface runoff in watersheds with short concentration time and for precipitation patterns found in eastern Canada. The modified SCS method allows estimation of surface runoff to a river following a rainfall or snowmelt event using soil characteristics, land use, type of vegetation, soil humidity, and surface slope. Digital land use and land cover data were obtained from Landsat-7 images (CanImage, 2001).
– Solar radiation: the required daily values of
precipi-tation, mean air temperature, and solar radiation were calculated. Precipitation and temperature were obtained from downscaled climate scenarios, while solar radia-tion data were generated using the weather generator provided by HELP. Solar radiation is computed accord-ing to precipitation (whether the day is wet or dry) and latitude.
– Evapotranspiration: the multi-layer procedure for
calcu-lating evaporation values from snow, soil, and leaves, as well as transpiration based on type of vegetation used the evaporative zone depth, maximum leaf-area index, growing season start and end day, average wind speed, and relative humidity. These parameters were evaluated from existing land cover, agricultural and climatic data.
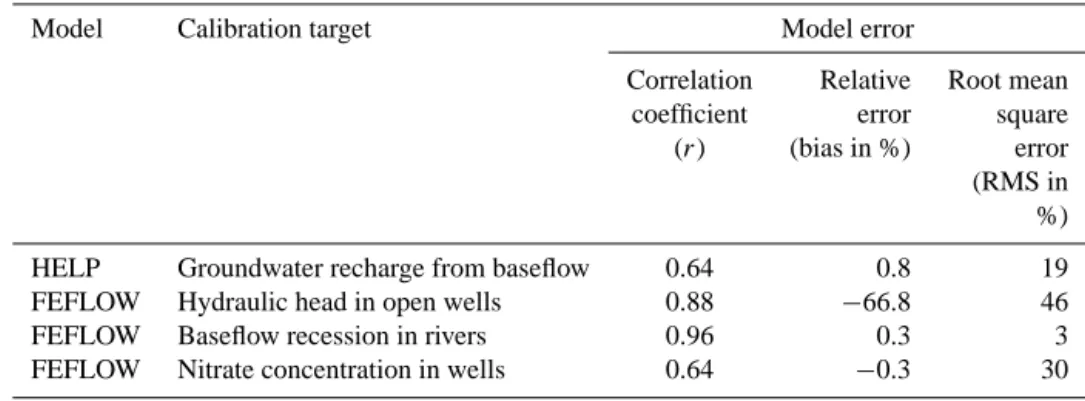
Table 4.Statistical analysis of model performance on calibration of different independent data sets for the simulation of groundwater flow and nitrate transport in the Prince Edward Island aquifer system.
Model Calibration target Model error
Correlation Relative Root mean
coefficient error square
(r) (bias in %) error
(RMS in %)
HELP Groundwater recharge from baseflow 0.64 0.8 19
FEFLOW Hydraulic head in open wells 0.88 −66.8 46
FEFLOW Baseflow recession in rivers 0.96 0.3 3
FEFLOW Nitrate concentration in wells 0.64 −0.3 30
Groundwater recharge values simulated from HELP were calibrated against baseflow values estimated using the method of hydrograph separation with streamflow records (Furey and Gupta, 2001) to narrow uncertainty in the input parameters of HELP (e.g., Croteau et al., 2010). Baseflow is the groundwater contribution to river discharge (stream-flow) and it is often used as an approximation of groundwa-ter recharge when underflow (groundwagroundwa-ter flow beneath and by-passing a river), evapotranspiration from riparian vegeta-tion, and other losses of groundwater from the watershed are minimal (Risser et al., 2005). Hydrograph separation meth-ods estimate the part of the streamflow hydrograph attributed to baseflow using semi-empirical filter techniques. The cal-ibration was done with the historical records of temperature and precipitation (1971–2000) for three gauged streamflow stations with the most comprehensive time series (Morell, Wilmot and Winter, Fig. 1 for location). For each watershed, groundwater recharge with HELP was estimated by summing all individual 1-D soil profiles included in the watershed as-suming that water reaching the aquifer for each soil pro-file contributes to the streamflow within the year. The most relevant parameters to calibrate were the evaporative zone depth and the heat insulation of the snow cover. The trend in groundwater recharge simulated with HELP is comparable to baseflow estimated with the Furey and Gupta (2001) method (Table 4), with a correlation coefficient of 0.64 and no sig-nificant bias (relative error close to 0) in the annual values. The error in the simulated values is 19 % as expressed by the RMS error.
3.3 Mass of nitrogen available for leaching and agricultural adaptation scenario
The mass of nitrate available for transfer to groundwater was estimated with the residual soil nitrogen (RSN) indica-tor (Drury et al., 2007; Fig. 3). The RSN indicaindica-tor estimates the quantity of inorganic soil N at the time of harvest, at the Soil Landscape of Canada (SLC) polygon level (Soil Land-scapes of Canada Working Group, 2006). The RSN indicator
is the difference between N inputs from chemical fertilizer N, manure, biological N fixation by leguminous crops, and at-mospheric deposition and outputs in the form of N in the harvested portion of the crops and pasture, and gaseous (N2
and N2O) losses to the atmosphere via denitrification. The
total chemical fertilizer N is based on fertilizer recommen-dation applied to crops adjusted to the total manure N able for crops and improved pasture. The amount of avail-able inorganic N from manure applied to crops and pasture take into consideration losses from storage and handling. It is estimated that 15 % of manure N is lost during storage and handling (Burton and Beauchamp, 1986), 35 % is added to the soil as organic N (Ontario Ministry of Agriculture and Food, 2003), and consequently 50 % of N originally present in manure is inorganic N which would be available to crops during the year of application. Of this available N, 1.25 % is lost as N2O emissions, and an equal portion is assumed to be
lost through N2production. Although soil mineralization and
immobilization also occur on a seasonal basis, it is assumed that soils are in a steady-state situation, with no net change in soil organic N from one year to the next.
The main inputs of the RSN model consist of acreages for all major agricultural crops and their associated crop yields, as well as the type and number of livestock. These data are collected every 5 years through the census made by Agricul-ture and Agri-Food Canada and are allocated to SLC poly-gons based on the methodology described by Huffman et al. (2006). The RSN model was run for all 5 census years (1981, 1986, 1991, 1996 and 2001) and the output was av-eraged to obtain a “historical” RSN value for each of the 23 SLC polygons covering PEI (De Jong et al., 2008). The RSN values at the SLC polygon level could not be vali-dated because independent data sets are not available at that scale. However, Yang et al. (2007) compared the total ad-justed chemical fertilizer N recommendation (fertilizer rec-ommendation minus available manure) with the total amount of N fertilizer sold in PEI. For the five censuses, the average ratio between the adjusted fertilizer recommended rates and the amount of N fertilizer sales is 1.0 (between 1.35 to 0.82)
indicating that fertilizer recommendations are generally well followed in the province.
Many different agricultural adaptation scenarios can be de-vised, either with increased or decreased production inten-sity as compared to the present level. For the purpose of our study, a “worst case” scenario was selected because none of the adaptation scenarios is verifiable. Based on consensus ex-pert opinion of Agriculture and Agri-Food Canada at the Re-search and Policy Branch, it was assumed that agricultural production in PEI would intensify over the next 50 years. Hence, relative to the 2001 census provincial totals, the fol-lowing sequential agricultural land use scenario was devel-oped for the 2040–2069 period (De Jong et al., 2008):
– the area of alfalfa, improved pasture, tame hay and other
grain cereals reduces by 40, 30, 30 and 15 %, respec-tively (total “freed-up” area: 29 794 ha);
– the berries and vegetable area increases by 100 %
(re-maining “freed-up” area: 25 179 ha);
– of the remaining “freed-up” area, 20, 40 and 40 % is
allocated to potatoes, grain corn and soybeans, respec-tively;
– buffer strips, a legislative requirement, reduce the
in-creased total area of potatoes by 5 %, with this area go-ing into the “other land” category;
– for SLCs 538001, 537002 and 537003, the total area of
potatoes decreases by 6 %, because these SLCs contain fields with steep slopes, and the “freed-up” area is allo-cated equally to tame hay and spring wheat;
– as a consequence of the decrease in perennial forages,
the number of cattle decreases by 10 %; and
– the number of poultry and pigs increases by 30 %.
To calculate RSN for this agricultural adaptation scenario, the 1996 crop yields and N fertilization recommendations of Ontario were used because crop heat units and effective growing degree-days for this year were reported to be sim-ilar than those reported for the 2040–2069 period in PEI (Bootsma et al., 2001). Thus, the agricultural adaptation sce-nario depends on land use, crop yield and N fertilization rec-ommendation changes induced by climate change. As done by De Jong et al. (2008), the RSN model was then run with this scenario to obtain 23 projected RSN values one for each polygon. The N mass was applied on the SLC polygons be-cause RSN values are estimated over these entire polygons. RSN units are provided in kg of N per hectare of farmland area but farmlands are not defined within the SLC polygon. To provide conservative scenarios, it was assumed that the total RSN was nitrified and leached to the aquifer within the year. Moreover, to be compatible with the FEFLOW model, the transformed mass of N applied at the surface of the model was estimated by multiplying the RSN values by the ratio of
farmland area over SLC polygon area. This operation main-tains the total mass of nitrate over the SLC polygon but re-duces the applied rate.
3.4 Numerical groundwater flow and nitrate transport model
The physically based FEFLOW model used to simulate groundwater flow and nitrate transport was divided into eight layers (four layers for each of the two flow systems). The base of the model is deep at 800 m below water table to in-clude the different flow patterns that can develop within the PEI aquifer system (e.g., Tóth, 1963). The flow in the vadose zone was neglected due to the short lag-time response (few days) between precipitations and water table fluctuations. Boundary conditions include constant heads around the Is-land in the first layer, and no flow boundaries in the underly-ing layers to simulate the flow along the saline front around the Island. Constant heads were also applied to rivers on the first layer to represent the hydraulic connection between rivers and the high-flow system. Note that non-pumping con-ditions were considered for the calibration and future sce-narios, as most of the Island is supplied by individual do-mestic wells sparsely spread over the Island (approximately 145 000 inhabitants in 2014, over 5660 km2). The impact of pumping wells on the water table is thus expected to be low (< 2 mm yr−1 based on a daily individual consump-tion of 200 L), except in few localized areas where potable water is supplied by production wells (e.g., Charlottetown). Irrigation water for agriculture and associated return flow were not considered either because rainfall generally sup-plies the needed water demand for crops irrigation. The re-sulting three-dimensional grid contains 4 896 246 six-node prismatic triangular elements with an average element area of 0.0925 km2(with triangle edges of approximately 430 m). The calibration of the FEFLOW model, which is an im-portant step to narrow uncertainty in historical and future groundwater [NO3], was carried out sequentially with three
independent data sets: (1) hydraulic heads measured in do-mestic wells, (2) baseflow-recession curves for the main rivers, and (3) groundwater [NO3] recorded in domestic
wells.
3.4.1 Hydraulic heads calibration
The calibration of the FEFLOW model was first carried out under steady-state conditions with hydraulic head val-ues measured at the time of drilling in more than 700 wells. These wells are domestic water wells, of varying depth, which generally end in the shallow high-flow system. Hy-draulic heads were used to adjust the horizontal and verti-cal hydraulic conductivities within the reported range of val-ues (Table 5) while keeping calibrated groundwater recharge values from the HELP model unaltered. The mean annual groundwater recharge for the 1971–2001 period was used.
Table 5.Field-based and calibrated hydraulic properties of the FEFLOW numerical model for the Prince Edward Island aquifer system.
Model Field Kh Numerical model
layer (m s−1) Kh Kv/Kh Sy n (depth in m) (m s−1) (–) (%) (%) 1 (0–5) 4.5 × 10⁻⁴to 8.1 × 10⁻⁵ 3 × 10⁻⁴ 0.1 1 17 2 (5–10) 1 × 10⁻⁴ 0.1 1 17 3 (10–15) 5 × 10⁻⁵ 0.1 1 17 4 (15–30) 1.7 × 10⁻⁴to 8.4 × 10⁻⁷ 1 × 10⁻⁵ 0.01 1 17 5 (30–80) 1 × 10⁻⁵ 0.001 0.1 17 6 (80–180) n.d. 1 × 10⁻⁶ 0.01 0.1 17 7 (180–380) n.d. 1 × 10⁻⁷ 0.1 0.1 17 8 (380–880) n.d. 1 × 10⁻⁸ 1 0.01 17
Khand Kv: horizontal and vertical hydraulic conductivity, respectively; Sy: specific yield; n: total porosity.
Using a time-averaged recharge value per model cell to repre-sent prerepre-sent-day groundwater recharge conditions is justified by the facts that (1) no significant changing trend is observed in water table elevation at available long-term monitoring well hydrographs over the Island (Rivard et al., 2009), and (2) measured head data were collected over a considerable period of time (> 40 years). A comparison of the observed and predicted hydraulic heads indicates a similar trend with a relatively high correlation coefficient of 88 %, but show a fair amount of scatter and simulated heads slightly underes-timated (Table 4). This is consistent with the fact that the observed head data were measured over several decades and likely reflect transient intra- and inter-annual head variations, which results in large uncertainty in mean head values, which is what the numerical groundwater flow model represents.
3.4.2 Baseflow-recession calibration
Once an acceptable match was obtained under steady-state conditions, the resulting model was used to simulate tran-sient baseflow under recession conditions for the main rivers (Morell, Wilmot, Winter) to estimate specific yield (Table 5). With this procedure, groundwater recharge for the model is set to zero and daily discharge through the river nodes are compared to specific baseflow-recession events extracted from streamflow records. Baseflow-recession events for PEI occur generally at the end of summer during long periods of time without rainfall, when rivers are solely sustained by groundwater. The rate of decline of baseflow-recession curves is sensitive to a specific yield value, which controls the amount of water that can drain from the aquifer to the connected rivers (Mendoza et al., 2003; Sánchez-Murillo et al., 2015). A lower specific yield value is thus associated with a faster drainage of the aquifer. This dynamic is linked with groundwater and nitrate residence times that have a direct impact on the capabilities of the numerical model to predict meaningful groundwater [NO3]. The modeling of
baseflow-recession events shows the best adjustment for a specific
yield value of 1 % (Table 4), which is attributed to the frac-tures in the sandstone aquifer. Note that recession curves are mostly sensitive to the high-flow layers, and specific yield values for underlying layers were progressively lowered to represent the decreasing number of fractures with depth (Ta-ble 5).
3.4.3 Nitrate concentrations calibration
After calibration of the groundwater recharge with HELP and the aquifer system dynamics with FEFLOW through head and baseflow-recession data, the historical mass of N leach-ing to the aquifer was adjusted to match present-day (2000– 2005) [NO3] measured in more than 17 000 domestic wells.
In PEI, intensive agriculture began around 1965 with the in-troduction of chemical fertilizers and has steadily increased since that time. The model of Paradis et al. (2006, 2007) for the Wilmot River watershed has illustrated the considerable time lag between increased leaching of nitrate and the build-up of groundwater [NO3] corresponding to this increased
in-put. This lag time is due to both the large capability of the PEI aquifer system to accumulate nitrate because of the large porosity of the sandstone, and the typically long residence time of groundwater from its recharge to its outflow in rivers. The maximum residence time of the high-flow and the shal-low shal-low-fshal-low systems before discharge to the Wilmot River watershed was up to 20 and 10 000 years, respectively. It can be assumed that a similar situation exists over the entire PEI aquifer system and that groundwater [NO3] is presently not
in steady-state equilibrium with the nitrate leachate that has historically prevailed in watersheds throughout PEI. Conse-quently, the numerical model needs to be run under transient conditions with the historical record of the mass of nitrate reaching the aquifer to ensure realistic predictions of ground-water [NO3]. Because RSN values were only estimated based
on the 5 census years (1981, 1986, 1991, 1996, 2001), no RSN estimate is available prior to 1981. Thus, for the onset of intensive agriculture in PEI from 1965 to 1981, an average
Table 6.Temperature and precipitation changes for the future period (2040–2069) relative to the historical period (1971–2000) for each selected climate change scenarios at the Charlottetown weather station, Prince Edward Island (Qian and De Jong, 2007).
Scenario Temperature change Precipitation change
Monthly Monthly Monthly Days with
mean mean total Precipitation
maximum minimum (%) (%)
(◦C) (◦C) Jan Jul Jan July
Jan Jul Jan Jul
CGCM2-A2 1.7 2.5 4.6 3.1 −5.3 0.0 −2.1 5.0
CGCM2-B2 1.1 1.8 4.0 2.2 −8.1 5.0 −3.8 1.8
HadCM3-A2 1.4 1.8 1.7 2.0 4.1 7.7 −5.0 −4.6
HadCM3-B2 1.2 1.4 1.5 1.5 5.1 1.4 −3.0 −1.9
mass of nitrate representative for this period was adjusted to match observed present-day [NO3]. The estimates of mass of
nitrate leaching to the aquifer based on the last 5 census years were not modified during the calibration process and it was assumed that all available RSN is transferred to the aquifer within the year of application.
As previously demonstrated by Savard et al. (2007), no significant denitrification occurs in the PEI aquifer system, and then only advective-dispersive transport was considered. Groundwater flow and nitrate transport were then run un-der steady-state and transient conditions, respectively, using hydraulic parameters summarized in Table 5. Total porosity needed for the transport simulations were based on average laboratory values (Francis, 1989), whereas the effective dif-fusion coefficient, and longitudinal and transverse dispersiv-ities were 1 × 10⁻⁹m2s−1, 5 and 0.5 m, respectively,
con-sidering typical groundwater flow path lengths (Gelhar et al., 1992).
As reported in Table 4, the average [NO3] measured in
wells generally agrees with the simulated concentration for the SLC polygons for which RSN values are available. Simu-lated concentration is the average [NO3] for the first four
lay-ers representing the high-flow system within which most do-mestic wells are installed. However, the simulated concentra-tion slightly underestimates measurements (approximately 0.5 mg L−1lower), as expected from the procedure of nitrate mass application at the surface of the model previously dis-cussed. Based on the RMS value, the error in groundwater [NO3] predicted by the FEFLOW model is 30 %.
4 Results of modeling
On the basis of the previous calibration results, it is assumed that the FEFLOW model provides a good representation of groundwater flow conditions and nitrate transport in the PEI aquifer system as well as of present-day [NO3] in drinking
water. For the purposes of this study, and knowing the un-certainty about groundwater recharge, hydraulic
conductiv-ity, specific yield, porosity and nitrate mass, consideration will thus be given to the relative changes of future scenarios with respect to the calibrated FEFLOW model.
4.1 Future climate scenarios
The generated future climate scenarios show considerable warming from both GCMs (Table 6), although CGCM2 pro-jected much greater warming than HadCM3 for the Charlot-tetown weather station (Fig. 1). Also, minimum temperature increases more markedly than maximum temperature, and warming under scenario A2 is more noticeable than under B2, as expected from higher CO2emissions. While warming
is expected throughout the entire year (July and January) for all scenarios, changes in precipitation appear uncertain, with total monthly precipitation and number of days with precip-itation increasing or decreasing according to a specific sce-nario or season. Indeed, CGCM2 projects a slight decrease in precipitation for January with the opposite for HadCM3, even though the number of days with precipitation decreases in January for all scenarios. However, the projected July pre-cipitation for 2040–2069 shows an increase or no change rel-ative to the 1971–2000 averages for all four scenarios.
Scenario CGCM2-A2 shows a decrease in precipitation in-tensity during July (summer), as the number of days with precipitation increases and total precipitation remains un-changed. This can thus have an impact on surface runoff because a decrease in precipitation intensity results in less excess water to runoff during rainfall events. The scenario HadCM3-A2 shows on the contrary an increase in precip-itation intensity for July. For January (winter), the surface runoff dynamics is more complex as snowpack thawing and form of precipitation (snow vs. rain) should be taken into ac-count as previously done with the HELP model.
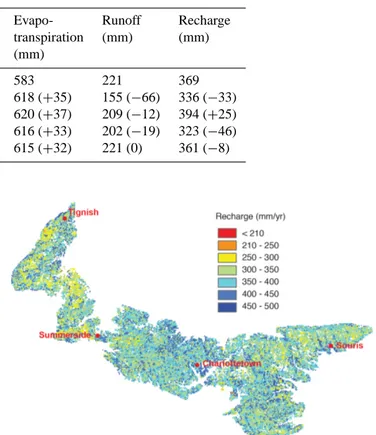
Table 7. Summary of mean annual temperature and hydrologic cycle components (precipitation, evapotranspiration, surface runoff and groundwater recharge) simulated with the HELP model for the historical period (1970-2001) and the four climate scenarios (2040-2069) in Prince Edward Island. Values provided in brackets are the change in mm oroC for the 2040-2069 period compared to historical conditions (1970-2001).
Scenario Temperature Precipitation Evapo- Runoff Recharge
(◦C) (mm) transpiration (mm) (mm) (mm) Historic 5.3 1173 583 221 369 CGCM2-A2 8.0 (+3.31) 1109 (−64) 618 (+35) 155 (−66) 336 (−33) CGCM2-B2 7.0 (+2.3) 1223 (+50) 620 (+37) 209 (−12) 394 (+25) HadCM3-A2 6.7 (+1.4) 1141 (−32) 616 (+33) 202 (−19) 323 (−46) HadCM3-B2 7.1 (+1.8) 1197 (+24) 615 (+32) 221 (0) 361 (−8)
4.2 Hydrologic cycle components and groundwater recharge
Simulation results for the historic period (1970–2001) show that almost 50 % (583 mm) of the annual precipitation is re-turned to the atmosphere by evapotranspiration (Table 7). Another 19 % (221 mm) is flowing to the rivers by sur-face runoff, and 31 % (369 mm) infiltrates the soil down to the sandstone aquifer as groundwater recharge. Moreover, groundwater recharge over the Island varies from 0 mm yr−1 in wetland areas, to 704 mm yr−1 over coarse sand soil (Fig. 4). The standard-deviation for groundwater recharge values is 50 mm yr−1, in accordance with the homogeneity observed at the Island scale for climate as well as for the soil and geology.
For the 2040–2069 period, evapotranspiration values crease for all climate scenarios, as expected from the in-crease in temperature for the same period (Table 7). How-ever, the variation in evapotranspiration is less marked than the variation in temperature. For surface runoff, values are predicted to be unchanged or decreased, with large varia-tions ranging from 0 to 66 mm (Table 7). Those variavaria-tions between scenarios are mainly related to the total precipita-tion available, evapotranspiraprecipita-tion, decrease in precipitaprecipita-tion intensity and snowpack dynamics as previously discussed. Total precipitation and groundwater recharge variations be-tween scenarios follow similar patterns with increased val-ues for the A2 scenarios (CGCM2 and HadCM3) and de-creased values for the B2 scenarios with respect to the his-toric period (Table 7). In general, a decrease in groundwa-ter recharge is expected for the 2040–2069 period (between 2.1 to 12.4 %); only the CGCM2-B2 scenario leads to an in-crease in recharge of 6.7 %.
4.3 Residual soil nitrogen
The components of the N balance were averaged over the 23 SLC polygons in PEI (Table 8). The total amount of N input from fertilizer, manure, leguminous crops and atmo-spheric deposition is 102.3 kg N ha−1yr−1. The outputs
con-Figure 4.Spatial distribution of groundwater recharge from simu-lations with the calibrated HELP infiltration model for the historical period (1970–2001). Cell values are averages for the 1970–2001 pe-riod. Groundwater recharge is not shown for the 2040–2069 period as no significant changes were obtained from HELP based on cli-mate change scenarios.
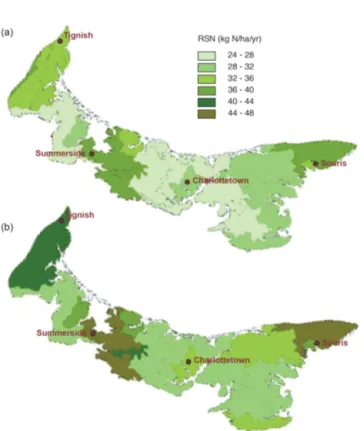
sist in N removed by cropping and gaseous losses, which to-tal 71.5 kg N ha−1yr−1. The province-wide average RSN is therefore 30.8 kg N ha−1yr−1. The spatial variability of his-torical RSN values ranges from less than 25 kg N ha−1yr−1 to approximately 40 kg N ha−1yr−1 according to the local
agricultural management practices (Fig. 5a).
With the agricultural adaptation scenario, N inputs from fertilizer were predicted to increase by 8.4 kg N ha−1yr−1 relative to historical inputs (Table 8). The other inputs from manure, fixation and deposition remained relatively constant. N removal by crop uptake increases by 3.1 kg N ha−1yr−1, and consequently residual soil N at the end of the growing season increases significantly from 30.8 kg N ha−1yr−1 un-der historical management, to 35.7 kg N ha−1yr−1 with the simulated adaptation scenario (16 % increase). The spatial variability of RSN under the adaptation scenario ranges from 28.3 to 46.1 kg N ha−1yr−1(Fig. 5b). The increase in RSN relative to historical data ranges from 10 to 23 %.
Table 8.Average components of the nitrogen balance as simulated with historical crop and animal husbandry practices and with an adapted agricultural management scenario (De Jong et al., 2008).
Period Nitrogen inputs (kg N ha−1yr−1) RSN
Fertilizer Manure Fixation Deposition Crop Gas (kg N ha−1yr−1)
Historical 52.8 17.4 29.6 2.5 70.3 1.2 30.8
Adapted 61.2 16.8 30.1 2.5 73.2 1.6 35.7
RSN: residual soil nitrogen.
Figure 5.Simulated residual soil nitrogen (RSN) using (a) histori-cal management practices and (b) the adaptation scenario presented in Table 8 (De Jong et al., 2008). RSN values are for each Soil Landscape of Canada (SLC) polygon.
4.4 Nitrate concentration evolution simulations
To assess the potential impact of climate change and agricul-ture adaptation in the fuagricul-ture, nine groundwater flow and mass transport simulation scenarios were defined:
– Scenario 1 (Fig. 6b): this is the baseline scenario, which
uses the mean historical groundwater recharge (steady-state flow) and the present-day agricultural practices (steady-state transport with RSN values from the 2001 census) from 2001 until 2069. This scenario is used to assess when aquifer concentrations are reaching steady-state conditions using present-day nitrate mass (equilib-rium between nitrate inputs and outputs from the aquifer system).
– Scenarios 2 to 5 (Fig. 7a–d): these scenarios use the
present-day agricultural practices (steady-state trans-port) in the SLC polygons but their groundwater recharge is based on the values obtained from the four climate scenarios (transient flow). The mass of nitrate applied over the watershed is kept constant for the 23 SLC polygons from 2001 until 2069. This mass rep-resents the mean RSN value from the five past censuses (1981, 1986, 1991, 1996 and 2001). These scenarios combine the impact of aquifer system equilibrium and groundwater recharge change related climate changes on [NO3].
– Scenarios 6 to 9 (Fig. 8a–d): these simulations use the
RSN values modeled for the 2040–2069 period (tran-sient transport) with the four climate scenarios along with the groundwater recharge based on the values ob-tained from these climate scenarios (transient flow). These scenarios combine the impact of [NO3]
equi-librium, groundwater recharge change and agricultural adaptation (land use and climate changes).
For the modeling purposes of this study, the gap between the last year of the calibration period (2001) and the beginning of the scenarios (2040) was then filled with gradual changes in groundwater recharge and RSN values to provide meaningful [NO3] in the future. A linear interpolation between values
established for 2001 and 2040 was thus applied.
Figure 6a presents map of the average [NO3] per
water-shed for the present-day (2001) conditions obtained from the calibrated FEFLOW model. For comparison purposes, modeled groundwater [NO3] were divided into four classes:
background (< 1 mg L−1), low (1–3 mg L−1), medium (3– 5 mg L−1) and high (> 5 mg L−1). These classes are used to emphasize that the model is more indicative of relative spatio-temporal changes in groundwater [NO3] rather than
absolute concentration values. This map shows that the most impacted watersheds are in the center of the Island where most agricultural activities are taking place. Histograms of the number of watersheds in each class reveal that 42 % of the watersheds are in the medium (17) or high (4) [NO3]
classes (Fig. 6a; Table S1 in the Supplement). This obser-vation reflects the critical situation that PEI is in regarding groundwater quality related to nitrate contamination.
Figure 6.Class distribution of simulated mean nitrate concentration per watershed and histogram of the number of watersheds in each class for: (a) present-day (2001); (b) 2050 baseline scenario with present-day (2001) nitrate loading and groundwater recharge.
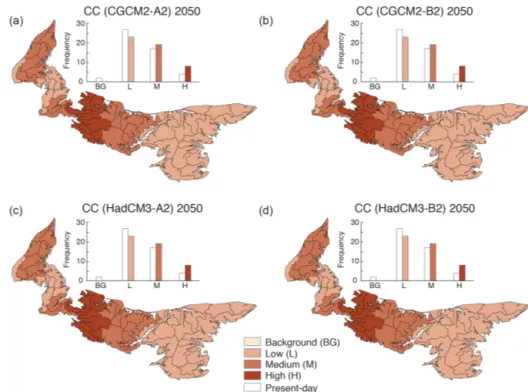
Figure 7.Class distribution of simulated mean nitrate concentration per watershed and histogram of the number of watersheds in each class for the four climate change (CC) scenarios (a, b, c and d).
Note that for simplicity results are presented for 2050 (within the period 2014–2069). Compared to the present-day situation (Fig. 6a), the average increases in [NO3] for the
2050 baseline scenario (scenario 1; Fig. 6b) is 11 % for the Is-land (Table S1). This increase reflects steady-state in ground-water concentration due to gradual loading of nitrate using present-day concentration. Under the 2050 baseline scenario, the average nitrate content of several watersheds moves into a higher concentration class – 50 % to the medium (17) and high (8) classes. The 2050 results show no more watershed at the background level (Fig. 6b; Table S1). Moreover, in the western part of the Island, several watersheds are predicted to reach the higher class, likely due to the longer residence times – i.e., a longer period before reaching equilibrium.
The average increase in groundwater [NO3] over the
Is-land for the four climate scenarios (2–5; Fig. 7a–d) ranges between 11 and 17 % (Table S1) with respect to the present-day scenario (Fig. 6a). The departures from the baseline sce-nario suggest that the impact of groundwater recharge change alone (without the equilibrium effect) on [NO3] is 6 % for
CGCM2-A2 and HadCM3-A2, 4 % for HadCM3-B2, and zero for CGCM2-B2. There is thus also no significant change in [NO3] classes and only two watersheds moving from the
low to the medium class for all climate scenarios (Fig. 7a– d; Table S1). These simulations indicate that modification of the groundwater recharge regime caused by climate change (scenarios 2–5) has less impact on future water quality than reaching equilibrium with current nitrate mass (scenario 1).
Figure 8.Class distribution of simulated mean nitrate concentration per watershed and histogram of the number of watersheds in each class for the four climate change (CC) scenarios with ensuing agricultural practice adaptation (APC) (a, b, c and d).
The Island average concentration for each climate sce-nario integrating the agricultural adaptation scesce-nario (6 to 9; Fig. 8a–d) indicates a nitrate increase between 25 and 32 % (Table S1) relative to the present-day simulation (Fig. 6a). The scenarios with CGCM2-A2 (scenario 6, Fig. 8a) and HadCM3-A2 (scenario 8, Fig. 8c) predict the highest im-pacts with 64 % of the watersheds in the medium (17) or the high (8) class, while the scenario with CGCM2-B2 (sce-nario 7, Fig. 8b) has the lowest impact (58 % in medium or high class). The center of the Island is more strongly affected by high [NO3], as expected from the intensification of
agri-cultural activities for the 2049–2069 period (Fig. 5b). More-over, the comparison of scenarios 6–9 with the baseline sce-nario indicates that changes in agricultural practices (land use and fertilization) and crop yields induced by climate change would have an impact on the increase of average [NO3] of
be-tween 14 and 21 % (Table S1). Thus agricultural adaptation will potentially have a greater effect on future groundwater [NO3] in PEI than groundwater recharge change induced by
climate change (0–6 %) or the reach of [NO3] equilibrium in
the aquifer system (11 %).
5 Discussion
5.1 Comparison with previous studies
De Jong et al. (2008) document the only other study on the assessment of the impact of climate and agricultural practice changes on groundwater quality for PEI. Similar to our study,
they showed that the impact of the projected climate change on N leaching is small compared to the effect of agricultural intensification that could increase soil N leaching well above historical levels. While they showed that there was a reason-able qualitative agreement between simulated N leaching and groundwater [NO3] in domestic wells, the sole simulation
of N movement through the unsaturated zone does not al-low a quantitative assessment of the effect of the aquifer sys-tem dynamics on [NO3] in groundwater. Nevertheless, their
simulations of N movement on a daily basis during the non-growing season indicated that a few percent of the RSN was not reaching groundwater each year. On average, for all SLC polygons, 91 % of the RSN was indeed lost via soil leaching, with a range from 87 to 96 % over the Island. In comparison, we assumed that 100 % of the RSN was reaching the aquifer system each year. On the other hand, De Jong et al. (2008) neglected N leaching during the growing season, which is contradicted by the findings of Savard et al. (2010) and Bal-lard et al. (2009), which showed important input of nitrate in groundwater throughout the year, including during the grow-ing season.
The results obtained for PEI can also be compared to those reported by Ducharne et al. (2007) for the Seine Basin (France). The main findings of this study are indeed similar to those obtained for PEI. First, the dynamics of the aquifer system of the Seine Basin leads to an important increase in future [NO3]. This increase is however at least twice the
per-centage obtained for PEI by 2050, which suggests that the residence time of nitrate in the PEI aquifer system is shorter
and it could equilibrate faster to a change in nitrate mass. This could be explained by the different geology between the two aquifer systems. For the Seine Basin, the influence of climate on groundwater recharge also has a minor impact on the increases of future [NO3], as indicated by small to
moderate decreases in river low flows (baseflow), so the rea-son why climate change leads to higher [NO3] in
groundwa-ter is the increased nitrate leaching from the soils. This in-creased leaching is mainly related to enhanced crop biomass and yield as well as soil N mineralization (this process was not considered in our study). In our study, the increased ni-trate leaching results from larger agricultural land, increased fertilizer use and higher crop yield. Thus, future studies in PEI should include a comprehensive simulation of nitrate movement through the unsaturated zone with a consideration of soil N mineralization to be more representative of actual and future agricultural conditions.
5.2 Assessing model uncertainty through calibration
In this study, the proposed workflow includes numerous modeling steps, which involve many hypotheses and concep-tual choices. While a sensitivity analysis could be made on each of the many model parameters to quantify and prop-agate the uncertainty on groundwater [NO3] predictions, the
strength of our approach is rather to capitalize on known con-ditions that are used in a comprehensive calibration approach that constrains the possible range of model parameters. As reflected in Fig. 9, [NO3] in groundwater depends on the
mass of nitrate combined with the amount of water reach-ing the water table and the mixreach-ing of that infiltration with the flowing groundwater. Obviously, different combinations of nitrate mass, recharge and water flux could lead to the same [NO3], and at least two of the three parameters need to
be independently calibrated to obtain meaningful predictions of [NO3] in groundwater. For this study, the flux of water
coming from the surface (groundwater recharge) and flow-ing within the aquifer system were carefully calibrated with river baseflow and groundwater hydraulic head data. How-ever, the mass of nitrate applied at the soil surface through RSN estimates was more uncertain at the scale investigated, and measurements in wells were instead used to calibrate [NO3] in groundwater. Thus, the estimated mass of nitrate
and flux of water (recharge and within the aquifer system) are likely representative of the actual conditions in PEI, and the performance of the FEFLOW model to predict [NO3] in
groundwater could be used to quantify the uncertainty prop-agated during the modeling process.
5.3 Assessing uncertainty in future predictions
Uncertainties in the projections related to climate models and forcing scenarios could be large, although the objectives of this study were to develop methodologies for assessing cli-mate change impacts on groundwater [NO3] and demonstrate
Figure 9.Schematic of the constraints exerted by conditions con-sidered (in blue) in the calibration of model parameters for the simulation of processes controlling groundwater nitrate concentra-tion (NO3mass leached and water fluxes, including recharge and
groundwater flow).
their application in PEI. Projected climate changes by the two state-of-the-art GCMs, CanESM2 (Arora et al., 2011) and HadGEM2 (Johns et al., 2006; Martin et al., 2006), from the same climate modeling centers as CGCM2 and HadCM3, are presented in Table S2 under the Representative Concentra-tion Pathways (RCP) 4.5 and 8.5. The projected temperature changes are larger in these new simulations. It is also noticed that an increase in July precipitation by over 20 % was pro-jected with little change or a decrease in the number of rainy days. Such changes could indicate increased precipitation in-tensity.
As reported by De Jong et al. (2008), N leaching in PEI is however considerably less sensitive to increases in daily pre-cipitation than to decreases. For instance, a 15 % increase in annual precipitation resulted in a 2.5 % increase in N leach-ing, which is likely due to the high level of soil water satu-ration throughout much of the year in this temperate-humid climate. Thus, increased precipitation intensity could not re-sult in a significant increase in N leaching to the aquifer sys-tem because much of the excess water will drain as surface runoff. Nevertheless, the projected groundwater [NO3] under
these new climate scenarios might differ from those based on CGCM2 and HadCM3 and uncertainties in the projections should be taken into account when results are used to develop adaptation strategies and policies.
Finally, while we considered only a single “worst case” agricultural adaptation scenario, it should be understood that this scenario was designed to explore the upper limits of potential future conditions. Thus, any adaptation strategy (e.g., better agricultural practices) will have to make sure that such an upper limit it not actually reached. This study thus serves as an indicator of the magnitude of the reduction needed on N leaching by agricultural adaptation strategies to counteract the projected increase in [NO3] in groundwater.
![Figure 3 presents the general workflow followed to model the evolution of [NO 3 ] in groundwater of the PEI aquifer system,](https://thumb-eu.123doks.com/thumbv2/123doknet/2950497.80232/6.918.481.838.104.541/figure-presents-general-workflow-followed-evolution-groundwater-aquifer.webp)