HAL Id: hal-00296065
https://hal.archives-ouvertes.fr/hal-00296065
Submitted on 25 Oct 2006
HAL is a multi-disciplinary open access
archive for the deposit and dissemination of
sci-entific research documents, whether they are
pub-lished or not. The documents may come from
teaching and research institutions in France or
abroad, or from public or private research centers.
L’archive ouverte pluridisciplinaire HAL, est
destinée au dépôt et à la diffusion de documents
scientifiques de niveau recherche, publiés ou non,
émanant des établissements d’enseignement et de
recherche français ou étrangers, des laboratoires
publics ou privés.
in presence of sea salt
G. Myhre, A. Grini, S. Metzger
To cite this version:
G. Myhre, A. Grini, S. Metzger. Modelling of nitrate and ammonium-containing aerosols in presence
of sea salt. Atmospheric Chemistry and Physics, European Geosciences Union, 2006, 6 (12),
pp.4809-4821. �hal-00296065�
www.atmos-chem-phys.net/6/4809/2006/ © Author(s) 2006. This work is licensed under a Creative Commons License.
Chemistry
and Physics
Modelling of nitrate and ammonium-containing aerosols in presence
of sea salt
G. Myhre1,2, A. Grini1, and S. Metzger3
1Department of Geosciences, University of Oslo, Oslo, Norway
2Center for International Climate and Environmental Research-Oslo, Oslo, Norway
3Max-Planck-Institute for Chemistry, Department of Atmospheric Chemistry, Mainz, Germany
Received: 4 November 2005 – Published in Atmos. Chem. Phys. Discuss.: 22 February 2006 Revised: 21 September 2006 – Accepted: 19 October 2006 – Published: 25 October 2006
Abstract. A thermodynamical model for treatment of gas/aerosol partitioning of semi volatile inorganic aerosols has been implemented in a global chemistry and aerosol transport model (Oslo CTM2). The sulphur cycle and sea salt particles have been implemented earlier in the Oslo CTM2 and the focus of this study is on nitrate partitioning to the aerosol phase and if particulate nitrate is expected to form in fine or coarse mode aerosols. Modelling of the forma-tion of fine mode nitrate particles is complicated since it de-pends on other aerosol components and aerosol precursors as well as meteorological condition. The surface concen-trations from the model are compared to observed surface concentrations at around 20 sites around Europe for nitrate and ammonium. The agreement for nitrate is good but the modelled values are somewhat underestimated compared to observations at high concentrations, whereas for ammonium the agreement is very good. However, we underscore that such a comparison is not of large importance for the aerosol optical depth of particulate nitrate since the vertical profile of aerosol components and their precursors are so important. Fine mode nitrate formation depends on vertical profiles of both ammonia/ammonium and sulphate. The model results show that fine mode particulate nitrate play a non-negligible role in the total aerosol composition in certain industrialized regions and therefore have a significant local radiative forc-ing. On a global scale the aerosol optical depth of fine mode nitrate is relatively small due to limited availability of am-monia and loss to larger sea salt particles. Inclusion of sea salt in the calculations reduces the aerosol optical depth and burden of fine mode nitrate by 25% on a global scale but with large regional variations.
Correspondence to: G. Myhre ([email protected])
1 Introduction
The chemical composition of aerosols has been investigated strongly over the last decade (Jaffe et al., 2005; Lelieveld et al., 2002; Malm et al., 2004; Novakov et al., 1997; Park et al., 2004; Putaud et al., 2004; Quinn and Bates, 2005; Ra-manathan et al., 2001) and given significant improvements in the insight in their complex variations. The focus on anthropogenic effects from aerosols started with sulphate aerosols and thereafter carbonaceous aerosols. Inorganic par-ticulate nitrate constituents a non-negligible fraction of the total aerosol mass in industrialized regions (Adams and Sein-feld, 2002; Hueglin et al., 2005; Jaffe et al., 2005; Malm et al., 2004; Marinoni et al., 2005; Park et al., 2004; Putaud et al., 2004). Over Europe particulate nitrate accounts for about 10–20% of the total dry aerosol mass (Putaud et al., 2004). Particulate nitrate constitutes a substantial larger fraction in urban areas than in remote areas (Hueglin et al., 2005; Malm et al., 2004; Putaud et al., 2004). The measurements show also a significant seasonal variation in the nitrate abundance (Hueglin et al., 2005; Jaffe et al., 2005). There are indica-tions that nitrate has increased over the last years or at least the relative importance of nitrate, based on deposition data (Evans et al., 2001; Sopauskiene et al., 2001; Stoddard et al., 1999). The large reduction of SO2over Europe and thus sulphate aerosols over Europe gives less acidic aerosols and allows for larger partitioning of nitrate to the aerosol phase.
In the global aerosol intercomparison study AERO-COM (http://nansen.ipsl.jussieu.fr/AEROAERO-COM/) altogether 16 aerosol models participate having the 5 major aerosol components included (sea salt, mineral dust, sulphate, black carbon, and organic carbon) (Kinne et al., 2006; Textor et al., 2006). A more difficult task than modelling these aerosol components in the atmosphere is to model semi-volatile com-ponents, such as secondary organics and nitrate. For particu-late nitrate some few model studies of its global distribution exists (Adams et al., 2001, 1999; Jacobson, 2001; Martin et
al., 2004; Metzger et al., 2002a). A large problem when mod-elling aerosol concentration of semi volatile compounds is that their saturation vapour pressure is dependent on aerosol composition and temperature. A further complicating factor is that aerosols are size distributed. It is therefore not suffi-cient to find equilibrium vapour pressures for semi volatile gases over a total aerosol mixture. A model for semi volatile aerosols should accurately predict partition between different size classes and mass transfer through condensation to each aerosol size. Therefore, to model nitrate aerosol a detailed description of the tropospheric gaseous chemistry and at least sulphate, ammonia, and sea salt aerosols is important. The saturation vapour pressure of HNO3 is strongly dependent on temperature. The issue of the importance of sea salt for the size of the particulate nitrate has been neglected in ear-lier studies. In global radiative forcing simulations of nitrate aerosol the studies of Adams et al. (2001); Jacobson (2001); Liao and Seinfeld (2005); Liao et al. (2004); van Dorland et al. (1997) found very different results (−0.22, −0.07, −0.16, −0.14, −0.03 Wm−2, respectively). The difference can be illustrated by Jacobson (2001) placing more than 90 % of his 0.38 Tg of nitrate in the coarse mode based on observa-tion data (his Table 2b) whereas Adams et al. (2001) put all of their 0.45 Tg of nitrate in the accumulation mode based on absence of a coarse mode in their model. These differ-ences show that physically based estimates of the size dis-tribution of aerosol nitrate are important for calculating its radiative forcing. These initial studies of nitrate show that depending on whether nitrate is in the fine or coarse mode decides whether nitrate has a negligible radiative forcing or not. In a recent and more detailed study of aerosol ther-modynamics Martin et al. (2004) found that burden and ra-diative forcing of nitrate was about 10–15% those of sul-phate. Martin et al. (2004) also take into account formation of solids. They find that the combined radiative forcing of the nitrate/ammonia/sulphate aerosol changed by approximately 25% depending on whether the upper side or the lower side of the hysteresis loop controlling water uptake of the aerosol was used. In two other detailed studies (Liao and Seinfeld, 2005; Liao et al., 2004) sea salt was included in the simula-tions, but the effect of sea salt on nitrate was only to some extent quantified. In their simulations sea salt over land may contribute to accumulation type (fine mode) particles, since equilibrium calculations are made for sulfate, ammonium, nitrate, sea salt, and water in an internal mixture. Further in Liao and Seinfeld (2005) it was found that heterogeneous reaction on various aerosols strengthen the radiative forcing by 33% due to particulate nitrate, mainly as a result of lower sulphate amount. The lower sulphate was a result of hetero-geneous reactions reducing the SO2concentration.
In this study we use a global aerosol and chemistry trans-port model to calculate the distribution of nitrate aerosols. Calculations of chemical equilibrium are used to partition ammonia and nitrate between the gas phase and the aerosol phase. A simple concept for mass transfer of nitrate between
fine mode and coarse mode is introduced. The reason for separating between two size classes is that particulate nitrate mostly impacts the radiative forcing when it appears in the fine mode.
2 Methods
2.1 Global transport model description
We use the Oslo CTM2 model to describe transport and pho-tochemical reactions in the global atmosphere. This model is an off-line chemical transport model that uses pre-calculated meteorological fields to simulate tracer distributions in the at-mosphere. In this study forecast data from European Centre for Medium-Range Weather Forecasts (ECMWF) have been used. For this study, meteorological data for 2000 in T42 (2.8×2.8 degrees) and 40 layers are used. The advection of chemical species is calculated by the second order moment method, which is able to maintain large gradients in the dis-tribution of species (Prather, 1986). Vertical mixing by con-vection is based on the surplus and deficit of mass flux in a column (Tiedtke, 1989). Turbulent mixing in the boundary layer is treated according to the Holtslag K-profile scheme (Holtslag et al., 1990).
The original chemistry scheme (Berntsen and Isaksen, 1997) calculates the mixing ratios of 51 tracers in the global atmosphere including OH, Ozone, NOx and hydrocarbons. The model has recently been expanded to include the sul-phur cycle (Berglen et al., 2004). The sulsul-phur scheme in-cludes five species and is coupled with the oxidant chemistry in the global model. Sea salt is simulated using the scheme of Grini et al. (2002).
Emissions of ammonia follow Bouwman et al. (1997) where the most important sources for ammonia are excreta from domestic animals and use of synthetic fertilizers. The total global emission for 1990 is estimated to 54 Tg N yr−1. The emissions from biogenic sources are weighted by num-ber of sunlight hours. Adams et al. (2001) propose to weight the emissions by number of sunlight hours to the power of four. Given the very strong seasonal cycle this would give we chose to only weight the emissions linearly. The choice of seasonal cycle largely influences the results since in our model nitrate mostly forms in winter when it is cold, and therefore more emissions in winter gives more aerosol ni-trate. To our knowledge, no global emission dataset with NH3with a seasonal cycle exist. Emissions of SO2and NOx follow Berglen et al. (2004) and use anthropogenic emission with reference to year 1996 of 67 Tg S yr−1 and 34 Tg N yr−1, respectively.
2.2 Equilibrium partitioning of particulate nitrate
Chemical equilibrium between the inorganic compounds is simulated using the Equilibrium Simplified Aerosol model (EQSAM) model (Metzger et al., 2002b; Metzger, 2000).
EQSAM assumes that aerosols are internally mixed and obey thermodynamic gas/aerosol equilibrium. These as-sumptions are accurate under most atmospheric conditions considering the 15 minute time step used in the Oslo CTM2. EQSAM predicts gas/aerosol partitioning at chemical equi-librium in the NH+4/Na+/SO2−4 /NO−3/Cl−/H2O system. Min-eral cations and organic acids were not considered in this study; we refer to Metzger et al. (2006). The aerosols are assumed to be metastable in our study, thus we do not take into account formation of solids. This assumption was tested by Metzger et al. (2002a) who compared full hysteresis cal-culations to metastable calcal-culations and found small differ-ences between the two calculations due to the fact that most aerosols actually were on the upper side of the hysteresis loop in the boundary layer.
Since solving all equations of the equilibrium between inorganic salts and their equilibrium partitioning between gas and aerosol phase is computationally expensive, several models have divided the domain into subgroups based on the acidity of the system (Nenes et al., 1998). Based on the am-monium to sulphate ratio, EQSAM calculates the preferred state of sulphate as H2SO4, NH4HSO4, (NH4)2SO4or a mix-ture of these. Excess or “free” NH3is the total amount minus the ammonium needed for the preferred sulphate state. This free ammonia is available to partition to the aerosol phase together with nitrate.
At high relative humidity (RH), the aerosols contain more water. This additional water decreases the acidity of the aerosols. EQSAM allows this to influence the partitioning of nitrate through changing the activity coefficients. Since the activity coefficients are closer to one at higher RH this will allow for more nitrate to be dissolved in the aerosol at high RH. Metzger et al. (2002b) compared EQSAM to the much used thermodynamic model ISORROPIA (Nenes et al., 1998) and other thermodynamic models and found that it gave similar results for nitrate partitioning when applied under similar condition.
In the atmosphere ammonia will partition at high RH to aqueous aerosols through
NH3(g) ↔ NH3(aq) ↔ NH4++OH− (1) On the same time, HNO3will partition through
HNO3(g) ↔ HNO3(aq) ↔ NO−3 +H +
(2) Thus it can be seen that in acidic conditions (H+is high and OH−is low), NH3will partition to the aerosol phase. In basic conditions (H+is low and OH−is high), HNO3will partition to the aerosol phase.
In addition gaseous ammonia and nitric acid partition in to the aerosol phase depending on the temperature depen-dent equilibrium constant and deliquescence relative humid-ity (RHD) of ammonium nitrate and the RH through A) if RH<RHD
NH3(g) + HNO3(g) ↔ NH4NO3(s) (3)
B) if RH>RHD through
NH3(g) + HNO3(g) ↔ NH4NO3(aq) (4)
NH4NO3(aq) ↔ NH+4(aq) + NO−3(aq) (5)
Reactions (3–5) are well known as neutralization reactions which can lead to an effective partitioning of gaseous am-monia and nitric acid in to the aerosol phase at any RH, especially under cold and humid conditions, while Reac-tions (1) and (2) only take place at dilute soluReac-tions, i.e. in case of high RH (>90%) with sufficient aerosol water; Re-action (3) describes gas/solid phase equilibria which leads to the formation of pure solid ammonium nitrate, and Reac-tions (4) and (5) gas/aqueous phase equilibria. In this study only Reactions (4) and (5) were considered as they dominate the gas/aerosol partitioning in terms of aerosol mass that was formed by ammonium nitrate – both NH3emissions and hu-midity peak in the relatively well mixed boundary layer.
However, in nature, aerosol nitrate is not only associated with ammonium. For example, Lefer and Talbot (2001) found that when measuring aerosol composition in an acidic environment, 86% of the nitrate mass had aerodynamic di-ameter larger than 1 µm. This implied that aerosol nitrate was associated with Ca2+from basic soil particles. Not only Ca2+can be associated with atmospheric nitrate. Also the presence of Mg2+, Na+and K+can result in aerosol nitrate. Metzger et al. (2006) found that inclusion of all these ions and organic acids further improved the understanding of ni-trate partitioning.
The version of EQSAM used here, differs from the ver-sion published in Metzger et al. (2002b) since Na+and Cl− are taken into account. In the current version, HCl can thus evaporate to the gas phase during chemical equilibrium be-tween sea salt and HNO3. As shown by Metzger et al. (2006), however, future model studies should include also the effect of Mg2+/Ca2+ from mineral dust and organic acids on the gas/aerosol partitioning.
2.3 Mass transfer between gas phase and aerosol phase
In global models of aerosol chemical equilibrium of semi volatile gases, mass transfer has often been ignored since it is too expensive (Adams et al., 2001). However, when cal-culating aerosol nitrate, it has to be taken into account since nitrate can condense both on fine and coarse aerosols, and we need some estimation of this process to estimate the radia-tive forcing. To simplify, we chose to represent the aerosol by a fine mode, comprised by sulphate, and a coarse mode comprised by sea salt, and sulphate and sea salt do not in-teract through chemical equilibrium. From here on we will refer to the mode comprised by sulphate as “fine mode” and the mode comprised by sea salt as “coarse mode”. This is a great simplification since sulphate can exist in coarse mode, and sea salt in fine mode. However, we chose to separate the aerosols this way to allow for the simple treatment of
mass transfer introduced later. This solution is an interme-diate solution between treating all aerosols (independent of size) in the same equilibrium calculation and calculating de-tailed mass transfer through condensation to several size sec-tions as done for example by Pilinis et al. (2000). The fine mode particles have a standard accumulation size (Sect. 2.4) whereas the coarse mode follows the size distribution of sea salt with most of the mass above radius of 1 µm.
Gaseous HNO3and NH3can condense on any of the two modes. In each time step photochemistry is first solved and H2SO4and HNO3are generated. All H2SO4is assumed to exist in the fine mode. In the atmosphere sulfate can con-dense on any of the two modes and not only on the fine mode as done in our model. Also, aqueous phase production of sulphate can occur in cloud droplets which are activated sea salt particles or in sea salt particles directly (Sievering et al., 1992). Quinn and Bates (2005) reported results for size-segregated chemical composition for six large aerosol campaigns taken place over ocean and coastal regions in dif-ferent areas of the world. They found that almost all of the mass of non-seasalt sulfate was in the fine mode and that in the supermicron (coarse mode) very small amount of non-seasalt sulphate were present. Their results give confidence to our assumption of a fine sulphate mode and a coarse sea salt mode as a reasonable treatment.
After photochemistry, the thermodynamic equilibrium is solved twice by the package of Metzger et al. (2002a). First, the fine mode has a chance of reaching chemical equilibrium. This mode is solved first because the smaller particles reach equilibrium faster than the larger ones (e.g. Capaldo et al., 2000; Wexler and Seinfeld, 1990). Any excess ammonia as defined in Sect. 2.2 will be able to partition to the small par-ticles together with HNO3. After the small particles are in equilibrium, the concentrations of gaseous HNO3 and NH3 are updated and for the coarse mode equilibrium is calcu-lated. HNO3reacts with sea salt following the equation NaCl(aq) + HNO3(g) ↔ NaNO3(aq) + HCl(g) (6) Thus sea salt depletes the HNO3 gas concentrations. Our formulation ignores the formation of stable Na2SO4salts fol-lowed by evaporation of HCl and change of particle acidity which could be the result if sea salt and sulphate would be treated in equilibrium together.
The source of HNO3is the photochemistry. Meng and Se-infeld (1996) showed that the time scale to reach overall equi-librium in the gas phase is decided by the particles for which the transport time is smallest (i.e. the smallest aerosols). Fur-ther they defined a timescale for the overall system to reach equilibrium. This timescale is longer since it involves equili-bration of the larger aerosols with the gas phase.
In our formulation we first let the fine mode equilibrate with gas, and thus let the smallest mode drive the gas phase to equilibrium before the coarse mode is allowed to “see” the new gas. This would happen within the 15 min timescale of the chemistry/equilibrium timestep for most conditions. We
chose to also let the coarse mode reach equilibrium (however only after the fine mode). This choice is somewhat question-able since the timescale for the coarse mode aerosols to reach equilibrium can be order of hours which is longer than the time step of the model.
Therefore it is probable that the coarse mode is influenc-ing the gas phase too rapidly when it in turn is allowed to equilibrate. In their simulations, Meng and Seinfeld (1996) found that on longer time scales, when NH3/HNO3started to condense on the larger aerosols, their gas phase concen-trations decreased something which drove some of the con-densed matter from the small semi-volatile aerosols back to the gas phase. This could happen already in the next timestep in our model if the coarse mode depletes HNO3too much. In that sense, our results can be sensitive to the timestep when sufficient seasalt is present. This is in particular true in re-gions where there is both nitrate and seasalt present.
A fix to this problem would be to implement a kinetic for-mulation for the particles which have long equilibrium time scale. This was done by Capaldo et al. (2000). However we decided that implementing explicit kinetics in a global model would be too complex. The CPU time when calling the equilibrium module twice is already quite heavy. Our main goal of splitting into two modes is to avoid Na2SO4 formation which would have been predicted if all species had been treated together in one equilibrium calculation indepen-dent of size.
Fine mode NO−3 is controlled by the following factors:
– Production of HNO3in the photochemistry
– Availability of NH3/NH4
– Temperature since the equilibrium vapour pressure of
HNO3is only sufficiently low at low temperatures.
– Depletion of HNO3on the sea salt aerosols.
– Relative humidity
All aerosol species follow the loss processes of their “con-trolling species” in their aerosol mode, that is: All ”fine mode” species have the same wet and dry deposition as sul-phate (Berglen et al., 2004) whereas all coarse species have the same loss rates due to wet and dry deposition as the mass-averaged loss rate of sea salt (Grini et al., 2002). Dry depo-sition of NH3follows Sorteberg and Hov (1996). Due to the large Henry’s law coefficient of NH3, NH3is taken up at the ground more easily than NH4. Washout of NH3is done ac-cording to it’s Henry’s law coefficient.
2.4 Optical properties of nitrate particles and radiative transfer calculations
In the radiative transfer calculations particulate nitrate is as-sumed to exist as ammonium nitrate. The fine mode am-monium nitrate particles are assumed to have a lognormal
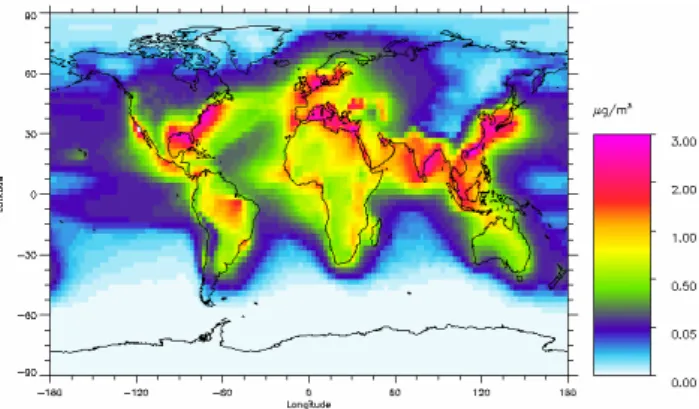
Figure 1: Global distribution of annual mean fine mode surface concentration of nitrate
(µg(NOFig. 1. Global distribution of annual mean fine mode surface con-3)m-3). Note that the scale is nonlinear.
centration of nitrate (µg (NO3)m−3). Note that the scale is
nonlin-ear.
size distribution with geometric mean radius of 0.05 µm and standard deviation of 2.0. Refractive indexes are in lack of wavelength dependent available data assumed to be the same as for ammonium sulphate. The hygroscopic growth of ammonium nitrate is larger than for ammonium sulphate and is modelled according to Fitzgerald (1975). It is earlier shown that the hygroscopic growth described for sulphate in Fitzgerald (1975) is within 2–3% of using the K¨ohler equa-tion with respect to radiative forcing due to sulphate (Myhre et al., 2004). The coarse mode nitrate gives an additional mass since the molecular weight of NO−3 is larger than the molecular weight of Cl−(see Eq. 1). However, also the den-sity, refractive indices, and hygroscopic growth changes with NaNO3instead of NaCl. To investigate the potential impact of coarse mode nitrate aerosols we have adopted density and refractive indices (scaled by information at one wavelength) for NaNO3(Lide, 1991) and NaCl. The hygroscopic growth for NaNO3is modelled based on Fitzgerald (1975).
We assume in the optical property calculations that the fine mode nitrate particles are external mixtures. However, the more realistic situation with internal mixture with other scat-tering aerosol components in the fine mode would only to a small extent influence the optical properties. Such an inter-nal mixture would impact the hygroscopic growth and could impact the size of the particles, where the latter is shown to be a small effect as long as the particles are fine mode (Myhre et al., 2004). Our approach with distinct classes for fine and coarse mode particulate nitrate is important with re-spect to that we can distinguish their optical properties which are quite different for fine mode nitrate and sea salt contain-ing nitrate particles.
The radiative transfer calculations are performed with a multi-stream model using the discrete ordinate method (Stamnes et al., 1988). In addition to the aerosols it is taken into account absorption by gases, Rayleigh scattering, and scattering of the clouds in the simulations (Myhre et al., 2002). The meteorological data used is the same as in the global aerosol and chemistry model.
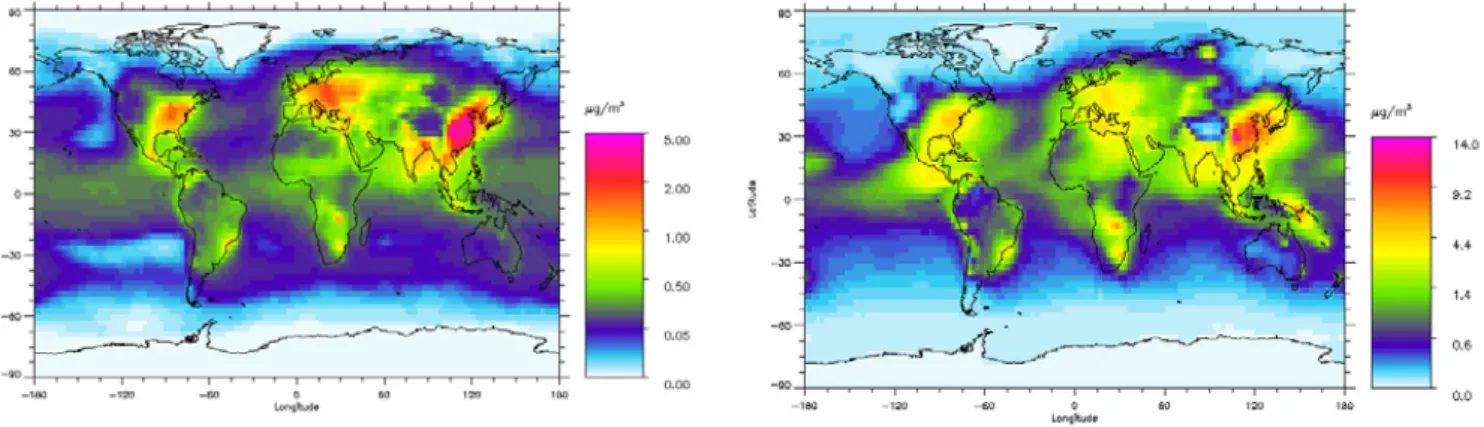
Figure 2: Global distribution of annual mean coarse mode surface concentration of
nitrate (µg(NO3)m-3). Note that the scale is nonlinear.
Fig. 2. Global distribution of annual mean coarse mode surface
concentration of nitrate (µg (NO3)m−3). Note that the scale is nonlinear.
3 Results
3.1 Surface concentrations
The annual mean surface concentration of fine mode partic-ulate nitrate particles is shown in Fig. 1. Maximum con-centrations are found over China, with also high concentra-tions in other industrialized regions. Outside the industrial-ized regions the nitrate aerosol concentration at the surface is very low. In the Oslo CTM2 the difference in surface concentration compounds between the highly industrialized and background land areas or oceanic region is smaller for other aerosol than for particulate nitrate particles. Particu-late nitrate has thus a larger gradient in concentration from urban and rural to natural areas than other aerosols of in-dustrial origin, which is in accordance with measurements (Putaud et al., 2004). Also in accordance with measurements for the seasonal variation (Hueglin et al., 2005; Jaffe et al., 2005), we get larger concentrations during the winter than during the summer due to the increase in saturation pressure of HNO3with temperature.
The pattern of the surface concentration of fine mode ni-trate is in very good agreement with observation distribu-tion established in Malm et al. (2004) based on observadistribu-tions from 143 sites, except that the model has a very weak sec-ondary maximum in the southern California. The general high values in the north east of USA with a maximum south of Chicago and the general low values in the north western USA are well reproduced. The magnitude of the modelled annual mean surface concentrations are also in good agree-ment with the measureagree-ments, note here that results in Malm et al. (2004) is given for NH4NO3. We obtain annual average concentrations of approximately 1–2 µg m−3nitrate close to the surface in the eastern US. Measurements (e.g. Lefer and Talbot, 2001) indicate that this area mostly contains acidic aerosols and therefore, fine mode nitrate should not be im-portant in our model in this region. We explain this by not-ing that this is annual average concentrations. Even though
Figure 3: Global distribution of annual mean fine mode surface concentration of ammonium
(µg(NH
4)m
-3) in the left panel and the annual mean fine mode surface concentration of sulphate
(µg(SO
4)m
-3) in the right panel. Note that the scales are nonlinear
Fig. 3. Global distribution of annual mean fine mode surface concentration of ammonium (µg (NH4)m−3)in the left panel and the annual
mean fine mode surface concentration of sulphate (µg (SO4)m−3)in the right panel. Note that the scales are nonlinear.
on average, the aerosols in the eastern U.S. are acidic, there are probably days where total ammonia concentrations are high. We also note that aerosol nitrate can form in our model even though the aerosols are not completely neutralized to (NH4)2SO4, in particular at cold temperature (see Sect. 2.2). Over Europe surface concentration of fine mode nitrate of up to 2 µg m−3is modelled. In Putaud et al. (2004) results from urban and kerbsite locations shows mostly concentrations of 2–3 µg m−3and in one case up to 8 µg m−3. Note here that these results are point measurements inside large cities and with the global model with a resolution of 2–3 degrees are not able to reproduce these variations. Measurements in ru-ral and naturu-ral sites for nitrate are much lower than in the urban areas. The coarse mode surface nitrate (taken as dif-ference between PM10 and PM2.5 and correspond not di-rectly to our coarse mode) in Putaud et al. (2004) is mostly around 1 µg m−3in reasonable agreement with the model re-sults (see Fig. 2).
The distribution of the surface concentration of ammo-nium and sulphate (Fig. 3) has many similarities but differ mostly over remote oceanic region (due to DMS) and in re-gions with volcanoes. The pattern of these two surface con-centrations has similarities to the fine mode nitrate surface concentration over the industrialized regions. However, over ocean the model gives almost no fine mode nitrate, so all ammonium is associated with sulphate. Measurements over polluted areas in Europe (Putaud et al., 2004) shows am-monium surface concentration mostly around 2–3 µg m−3, slightly larger than in the model. Whereas sulphate concen-trations in the same polluted areas of typically 5–7 µg m−3 are found. A more detailed comparison is made in Berglen et al. (2004) for sulphate with reasonably good agreement.
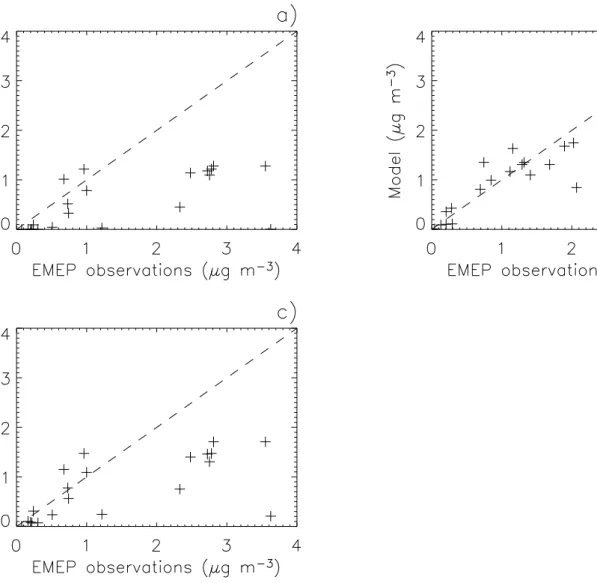
Figure 4 shows comparison of the surface concentrations from 20 EMEP stations (PM2.5) in Europe with the Oslo CTM2 model for fine mode nitrate and ammonium. For ni-trate an additional panel is added for nini-trate to show nini-trate associated with sea salt with radius less than 1–1.5 µm in addition to the particles associated with fine mode
ammoni-umnitrate. In the figure it should be noted that linear axis’s are used so the agreement in general is good for nitrate and very good for ammonium. In Fig. 4c when the nitrate as-sociated with sea salt is taken into account the agreement with observations improves but still the model underestimate the high observed values. However, a good agreement as found in Fig. 4 may be somewhat fortunate since we com-pare model result with a resolution of 2–3 degrees with point measurements for aerosol components that have large spatial variations.
3.2 Vertical distribution of nitrate aerosols and limitations in production of nitrate aerosols
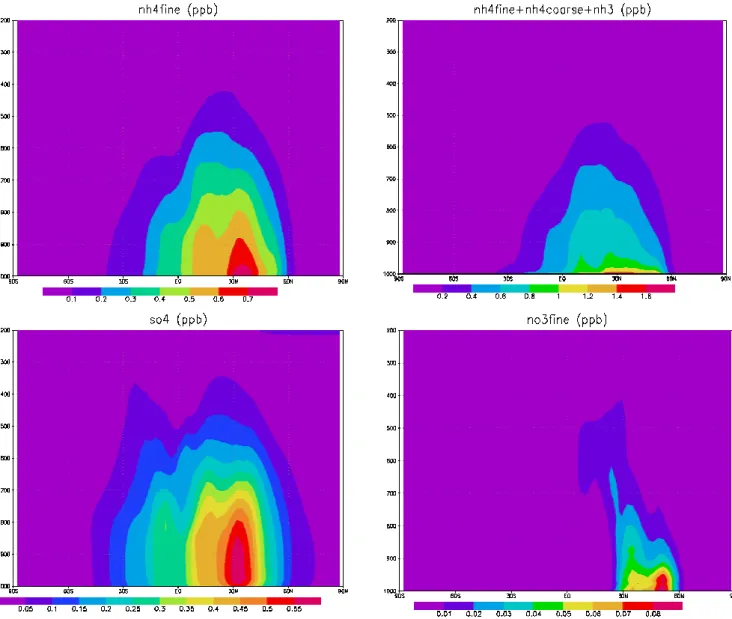
There are two necessary conditions for formation of fine mode aerosol nitrate in our model: 1) Temperature has to be low enough for HNO3to condense to the aerosol phase, and 2) There has to be excess ammonia as defined in Sect. 2.2. In the model, the first condition is satisfied in the free tro-posphere where temperatures are low. The second is most often satisfied near the ground. The reason for this is that sulphate is produced in the free troposphere through both aqueous and gaseous reactions whereas the only source for NH3/NH4is ground based emissions. Therefore, a condition for efficient production of fine mode particulate nitrate is ef-ficient transport of ammonia to the free troposphere. Adams et al. (2001) calculated 3 times higher burden of nitrate than their earlier study (Adams et al., 1999), and that the main part of the increase was in the free troposphere. The main differ-ence between the two studies was 20% higher HNO3 con-centrations in Adams et al. (2001). This indicates that their model is not limited by ammonia at high altitudes. In climate models with coarse vertical resolution, this is an expected re-sult since the coarser resolution will make it more difficult to maintain strong gradient across the boundary layer. Figure 5 shows mixing ratios of zonal mean vertical profile of fine mode ammonium, total ammonia (NH3+NH4), sulphate, and fine mode nitrate. The figure reveals that these species have a
Fig. 4. Comparison of observed surface concentration (PM2.5) from 20 EMEP stations with the Oslo CTM2 model, (a) fine mode nitrate
associate with ammonium, (b) fine mode ammonium, (c) fine mode nitrate including nitrate associated with sea salt particles with radius below 1–1.5 µm. Note that the value from Ispra, Italy for nitrate is not included due to the high value of 10 µg m−3, whereas it is around 1 µg m−3in the model.
quite different vertical distribution and that the vertical pro-file is a critical issue for formation of fine mode particulate nitrate. Whereas the fine mode of particulate ammonium de-creases regularly with altitude the total ammonia has a very strong decrease with altitude near the surface. This indicates that a large fraction of ammonia reacts to ammonium above 900 hPa and that the model gives a strong gradient with alti-tude for NH3. The vertical distribution of sulphate has an al-most constant mixing ratio from surface to 800 hPa and with an actual increase with altitude closest to the surface. Also above 800 hPa the sulphate concentration is significant. For nitrate (as fine mode ammonium nitrate) the mixing ratio is decreasing rapidly with altitude above 950 hPa as a result of its dependence of the availability of ammonium.
Adams et al. (1999) defined DON (degree of neutraliza-tion) as (NH4/2SO4)which equals 1 when sulphuric acid is totally neutralized by ammonium. Analogous to this def-inition, we define NP (nitrate production given in molar units) as the excess ammonium which is in the aerosols when all sulphuric acid is neutralized normalized to sulphate. Note that in this section we define the excess ammonium as what is left after sulphate has been completely neutralized to (NH4)2SO4. This is different from the definition of ex-cess ammonium in Sect. 2.2 where exex-cess ammonium de-pends on aerosol acidity. However, the definition here allows for a simpler diagnostic of the model, and although sulphate does not need to be completely neutralized to give aerosol nitrate, the aerosol nitrate will preferentially form in alka-line aerosols. Therefore, we believe this simpler definition
Figure 5: Annual mean vertical and zonal mean mixing ratios (ppb) a) fine mode NH
4b)
total ammonia (NH
3+ NH
4) c) sulphate d) fine mode nitrate.
Fig. 5. Annual mean vertical and zonal mean mixing ratios (ppb) (a) fine mode NH4(b) total ammonia (NH3+ NH4)(c) sulphate (d) fine
mode nitrate.
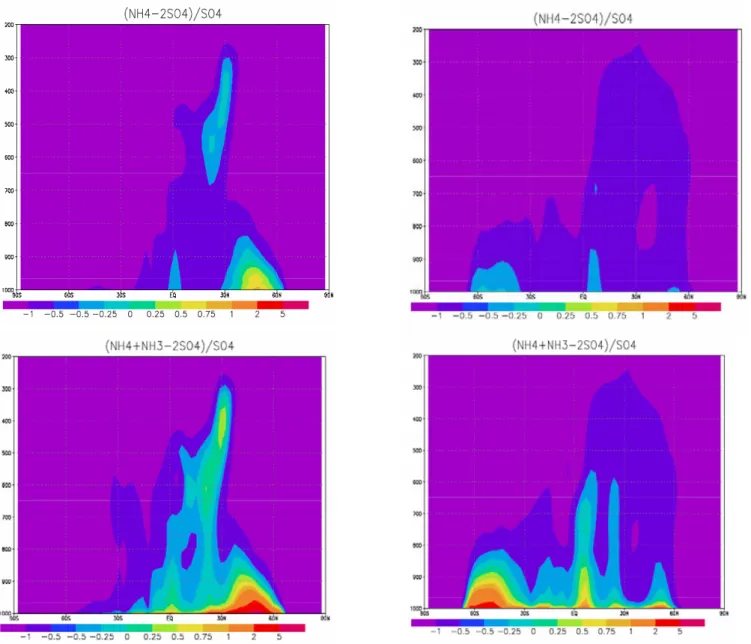
is useful for understanding the limitations for formation of fine mode nitrate on the global scale. NP is zero when all sulphuric acid is neutralized by ammonium (DON=1) and NP is larger than zero when there is excess ammonium in the aerosols. This excess ammonium is then associated with particulate nitrate. Figures 6a and b show zonally averaged values for NP for January and July in our model. The fig-ures show that NP is larger than zero in the winter close to the ground in the northern hemisphere. In summer NP is rarely larger than zero anywhere meaning that the aerosols are rarely neutralized in summer.
To interpret these results, we plot the potential values of NP. We define this as Nitrate Production Potential (NPP) and assume that all gaseous ammonia can be used to formed ni-trate. Areas with NPP larger than zero are areas where fine
mode nitrate can be formed given that the temperature is low enough. Whenever NPP is smaller than zero, fine mode ni-trate can not be formed in significant concentrations even if the temperature is very low. Figures 6c and d show NPP zonally averaged for January and July in our model. NPP is largest near the surface and decrease relatively fast with altitude. A secondary maximum is found in the middle tro-posphere at equator. The strong reduction with altitude on the total ammonia is a main reason for the strong vertical gradient of the potential for fine mode particulate nitrate to be produced, but also the increase or near constant sulphate with altitude in the lower troposphere contributes. The sea-sonal variation is significant. The maximum in July in the southern hemisphere is partly due to very low sulphate.
Figure 6: In the upper panels the nitrate production (NP) is shown as the ratio of fine
mode ammonium nitrate aerosol to sulfate aerosols (left January and right July). Nitrate
production potential (NPP) is shown as the ratio of all available ammonia not used for
neutralization of sulphate to sulfate aerosols in the lower panels (left January and right
July).
Fig. 6. In the upper panels the nitrate production (NP) is shown as the ratio of fine mode ammonium nitrate aerosol to sulfate aerosols (left
January and right July). Nitrate production potential (NPP) is shown as the ratio of all available ammonia not used for neutralization of sulphate to sulfate aerosols in the lower panels (left January and right July).
There are two important reasons for the strong vertical gra-dients in NPP in our model. First, all ammonia emissions are on the ground. The Oslo CTM2 boundary layer scheme pre-serves a quite strong gradient from the lowest layer and to the top of the boundary layer. Second: There are significant secondary sources for sulphate in the free troposphere. Sul-phuric acid is produced in the free troposphere both trough gaseous reactions and aqueous reactions. Figures 6c and d in-dicate that the Oslo CTM2 model can not produce significant nitrate in the free troposphere since it is limited by access to ammonia.
3.3 Nitrate aerosol optical depth and radiative effect
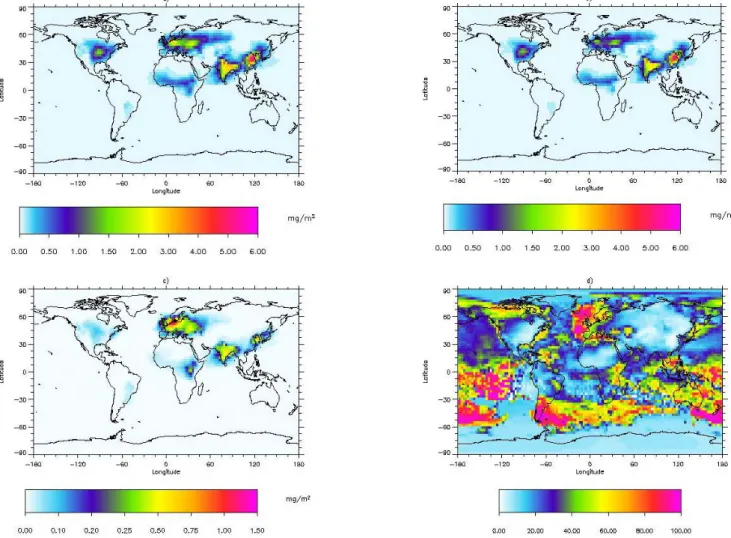
The global and annual mean burden of fine mode ammonium nitrate is 0.068 mg(NO3)m−2. In an additional simulation where sea salt was excluded the fine mode nitrate burden was 0.086 mg(NO3)m−2. The geographical distribution is shown in Fig. 7. The burden varies substantially from being signif-icant in industrialized region to very low over all oceanic re-gions. Figure 7 shows also that the effect of sea salt on the fine mode nitrate burden is very different depending on if it is calculated in relative or absolute terms. In absolute terms the difference in burden due to inclusion of sea salt in the simu-lation is largest over Europe and with some impact over India
Figure 7: Annual mean burden of nitrate (mg/m
2) a) without sea salt, b) with sea salt, c) absolute
difference between the simulation with and without sea salt, d) percentage difference between the
simulation with and without sea salt.
Fig. 7. Annual mean burden of fine mode nitrate (mg/m2)(a) without sea salt, (b) with sea salt, (c) absolute difference between the simulation
with and without sea salt, (d) percentage difference between the simulation with and without sea salt.
and China as well. Over Europe the reduction in the burden due to inclusion of sea salt attain almost 50%. Over ocean the burden of fine mode ammonium nitrate is very low due to low availability in ammonia. However, in several regions over ocean sea salt can eliminate the burden of fine mode nitrate.
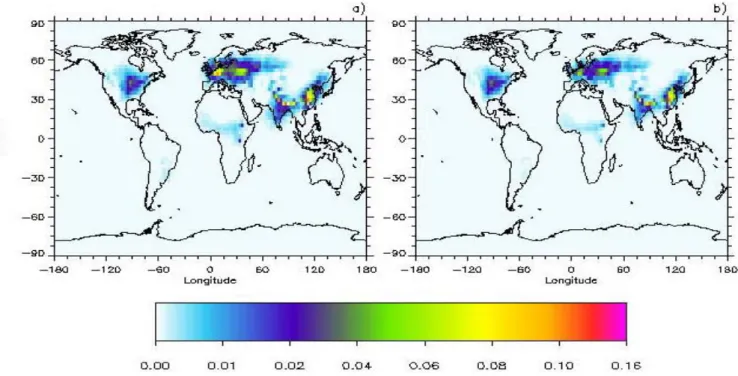
Similar to the surface concentration and burden of nitrate the aerosol optical depth (AOD) of nitrate has rather local-ized maxima (Fig. 8). The results show peak values in India above 0.1, over Europe slightly larger than 0.05, and over USA of 0.04. The effect of sea salt to reduce the AOD of ammonium nitrate is mostly in the western part of the conti-nents and most prominent near the coast (difference between Fig. 8a and Fig. 8b). In the industrial areas with local maxima in the nitrate AOD, ammonium nitrate accounts for around 10% of the total AOD from earlier simulations with multi component aerosol simulations with the Oslo CTM2. The global mean AOD of fine mode ammonium nitrate is 0.0010 (0.0013 without sea salt). To put this is context with other
aerosol component from industrial sources the AOD from ni-trate is around 5% of the AOD from sulphate, 30% lower than the AOD from organic carbon, and rather similar to the AOD from black carbon based on simulations with Oslo CTM2 for AEROCOM calculations with predefined emissions (Experi-ment B) (Kinne et al., 2006; Textor et al., 2006). The column burden of nitrate associate with sea salt particles is substan-tial 1.44 mg(NO3)m−2. Of the sea salt particles about 7% has a radius smaller than 0.5 µm and about 50% smaller than 1.25 µm. Therefore there is a substantial burden of fine mode NaNO3, but these particles do only to some extent change the mass compared to the original sea salt particles (see Eq. 3). The mass increases slightly due to larger molecular mass of NO3compared to Cl, but this occurs without the number of moles increasing. We estimated the increase in aerosol mass due to the aerosols contains nitrate instead of chloride. Fig-ure 9 shows the annual mean aerosol optical depth from the sea salt particles with additional mass due to nitrate.. The dis-tribution shown in Fig. 9 has also maxima near industrialized
G. Myhre et al.: Modelling of nitrate particles 4819
Figure 8: Annual mean aerosol optical depth of fine mode ammonium nitrate aerosols a)
without sea salt, b) with sea salt. Note that the scale is not linear.
Fig. 8. Annual mean aerosol optical depth of fine mode ammonium nitrate aerosols (a) without sea salt, (b) with sea salt. Note that the scale
is not linear.
regions, but much smaller land ocean gradients than in Fig. 8. The AOD values are also much lower in Fig. 9 than in Fig. 8. The global mean AOD from the NaNO3particles (compared to having the particles as NaCl) is 0.0006. The effect of changing the optical properties (through density, refractive index, hygroscopic growth of NaNO3instead of NaCl) was to reduce the AOD by about a factor of 2.
The global and annual mean radiative forcing due to fine mode particulate nitrate is −0.016 Wm−2in the simulations where sea salt is included with a distribution similar to the distribution of the AOD. Annual mean peak values of −1.5 Wm−2are simulated. Note that the simulations of the AOD and radiative forcing include anthropogenic as well as natural emission of ammonium nitrate precursors. The nor-malized radiative forcing is −230 Wg−1, which is close to typical values for sulphate aerosols.
4 Summary
A scheme for gas/aerosol partitioning has been implemented into a multi component global aerosol transport model to simulate particulate nitrate. Results show that fine mode par-ticulate nitrate has local maxima of significant concentration in industrialized region in accordance with measurements. In agreement with measurements in major aerosol campaigns nitrate over ocean is associated with sea salt and thus coarse mode particles (Quinn and Bates, 2005). Importantly for AOD and radiative forcing we explicitly model nitrate either as fine or coarse mode particles. A total radiative forcing
Figure 9: Annual mean aerosol optical depth of coarse
mode nitrate aerosols.
Fig. 9. Annual mean aerosol optical depth of coarse mode nitrateaerosols.of −0.02 Wm−2(including anthropogenic and natural emis-sion) indicate based on this study that the forcing of nitrate particles is on the weaker side of earlier estimates. The ra-diative forcing due to particulate nitrate on a global scale is almost negligible, but on a regional scale the radiative forc-ing can be −1.5 Wm−2for the annual mean and −3 Wm−2at certain months. Also the regional surface concentration and
aerosol optical depth of nitrate can be a significant fraction of the total aerosol composition. The modelled surface concen-tration is in reasonable agreement with measurements. Fur-ther, the vertical profile of total ammonia and sulphate will reduce the impact of fine mode ammonium nitrate with alti-tude in the lower troposphere. The ammonia concentration will normally be reduced with altitude, whereas the sulphate concentration often is more constant or even increase with altitude in the lower troposphere due to the conversion from SO2to sulphate. Therefore, we find it unlikely that the AOD and radiative forcing due to nitrate can be of significance on a global scale. Uptake of nitrate on sea salt particles reduces the AOD of ammonium nitrate by about 25%. However, the major limitation for higher production of fine mode partic-ulate nitrate in our model is the availability of ammonium at levels where temperature (and therefore saturation vapor pressure of HNO3)is low enough. The burden of nitrate in sea salt particles is found to be large but do not give signif-icant AOD and a radiative forcing. We note that in such a complex system non-linear processes may be of importance and further studies with higher resolutions and detailed anal-ysis with comparisons with observations are necessary.
The distribution and amount of nitrate particles may be dependent on the spatial resolution (personal communication M. Krol). This will be investigated further in the Oslo CTM2 when meteorological data on 1 degree become available. Nitrate can also react on mineral dust particles in particular with dissolved potassium, calcium or magnesium carbon-ates (Derwent et al., 2003; Metzger et al., 2006; Wolff, 1984). Further investigation with these reactions should be performed to investigate the influence on the coarse mode nitrate distribution.
Edited by: W. E. Asher
References
Adams, P. J. and Seinfeld, J. H.: Predicting global aerosol size distributions in general circulation models, J. Geophys. Res.-Atmos., 107(D19), 4370, doi:10.129/2001JD00101, 2002. Adams, P. J., Seinfeld, J. H., Koch, D., Mickley, L., and Jacob, D.:
General circulation model assessment of direct radiative forcing by the sulfate-nitrate-ammonium-water inorganic aerosol sys-tem, J. Geophys. Res.-Atmos., 106(D1), 1097–1111, 2001. Adams, P. J., Seinfeld, J. H., and Koch, D. M.: Global
concentra-tions of tropospheric sulfate, nitrate, and ammonium aerosol sim-ulated in a general circulation model, J. Geophys. Res.-Atmos., 104(D11), 13 791–13 823, 1999.
Berglen, T. F., Berntsen, T. K., Isaksen, I. S. A., and Sundet, J. K.: A global model of the coupled sulfur/oxidant chemistry in the tro-posphere: The sulfur cycle, J. Geophys. Res.-Atmos., 109(D19), D19310, doi:10.1029/2003JD003948, 2004.
Berntsen, T. K. and Isaksen, I. S. A.: A global three-dimensional chemical transport model for the troposphere.1. Model de-scription and CO and ozone results, J. Geophys. Res.-Atmos., 102(D17), 21 239–21 280, 1997.
Bouwman, A. F., Lee, D. S., Asman, W. A. H., Dentener, F. J., VanderHoek, K. W., et al.: A global high-resolution emission inventory for ammonia, Global Biogeochem. Cycles, 11(4), 561– 587, 1997.
Capaldo, K. P., Pilinis, C., and Pandis, S. N.: A computationally efficient hybrid approach for dynamic gas/aerosol transfer in air quality models, Atmos. Environ., 34(21), 3617–3627, 2000. Derwent, R. G., Jenkin, M. E., Johnson, C. E., and Stevenson, D.
S.: The global distribution of secondary particulate matter in a 3-D Lagrangian chemistry transport model, J. Atmos. Chem., 44, 57–95, 2003.
Evans, C. D., Cullen, J. M., Alewell, C., Kopacek, J., Marchetto, A., et al.: Recovery from acidification in European surface waters, Hydrol. Earth Syst. Sci., 5, 283–297, 2001,
http://www.hydrol-earth-syst-sci.net/5/283/2001/.
Fitzgerald, J. W.: Approximation Formulas For Equilibrium Size Of An Aerosol Particle As A Function Of Its Dry Size And Com-position And Ambient Relative Humidity, J. Appl. Meteorol., 14(6), 1044–1049, 1975.
Grini, A., Myhre, G., Sundet, J. K., and Isaksen, I. S. A.: Modeling the annual cycle of sea salt in the global 3D model Oslo CTM2: Concentrations, fluxes, and radiative impact, J. Climate, 15(13), 1717–1730, 2002.
Holtslag, A. A. M., Debruijn, E. I. F., and Pan, H. L.: A High-Resolution Air-Mass Transformation Model For Short-Range Weather Forecasting, Mon. Wea. Rev., 118(8), 1561–1575, 1990. Hueglin, C., Gehrig, R., Baltensperger, U., Gysel, M., Monn, C., et al.: Chemical characterisation of PM2.5, PM10 and coarse particles at urban, near-city and rural sites in Switzerland, Atmos. Environ., 39(4), 637–651, 2005.
Jacobson, M. Z.: Global direct radiative forcing due to multicom-ponent anthropogenic and natural aerosols, J. Geophys. Res.-Atmos., 106(D2), 1551–1568, 2001.
Jaffe, D., Tamura, S., and Harris, J.: Seasonal cycle and composi-tion of background fine particles along the west coast of the US, Atmos. Environ., 39(2), 297–306, 2005.
Kinne, S., Schulz, M., Textor, C., Guibert, S., Balkanski, Y., et al.: An AeroCom initial assessment - optical properties in aerosol component modules of global models, Atmos. Chem. Phys., 6, 1815–1834, 2006,
http://www.atmos-chem-phys.net/6/1815/2006/.
Lefer, B. L. and Talbot, R. W.: Summertime measurements of aerosol nitrate and ammonium at a northeastern US site, J. Geo-phys. Res.-Atmos., 106(D17), 20 365–20 378, 2001.
Lelieveld, J., Berresheim, H., Borrmann, S., Crutzen, P. J., Den-tener, F. J., et al.: Global air pollution crossroads over the Mediterranean, Science, 298(5594), 794–799, 2002.
Liao, H. and Seinfeld, J. H.: Global impacts of gas-phase chemistry-aerosol interactions on direct radiative forcing by an-thropogenic aerosols and ozone, J. Geophys. Res., 110, D18208, doi:10.1029/2005JD005907, 2005.
Liao, H., Seinfeld, J. H., Adams, P. J., and Mickley, L. J.: Global radiative forcing of coupled tropospheric ozone and aerosols in a unified general circulation model, J. Geophys. Res.-Atmos., 109(D16), D16207, doi:10.1029/2003JD004456, 2004. Lide, D. R.: CRC handbook of chemistry and physics, A
ready-reference book of chemical and physical data, 72nd ed., 1991. Malm, W. C., Schichtel, B. A., Pitchford, M. L., Ashbaugh, L.
fine particle concentration in the United States, J. Geophys. Res.-Atmos., 109(D3), D03306, doi:10.1029/2003/JD003739, 2004. Marinoni, A., Laj, P., Deveau, P. A., Marino, F., Ghermandi, G., et
al.: Physicochemical properties of fine aerosols at Plan d’Aups during ESCOMPTE, Atmos. Res., 74(1–4), 565–580, 2005. Martin, S. T., Hung, H. M., Park, R. J., Jacob, D. J., Spurr, R. J. D.,
et al.: Effects of the physical state of tropospheric ammonium-sulfate-nitrate particles on global aerosol direct radiative forcing, Atmos. Chem. Phys., 4, 183–214, 2004,
http://www.atmos-chem-phys.net/4/183/2004/.
Meng, Z. Y. and Seinfeld, J. H.: Time scales to achieve atmospheric gas-aerosol equilibrium for volatile species, Atmos. Environ., 30(16), 2889–2900, 1996.
Metzger, S., Dentener, F., Krol, M., Jeuken, A., and Lelieveld, J.: Gas/aerosol partitioning – 2. Global mod-eling results, J. Geophys. Res.-Atmos., 107(D16), 4313, doi:10.1029/2001JD001103, 2002a.
Metzger, S., Dentener, F., Pandis, S., and Lelieveld, J.: Gas/aerosol partitioning: 1. A computationally efficient model, J. Geophys. Res.-Atmos., 107(D16), 4312, doi:10.1029/2001JD001102, 2002b.
Metzger, S., Mihalopoulos, N., and Lelieveld, J.: Importance of mineral cations and organics in gas-aerosol partitioning of reac-tive nitrogen compounds: case study based on MINOS results, Atmos. Chem. Phys., 6, 2549–2567, 2006,
http://www.atmos-chem-phys.net/6/2549/2006/.
Metzger, S. M.: Gas/Aerosol Partitioning: A simplified Method for Global Modeling, University Utrecht, The Netherlands, 2000. Myhre, G., Jonson, J. E., Bartnicki, J., Stordal, F., and Shine, K.
P.: Role of spatial and temporal variations in the computation of radiative forcing due to sulphate aerosols: A regional study, Quart. J. Roy. Meteorol. Soc., 128(581), 973–989, 2002. Myhre, G., Stordal, F., Berglen, T. F., Sundet, J. K., and Isaksen,
I. S. A.: Uncertainties in the radiative forcing due to sulfate aerosols, J. Atmos. Sci., 61(5), 485–498, 2004.
Nenes, A., Pandis, S. N., and Pilinis, C.: ISORROPIA: A new ther-modynamic equilibrium model for multiphase multicomponent inorganic aerosols, Aquatic Geochemistry, 4(1), 123–152, 1998. Novakov, T., Hegg, D. A., and Hobbs, P. V.: Airborne mea-surements of carbonaceous aerosols on the East Coast of the United States, J. Geophys. Res.-Atmos., 102(D25), 30 023– 30 030, 1997.
Park, M. H., Kim, Y. P., Kang, C. H. and Shim, S. G.: Aerosol composition change between 1992 and 2002 at Gosan, Korea, J. Geophys. Res.-Atmos., 109(D19), D19S13, doi:10.1029/2003JD00411, 2004.
Pilinis, C., Capaldo, K. P., Nenes, A., and Pandis, S. N.: MADM – A new multicomponent aerosol dynamics model, Aerosol Sci. Technol., 32(5), 482–502, 2000.
Prather, M. J.: Numerical Advection By Conservation Of 2nd-Order Moments, J. Geophys. Res.-Atmos., 91(D6), 6671–6681, 1986.
Putaud, J. P., Raes, F., Van Dingenen, R., Bruggemann, E., Fac-chini, M. C., et al.: European aerosol phenomenology-2: chem-ical characteristics of particulate matter at kerbside, urban, rural and background sites in Europe, Atmos. Environ., 38(16), 2579– 2595, 2004.
Quinn, P. K. and Bates, T. S.: Regional aerosol proper-ties: Comparisons of boundary layer measurements from ACE 1, ACE 2, aerosols99, INDOEX, ACE asia, TARFOX, and NEAQS, J. Geophys. Res.-Atmos., 110(D14), D14202, doi:10.1029/2004JD004755, 2005.
Ramanathan, V., Crutzen, P. J., Lelieveld, J., Mitra, A. P., Al-thausen, D., et al.: Indian Ocean Experiment: An integrated anal-ysis of the climate forcing and effects of the great Indo-Asian haze, J. Geophys. Res.-Atmos., 106(D22), 28 371–28 398, 2001. Sievering, H., Boatman, J., Gorman, E., Kim, Y., Anderson, L., et al.: Removal Of Sulfur From The Marine Boundary-Layer By Ozone Oxidation In Sea-Salt Aerosols, Nature, 360(6404), 571– 573, 1992.
Sopauskiene, D., Jasineviciene, D., and Stapcinskaite, S.: The ef-fect of changes in European anthropogenic emissions on the con-centrations of sulphur and nitrogen components in air and pre-cipitation in Lithuania, Water Air and Soil Pollution, 130(1–4), 517–522, 2001.
Sorteberg, A. and Hov, O.: Two parametrizations of the dry depo-sition exchange for SO2 and NH3 in a numerical model, Atmos. Environ., 30(10–11), 1823–1840, 1996.
Stamnes, K., Tsay, S. C., Wiscombe, W., and Jayaweera, K.: Numerically Stable Algorithm For Discrete-Ordinate-Method Radiative-Transfer In Multiple-Scattering And Emitting Layered Media, Appl. Opt., 27(12), 2502–2509, 1988.
Stoddard, J. L., Jeffries, D. S., Lukewille, A., Clair, T. A., Dillon, P. J., et al.: Regional trends in aquatic recovery from acidification in North America and Europe, Nature, 401(6753), 575–578, 1999. Textor, C., Schulz, M., Guibert, S., Kinne, S., Balkanski, Y., et al.:
Analysis and quantification of the diversities of aerosol life cy-cles within AeroCom, Atmos. Chem. Phys., 6, 1777–1813, 2006, http://www.atmos-chem-phys.net/6/1777/2006/.
Tiedtke, M.: A Comprehensive Mass Flux Scheme For Cumulus Pa-rameterization In Large-Scale Models, Mon. Wea. Rev., 117(8), 1779–1800, 1989.
van Dorland, R., Dentener, F. J., and Lelieveld, J.: Radiative forcing due to tropospheric ozone and sulfate aerosols, J. Geophys. Res.-Atmos., 102(D23), 28 079–28 100, 1997.
Wexler, A. S. and Seinfeld, J. H.: The Distribution Of Ammonium-Salts Among A Size And Composition Dispersed Aerosol, At-mos. Environ., 24(5), 1231–1246, 1990.
Wolff, G. T.: On The Nature Of Nitrate In Coarse Continental Aerosols, Atmos. Environ., 18(5), 977–981, 1984.