CO
2Compression for Capture-Enabled Power
Systems
By Rajat
Suri
B. A. Sc. Chemical Engineering, University of Waterloo, 2007
B. A. Economics, University of Waterloo, 2007
Submitted to the Department of Chemical Engineering
in partial fulfillment of the requirements for the degree of
Masters of Science
ASSACHUSE1S INSOF TECHNOLOGY
MAR 0
3
2009
MASSACHUSETTS INSTITUTE OF TECHNOLOG
"January 2009
LIBRARIES
© Massachusetts Institute of Technology, 2009. All rights reserved.
A u th o r
...
...
Rajat
Suri
Department of Chemical Engineering
15
t"January 2009
Certified by
...
...
-,, J V
Gregory J. McRae
Hoyt C. Hottel Professor of Chemical Engineering
Thesis Supervisor
Accepted by
...
...
William M. Deen
Professor of Chemical Engineering
Chairman, Committee for Graduate Students
Carbon Dioxide Compression for Capture-Enabled Power Systems
by
Rajat Suri
Submitted to the Department of Chemical Engineering on 15th
Jan 2009 in partial fulfillment of the
requirements for the Degree of Masters of Science in Chemical Engineering
Abstract
The objective of this thesis is to evaluate a new carbon dioxide compression technol-ogy - shock compression - applied specifically to capture-enabled power plants. Global warming has increased public interest in carbon capture and sequestration technologies (CCS), but these technologies add significant capital and operating cost at present, which creates a significant barrier to adoption.
Carbon dioxide compression technology makes up a high proportion of the addi-tional cost required, making it a focal point for engineering efforts to improve the economic feasibility of carbon capture. To this effect, shock compressors have the po-tential to reduce both operating and capital costs with supporting compression ratios of up to 10:1, requiring less stages and theoretically allowing for the possibility of heat integration with the rest of the plant, allowing waste heat to be recovered from hot interstage compressed carbon dioxide.
This thesis first presents a technical context for carbon dioxide compression by providing an overview of capture technologies to build an understanding of the differ-ent options being investigated for efficidiffer-ent removal of carbon dioxide from power plant emissions. It then examines conventional compression technologies, and how they have each evolved over time. Sample engineering calculations are performed to model gas streams processed by these conventional compressors.
An analysis of shock compression is carried out by first building a background in compressible flow theory, and then using this as a foundation for understanding shock wave theory, especially oblique shocks. The shock compressor design is carefully analyzed using patent information, and a simulation of the physics of the shock com-pressor is created using equations from the theory section described earlier.
A heat integration analysis is carried out to compare how conventional compressor
technologies compare against the new shock compressor in terms of cooling duty and power recovery when integrated with the carbon dioxide capture unit. Both pre-combustion IGCC using Selexol and post-pre-combustion MEA configurations are con-sidered and compared.
Finally an economic analysis is conducted to determine whether shock compres-sion technology should be attractive to investors and plant managers deciding to sup-port it. Key factors such as market, macroeconomic and technical risk are analyzed for investors, whereas a comparison of capital and operating cost is carried out for plant managers. Relevant risks associated with new compression technologies are also analyzed.
It is found that there is no significant operating cost benefit to the shock compres-sor over the conventional comprescompres-sor, both costing $3,700/hr for an IGCC plant. Power recovery is simply too low to justify the high power requirements in operating a shock compressor with a 10:1 ratio. The technical claims of the shock compressor (such as projected discharge temperature and pressures) seem reasonable after basic modeling, which shows a higher temperature and pressure than claimed by Ramgen.
Thesis Supervisor: Gregory McRae
Acknowledgements
I would like to thank Randall Field and Professor Gregory McRae for the guidance they provided during the production of this thesis. I would like to thank the Carbon Sequestra-tion Initiative and BP for the financial support they provided.
Contents
1 Introduction ... 21
1.1 Global warming can have harmful effects on human life ... 21
1.1.1 Increases in surface temperature have accelerated... 21
1.1.2 Carbon Dioxide emissions are to blame for increases in surface temperature ... ... ... 23
1.1.3 Consequences of global warming are disastrous ... 29
1.2 The Importance of Power Systems in the effort to reduce global warming 30 1.2.1 Increasing Energy Efficiency... ... 31
1.2.2 Reducing Carbon Intensity ... ... 32
1.2.3 Carbon Capture & Sequestration (CCS) ... 33
1.3 Objectives and Organization of Thesis... ... 34
2 CO2 Capture Technologies ... ... 37
2.1 Background... ... 37
2.2 CO2 Capture... ... . ... 38
2.2.1 Post-combustion ... ... 38
2.2.2 Post-combustion chilled ammonia... 40
2.2.3 Pre-combustion... ... 41
2.2.4 Oxy-Fuel Combustion ... ... ... 43
2.2.5 Chemical Looping Combustion ... 44
2.3 Thermophysical properties ... 45
3 Compression Technology ... ... 49
3.1 Compression costs are high in capture-enabled power systems ... 49
3.2.1 Example calculation... ... 56
3.3 Turbomachinery Technology Evolution ... 60
3.4 Compressor Technology... ... 62
3.4.1 Continuous Flow Compressors ... ... 63
3.4.2 Positive displacement compressors ... 67
3.5 Specifications for compression... ... 68
4 How Shock Compression Works ... ... 73
4.1 Compressible Flow Theory ... . ... 73
4.2 Shock Wave Theory... .. ... 82
4.3 Ram gen background ... 97
4.4 R am gen D esign ... 99
4.5 Basic Sim ulation of Ram pressor... 110
4.5.1 Sample Calculations ... 112 4.5.2 Rampressor case ... 113 4.5.3 Frame-by-Frame Analysis ... 114 4.6 Ramgen Progress... 115 5 Energy Analysis... 119 5.1 Ideal Cases... 119 5.1.1 Calculations... ... .. 120 5.1.2 Aspen M odel ... ... 123 5.2 Heat Integration ... ... 124
5.2.1 Pre-combustion IGCC plant... ... 125
5.2.2 Post-combustion ... 128
5.2.3 Conventional compressors... ... 131
5.2.4 Com parison of all results... 132
6 Econom ic Analysis... ... 137
6.1 Review of CCS Economics ... 137
6.2 Compressor Economics for Managers... ... 142
6.2.1 Conventional Compressor ... ... 142
6.2.2 Rampressor... 143
6.2.3 Economic Comparison ... 144
6.2.4 Caveats in analysis... 147
7 Conclusions & Recommendations ... 150
7.1 Future W ork... ... ... ... 155
Appendix A Frame-by-Frame Rampressor Analysis ... 157
References ... ... 179
List of Figures
Figure 1-1: Temperature chart showing how the earth has warmed 0.7 C since 1900
1
... ..22
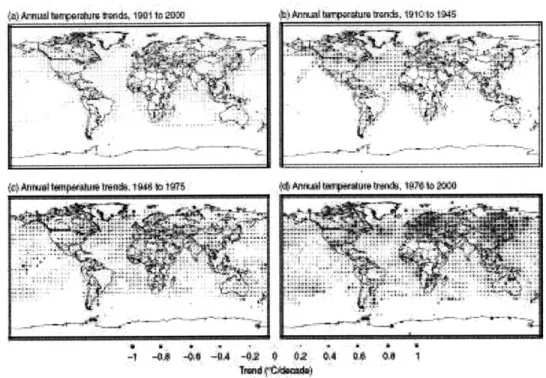
Figure 1-2: Regional temperature trends over different periods of the 20th century 2. 23 Figure 1-3: The greenhouse effect 5 G represents the flux of radiation from the atmosphere upwards and downwards and a represents the proportion of albedo absorbed by the atmosphere ... ... 25
Figure 1-4: Relative contributions to additional radiation forcing (thus increasing the temperatures at the surface) between 1980 and 1990 1 ... 26
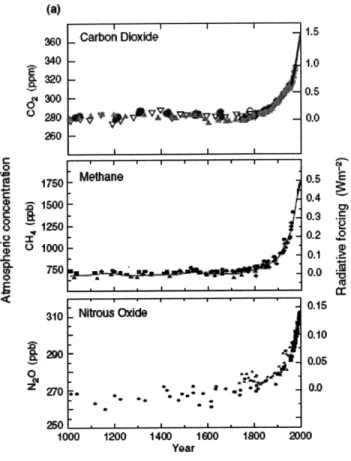
Figure 1-5: Concentrations of various forcing agents over time and corresponding 'radiative forcing' (amount of energy absorbed per unit area) 2 ... 27
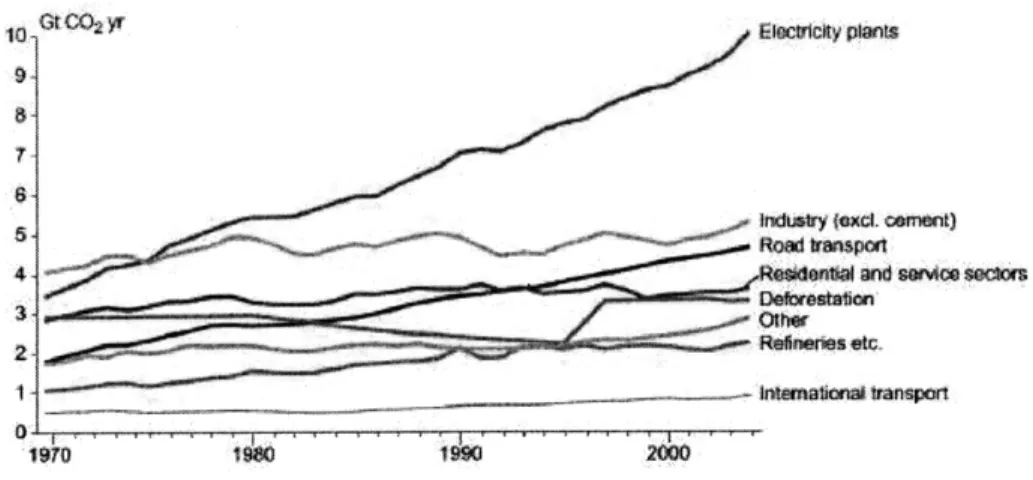
Figure 1-6: Sources of global carbon dioxide emissions over the past 30 years 6... 31
Figure 2-1 - Post-combustion capture of CO2 9 ... 39
Figure 2-2 - A depiction of an IGCC process without carbon capture 9, 11 ... 41
Figure 2-3: IGCC process with Carbon Capture using a Selexol process 9 ... 42
Figure 2-4: 500 MW Oxy-fuel generation plant 9... 44
Figure 2-5: Phase Diagram for Carbon Dioxide 13 ... 47
Figure 3-1- Temperature-entropy diagram of an ideal vapor-compression cycle ... 59
Figure 3-2- Temperature-entropy diagram involving two stage compression 16... 60
Figure 3-3: The various types of compression technologies [Wikipedia] ... 63
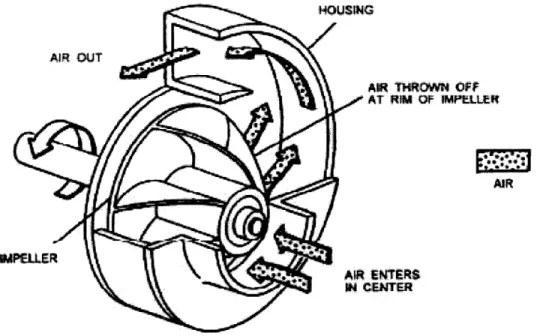
Figure 3-4: Flow of air through a centrifugal compressor ... 64
Figure 3-6: The variation of pressure and velocity along the length of an axial flow compressor. The rotors add velocity and the stators convert that velocity into
static pressure 9... ... 66
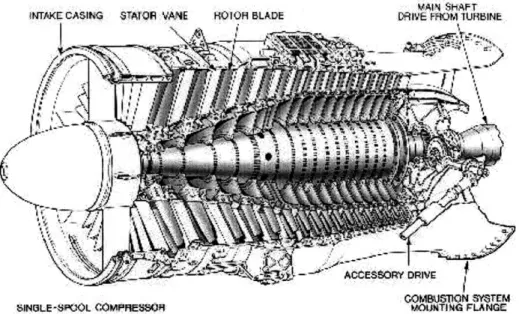
Figure 3-7: An axial flow compressor in use for jet engines 9... 67
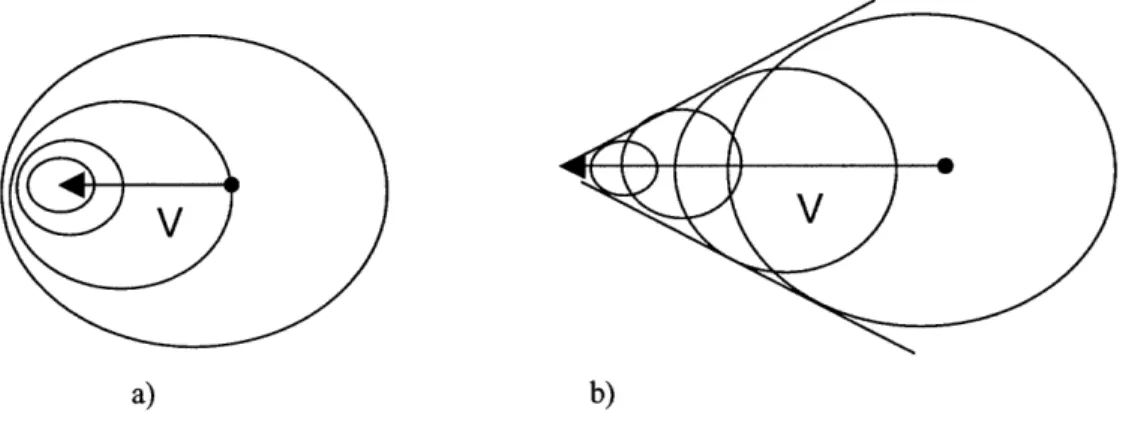
Figure 4-1: How shock waves work. a) represents the subsonic case where the disturbance object (the path of which is represented by the arrow) is always within the sphere of the emitted sound waves. b) represents the situation in which V is higher than the speed of sound and the waves are continually left behind the disturbance object [Redrawn from Anderson] ... 74
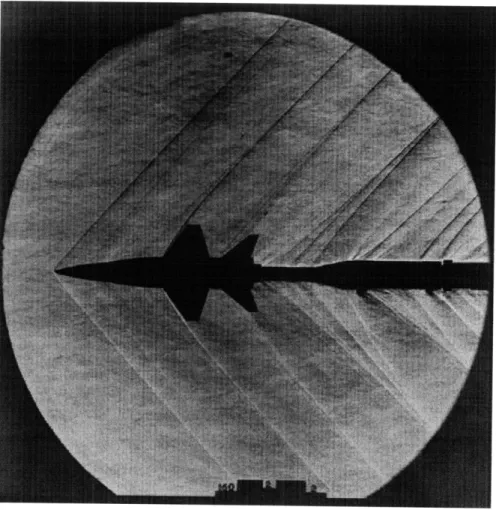
Figure 4-2: Oblique shock waves in a NASA Langley supersonic wind tunnel. The line represents high-entropy wave fronts in a series of ripple-like shock waves ... 7 6 Figure 4-3: Stagnation and static property ratios as a function of Mach number 28 ... 79
Figure 4-4: Control volume in a converging-diverging nozzle ... 80
Figure 4-5: Depiction of the change of Area and Mach number with distance for internal flows ... ... 82
Figure 4-6: Control volume of a normal shock wave in a tube... 83
Figure 4-7: Temperature Entropy Diagram for Rayleigh flow 28 ... 85
Figure 4-8: Fanno flow temperature-entropy diagram... ... 86
Figure 4-9: Shock wave properties, as determined by the intersection of the solution of Fanno and Rayleigh flow lines. The lines start at point x and move through the shock to point y 28... ... ... 87
Figure 4-10: Special coordinate system for moving shocks. The apostrophes indicate a stationary frame ... ... 89
Figure 4-11: Normal shock presented as a special case of oblique shock with deflection angle 6 =0 28... ... 91
Figure 4-12: Components of oblique shock before and after the shock 28... 92
Figure 4-13: How deflection angle and shock angle are related to solutions of oblique shocks for different upstream Mach numbers 29 ... 95
Figure 4-14: Reflected shock waves 30... ... 97
Figure 4-15: Depiction of ramjet engine ... 99
Figure 4-17: The aerodynamic design of a Ramjet/Ramgen compressor inlet and
diffuser, obtained from a Ramgen presentation ... 102
Figure 4-18: Similarity of Ramgen to Ramjet technology ... 103
Figure 4-19: Ramgen cut-away drawing of Rampressor showing both low pressure intake and high pressure outlet, as well as pre-swirl and supersonic compression rotors. 32 ... ... 105
Figure 4-20: Cross-section view of Rampressor casing 32 ... 106
Figure 4-21: Rampressor supersonic compression rotor 32... 107
Figure 4-22: Even closer look of the ramp of a Rampressor rotor 32 ... 108
Figure 4-23: Circumferential view of shock compression rotor without inlet pre-swirl wheel 32... ... ... 109
Figure 4-24: Comparison of Rampressor efficiency against other forms of compression ... 110
Figure 4-25: Calculation of Downstream conditions and property ratios for upstream properties of M1=2.5 and 6 = 30 degrees in the case of compressible flow over a wedge 30 . . . .. .. . . .. . . . . . .... . . ... 112
Figure 4-26: Calculation of Downstream conditions and property ratios for upstream properties of M1=2.5 and 6 = 30 degrees in the case of reflected shock 30... 113
Figure 5-1: Schematic of Rampressor shock compression system, used for energy balance purposes... 120
Figure 5-2: Aspen model of Rampressor arrangement... 124
Figure 5-3: A model that was used as a basis for calculating exit CO2 conditions. This NETL model was modified in the MIT report. 34 ... 134
Figure 5-4: Ramgen process model integrated with pre-combustion carbon capture (Selexol process) ... ... ... . 135
Figure 5-5 - Conventional multi-stage compressor model in Aspen Plus for the pre-com bustion case ... 136
Figure 5-6 -Conventional multi-stage compressor model in Aspen Plus for the post-combustion case. The feed stream is dehydrated beforehand ... 136
Figure 6-1: Cost of both a Rampressor and Conventional compressor over time to a pre-combustion plant, based on capital and operating costs alone ... 146
List of Tables
Table 1-1: Changes in phenomenon due to global warming and the probability they
w ill occur 2 ... ... 29
Table 1-2: Thermal Efficiencies of Modern Emission Systems 7... 32
Table 1-3: Carbon intensity of Fossil Fuels ... 33
Table 1-4: Summary of planned and operating CCS projects 6... 34
Table 2-1: Carbon Dioxide Thermodynamic Data 1 ... ... 46
Table 3-1: A comparison of three different pipeline specifications... 69
Table 3-2 - Kinder Morgan C02 pipeline specification 23, 26... 71
Table 4-1: Typical values for shock geometry and corresponding Mach numbers 28..96
Table 4-2: Rampressor shock compressor specifications 7, 31 ... 98
Table 4-3: Ramgen Performance Claims 31... 116
Table 5-1 - Summary of results from heat integration calculations broken down per stage ... ... 130
Table 5-2 - Comparison of heat integration results ... 132
Table 6-1: Overall operating economics for various plant configurations ... 139
Table 6-2: Comparison of hand calculations and NETL report ... 141
Table 6-3 - Comparison of economics between the Rampressor and conventional compressor in both pre-combustion and post-combustion economics... 145
Table 7-1- Comparison of heat integration results ... ... 152
Table 7-2 - Comparison of economics between the Rampressor and conventional compressor in both pre-combustion and post-combustion economics... 154
Chapter 1
Introduction
1.1
Global warming can have harmful effects on
hu-man life
Global warming has been well-documented in both academic and popular literature, both of which have strongly influenced policy-making in developed countries around the world. The basic issues will be recapped in the following sections to allow the
analyses and conclusions of this study to be understood in context.
1.1.1 Increases in surface temperature have accelerated
It is a fact that the temperature of the Earth has been increasing rapidly in the indus-trial age. Historical climate data show that global temperatures have risen by about
0.2 C per decade for the last 30 years, which means the mean temperature of the world is now near its peak for the last 12,000 years (see Figure 1-1) '. In addition, the ten warmest years on record have taken place after 1990, showing the recent upswing in global temperatures. This sharp change in climate has also been perceived in
eco-logical systems. Several types of animal and plant species have been moving pole-ward by an average of 6 km a decade for the last 40 years. Seasonal events such as
Global Average Near-Surface Temperatures 1850- 2005 1.0 U0.2 C L E 0.4 0. 0.2 E ._ 0.0 -0.2 -0.4 1880 1880 1900 1920 1940 1960 1980 2000
Met Office Hadley Centre for Climate Prediction and Pesearch and CRU. University of East Anglia Oii 1re;mo1
Figure 1-1: Temperature chart showing how the earth has warmed 0.7 C since 1900 1
However, it must be noted that these increases in temperature have not occurred uniformly or consistently across the world. Temperature has varied sharply in
differ-ent parts of the world (see although there is a clear trend in an overall upward direc-tion).
I~1C4. V~4&
-* J8, 4 2 2
.- i -OSTM~ A4 t0- 003&j. 0
Figure 1-2: Regional temperature trends over different periods of the 2 0th century 2
Other significant changes that have taken place as a result of this perceived warm-ing of the globe include a 10% decrease of snow cover since the 1960s as well as an increase in total water vapor in the atmosphere by several percent 2. Most famously, sea levels have also been rising by about 1-2 mm a decade due to the expansion of water due to the warming, in addition to the melting of polar ice caps. Another well-known conclusion of the Third Assessment Report of the Inter-governmental Panel for Climate Change (IPCC) is that the variability of extreme precipitation events such as hurricanes has increased in the past decades.
1.1.2 Carbon Dioxide emissions are to blame for increases in surface temperature
The increase in temperature of the Earth can be explained by first understanding the technical details of the greenhouse effect. Radiant energy has two main sources - the Sun and the Earth itself. The significant difference in temperature between the two
..
.
.
.I
S.'5 - .$,. -.
bodies (some 5700 K) means that each body emits energy in different sections of the electromagnetic spectrum. For example, radiation from the Sun is at 2000 - 50000 cm- .whereas radiation from the Earth ranges from 50 - 2500 cm-1. This is important because radiation in the atmosphere can be absorbed by gas molecules, increasing their kinetic energy and causing them to collide with a greater impact with other gas molecules.
The greenhouse effect can be more comprehensively understood by examining Figure 1-3. The greenhouse gas layer can be modeled as a slab of glass, reflecting ra-diation in some wavelengths and transmitting others. Short-wave rara-diation from the Sun is transmitted, heating the earth to a temperature T. The Earth then emits
long-wave radiation according to Stefan-Boltzmann's law: U = y T4, where U is the up-ward flux of long-wave radiation. The amount of radiation reflected back to space is
called albedo. The average albedo is about 0.3, meaning 30% of the radiation from the sun is reflected back into the atmosphere3. In the diagram, U = 0.3 I.
A model can be constructed to depict the energy balance of the atmosphere as fol-lows:
(1-A) = eT4 (1.1)
4
In this equation A represents albedo (0.3), S represents solar constant of 1840 W/m2/K a, represents the Stefan Boltzmann constant 5.67 x 10⁻⁸ W/m2/K, E represents at-mosphere constant due to the greenhouse effect and T is the temperature in Kelvin. If we assume the atmospheric constant is 0.612, the average temperature of the Earth in
THE EARTHS SURFACE
Figure 1-3: The greenhouse effect 5 G represents the flux of radiation from the atmos-phere upwards and downwards and a represents the proportion of albedo absorbed by the atmosphere
There are many different greenhouse gases (or 'forcing' agents), but carbon diox-ide is the main absorber in the range of wave numbers from 500 to 800 cm-'. This is considered long-wave radiation, and is absorbed mostly by gases produced by humans such as methane. Other atmospheric gases such as nitrogen and ozone absorb radia-tion at much shorter wavelengths. Ozone is especially important since it absorbs a high proportion of incoming short-wave radiation. However, carbon dioxide is
con-sidered the most important gas in the atmosphere in terms of impact on the increase in temperature observed in the last few decades (see Figure 1-4).
oG
U
(I-8A) A A GAS LAYER :-T
l
U
_ __oxide
Nitrous
Oxi
Other CFCs
CFCs I
Figure 1-4: Relative contributions to additional radiation forcing (thus increasing the temperatures at the surface) between 1980 and 1990 1
Thus, the consensus in the mainstream scientific community is currently that the sharp growth in carbon dioxide levels in the atmosphere is due to human activity 1 2
Carbon dioxide is currently at a concentration of 367 parts per million in the atmos-phere .This is a significant increase from 285 ppm in 1750 (see Figure 1-5). It is thought that these levels of carbon dioxide have not been seen in the atmosphere for the last 20 million years. The sharp increase in the last few centuries and the corre-sponding decrease in oxygen suggest that these increases are due to the fossil-fuel combustion for energy purposes or possibly land-use changes from deforestation. 2 In
addition the concentration of carbon dioxide in the air trapped in the ice cores has dramatically increased since 1980. 2
(a)i 380 340 320 280 260 0 17so 8 120so S1000 S O _ Carbon Dioxide II 1.5 1.0 0.5 0.0
a.s
0.4 0.3 E 0.2 I0.I 310 NbtVoU Oxide 010 I. - 0.05 2 70 ** 0. 260 1000 1200 1400 100 1800 2000 YearFigure 1-5: Concentrations of various forcing agents over time and corre-sponding 'radiative forcing' (amount of energy absorbed per unit area) 2
The Kaya equation tries to formulate a relationship between carbon emissions and human activity by expressing net carbon emissions in terms of energy efficiency, eco-nomic efficiency and carbon intensity in energy sources used. It is best used to under-stand the breakdown of the wider global warming problem into four distinct smaller issues that can targeted separately by policymakers.
C= [GDP*E / GDP*Cg / E]- S (1.2)
Where
C = Net Carbon Emissions GDP = Gross Domestic Product
M I e I I e i ,
l Methane
E = Total energy use
Cg = carbon emissions generated in CO2
S = Natural or induced sequestration of carbon
This equation shows how carbon emissions are directly related to various factors
such as economic activity (GDP), overall energy efficiency in the economy (E/GDP) and carbon intensity of the energy (Cg/E). To provide some benchmarks, the energy intensity of the US economy from 1985 to 1996 was around 17 MJ per dollar of GDP (in 1987 dollars). This equation provides a useful framework in section 1.2 where each specific factor is examined in turn.
1.1.3 Consequences of global warming are disastrous
Naturally, a sudden change in global conditions can have sharp adverse effects on various worldly systems. Computer models predicting these changes have been
devel-oped by the IPCC, and they have released their forecasts complete with confidence levels (see Table 1-1).
Table 1-1: Changes in phenomenon due to global warming and the probability they will occur 2
B aglekinr i 4Ibpt4af I thigs t in pq isd thge'
cane iiatt r ut of f ti feb lopte hi liesgealuwa icirg ses mri
T od bt f t er hot a v nDL i til ing ae
Lnd areat
oNvr rary iil land areas
rtmh ver moat lr rv:y Vr
Lii. any re or lcue of ihet
Irwdl
;ivr Lnd VeW I kely. over onst arn Likely. wnr mayxetbfrn iore rltaiiet prd$LrAtini Ver, likIV, ove nu mIre. tLiely. iew iITen IIIcrVtitd Ninner cninlertat Lkeh 'ner rmrn iud-laittle drntn und iwiatted riskt cnrriatal mners iLuck ix crIivleit Not Aits e in rhe w anlv cI;liru ntl ropkal ekntK peik AI ly. ere trea
llla
li Iiiv liNlflk 4
li'&tfflideiA IuIs it 's'4Thtit Ivu;iv:u'w iii ft'4 s1 bPiwa fikfts Likely1 u At 'snrtstane aa
Broadly speaking, there are several risk factors, but perhaps the biggest one is the
possibility of a positive feedback loop, where global warming causes even more greenhouse gases to be emitted to the atmosphere, further aggravating the problem. This could be because of the permafrost thawing, thus releasing large quantities of
methane into the air, or else because higher temperatures enable plants and soils to take up less carbon from the atmosphere. The water cycle might become more volatile and lead to more extreme situations, worsening problems such as drought in some
parts of the world while producing more violent and damaging storms in other parts. Ocean and wind circulation patterns might be drastically and suddenly altered, harm-ing species that cannot evolve fast enough. Finally and most famously, the oceans may rise significantly due to the melting of the Greenland or West Antarctic ice
sheets, flooding several land areas.
Clearly these shifts could be catastrophic to an ecology used to changes occurring
at a much more moderate pace. Thus, many countries have decided to focus efforts on mitigating climate change by reducing greenhouse gas emissions instead of trying to
adapt to the problem. One of the chief targets of planned policy efforts has been that of stationary power systems.
1.2
The Importance of Power Systems in the effort to
reduce global warming
Because electric power generation relies on fossil fuels so heavily, it has become one
of the centerpieces of global warming government policy and clean energy initiatives around the world. In fact, 36% of US carbon emissions is solely due to the production of electricity. As mentioned previously, there are three ways of reducing carbon emis-sions from stationary power - increasing energy efficiency (reducing E/GDP in the Kaya equation), reducing carbon intensity of energy (Cg/E) or increasing sequestra-tion (S).
130 0-9 5. 4 3-Xi. o9ment) Pon a nd swv" se on etc,
Figure 1-6: Sources of global carbon dioxide emissions over the past 30 years 6
1.2.1 Increasing Energy Efficiency
It is thought that the most straightforward way of reducing carbon emissions is by im-proving the efficiency of the operations that burn carbon-heavy fuels. Half of all the electricity produced in the United States is generated from coal. There have been ma-jor gains in efficiency in both coal and gas power plants in the past few years, but the
low price of these fuels discourages their replacement by other fuels, or even up-grades of plant facilities to modern, more efficient equipment. Hence, the actual mean carbon emissions per power plant is far higher than what could potentially be ob-served if all plants used current standards for technology. What this means in practice is that carbon emissions per MWh generated could be dramatically reduced in the US
with efficiency gains. See
Table 1-2: Thermal Efficiencies of Modern Emission Systems 7
Power System Thermal Efficiency
(percent) Coal:
Integrated Gasilfication Combined Cycle (IGCC) 42-52 Coal:
Integrated Gasification, Fuel Cells (IGFC) 47-64 Coal:
High Performance Power Systems (HiPPS) 51-54
Coal:
Pressurized Fluidized Bed (PFB) 42-50
Natural Gas:
Combustion Turbine/Steam Turbine Combined Cycle 55-60 Natural Gas:
Fuel Cell/Combustion Turbine Combined Cycle 65-67
To put the table into context, the current average thermal efficiency for a power plant in the US is about 33%. Most of the power systems listed also use multiple power cycles instead of normal steam and Rankine cycles that only consist of one cy-cle each.
1.2.2 Reducing Carbon Intensity
The carbon intensity (defined above) of methane (CH4) which is a chief component of
natural gas is less than that of coal (see Table 1-3), which is why so many efforts to
reduce the carbon intensity of power plants have revolved around the increased usage of natural gas. Natural gas can also be used in higher efficiency combined cycles, where waste heat from a gas turbine is used to generate steam to drive another tur-bine. However, natural gas is typically more expensive than coal if the energy density of each fuel is taken into account. In addition reserves of natural gas are not as plenti-ful and accessible as those of coal, implying that a scale up of natural gas consump-tion may drastically impact price. One bright prospect might be the producconsump-tion of natural gas from hydrates, which will significantly increase supply.
Table 1-3: Carbon intensity of Fossil Fuels
Fuel Carbon Intensity
(gC/MJ)
Coal 23-26
Oil 19
Natural Gas 13
Other ideas to reduce the carbon intensity of fossil fuel power plants include the co-firing of coal with biomass. Biomass is conventionally thought to have zero carbon intensity since plants fix carbon dioxide from the atmosphere, and burning plants is
considered to be simply releasing that carbon back into the atmosphere (therefore adding zero net carbon).
1.2.3 Carbon Capture & Sequestration (CCS)
Perhaps the most technologically advanced method of reducing the carbon emissions from stationary power systems is the set of technologies that embody sequestration
-the term given to -the trapping of carbon dioxide produced by combustion within sub-terranean repositories instead of releasing it into the atmosphere. These natural bodies are generally contained within the ground; for example, depleted oil and gas fields or subterranean saline aquifers are potential sites for carbon sequestration. Other
possi-ble sinks that could be used for sequestration are deep parts of the ocean as well as coal seams.
The overall process for sequestration involves capturing the carbon dioxide at the
point of its generation, pressurizing it to a supercritical state and then transporting it for sequestration. All of these steps tend to add significant cost to the power-generation process, and so there has been a lot of research into figuring out how to reduce their cost.
But there is evidence that the popularity of CCS as a method of mitigating global warming and reducing carbon dioxide emissions is growing. There are projects of
varying scales and national origins that have been launched in the past decade (see Table 1-4). The increase in popularity and scale of the projects shows that CCS is in-creasingly being acknowledged as a viable solution throughout the world. In the US alone it was a major focus of the 2008 presidential election and a central part of the
energy platform that President Barack Obama campaigned on 8
Table 1-4: Summary of planned and operating CCS projects 6
Project Location Operator Storage Injection Annual Total
Type Start Injection Planned Date Rate Storage Sleipner North Sea StatoilHydro Aquifer 1996 1 Mty 20 Mt Weybum Saskatchewan, EnCana EOR 2000 1.2 Mt/y 19 Mt
Canada
In Salah Sahara, Sonatrach, Depleted 2004 1.2 Mty 17 Mt Algeria BP, Gas
StatoilHydro Reservoir
Salt Wyoming, Anadarko EOR 2006 2.2 MtvNy 27 Mt Creek USA
Snohvit Melkoya, StatoilHydro Aquifer 2007 0.7 Mty Norway
Gorgon Barrow Chevron Aquifer 2 0 09' 3.2 Mty >100 Mt
Island, Australia
Average annual delivery rate over 15 year CO contract Peak annual storage rate
Planned date
1.3
Objectives and Organization of Thesis
This thesis will focus on the capture and compression components of CCS, in both
pre-combustion capture and post-combustion capture situations. The broad purpose of this thesis is to evaluate a new compression technology - shock compression - in the context of the technological developments in capture-enabled power plants and
com-pressors. The evaluation will be technical as well as economic - the objective is to communicate to the inexperienced reader how the new technology works, why it's important and what potential it actually has to be the 'game-changer' it is claimed to
be. There has been no published work that performs this type of in-depth analysis of this new and potentially ground-breaking compressor.
There are six chapters to this thesis, including this introductory one. Chapter 2 ex-plains carbon capture in more detail, discussing both the technical options available as well as performing a basic comparison between the accepted alternatives. Chapter 3
delves into compression technologies and how they have evolved in design and popu-larity, with some sample calculations to illustrate how properties of a gas change due to compression. Chapter 4 specifically investigates shock compression, a new tech-nology being developed by Ramgen to lower the costs of compression in capture-enabled systems. Chapter 5 involves a detailed energy balance of the Rampressor sys-tem, using both basic hand calculations as well as a detailed Aspen model in order to quantify the benefits of the Ramgen technology and compare it to conventional com-pressors. Chapter 6 offers an economic analysis using base cases to compare costs be-tween conventional and Ramgen compressors, and also states the conclusions of this thesis and future work to be done.
Chapter 2
CO
2Capture Technologies
2.1
Background
As discussed in the previous chapter it has been shown that the problem of global warming is directly related to the increase in emissions of carbon dioxide (CO2), mostly because of increasing fossil fuel and changes in land use 2. Thus, there is a
po-litical movement to regulate carbon emissions from high carbon content fuels like coal. However, carbon regulation is expensive; it reduces the energy efficiency of the power generation process and increase capital cost of the plants. The same can also be said of carbon dioxide compression technologies. These are geared either towards transportation to an underground location where carbon dioxide can be stored (a proc-ess called geological sequestration) or towards transportation to enhanced oil recovery (EOR) fields. Hence, there is an intensive research effort focused on the discovery and improvement of carbon capture and compression technologies used in the process to improve their economic feasibility.
The purpose of this chapter is to provide an overview of the different categories of carbon capture technologies in power plants and provide a context for the subsequent discussion of how new compression technologies can be combined with capture methods to drive down plant costs and thus help mitigate the problem of global warm-ing.
2.2
CO
2Capture
The efficient separation of CO2 from the gas streams produced by the burning of coal
requires sophisticated technology. Currently there are various means for achieving
this separation, of which five have gained significant prominence 9 10
- Post-combustion
- Post-combustion Chilled Ammonia
- Pre-combustion IGCC
- Oxy-Fuel Combustion
- Chemical looping combustion
2.2.1 Post-combustion
Post-combustion CO2 separation applies to the removal of CO2 from the flue gas
streams of a power plant by methods such as adsorption (chemical/physical) or mem-branes. Chemical solvents such as amines are especially cost-effective in natural-gas sweetening and hydrogen production applications.
One of the basic processes is as follows: flue gases from the power plant are
chilled first and then stripped of SO, and NOx contaminants. A fan is used to account for pressure drops in the system, after which the stream passes through an absorption unit where a lean amine solution such as monoethanolamine (MEA) contacts the gas to absorb the CO2. Subsequently, the clean gas stream is removed via the stack,
whereas the CO2 rich amine stream moves to a stripper to separate the amine from the
CO2. The latter process is powered by steam used to heat a reboiler. Further
separa-tion can be achieved by condensing the stream emerging from the top of the stripper column to separate the CO2phase, after which it is sent for drying and compression.
A post-combustion generation plan with CO2 as shown in Figure 2-1 produces 500
MW of power requires 37% more coal per day than a generation plant without CO2.
The efficiency is reduced from 34% to 25% due to the additional energy required for CO2capture. 9
WMllt
Figure 2-1 - Post-combustion capture of CO2 9
The benefit of this process is that it is well-understand and verified under field conditions. The disadvantages of post-combustion capture are:
- The energy penalty is high for the solvent regeneration step in the stripper
- The equipment used in this process is at risk of corrosion and so maintenance costs are high
- Certain expensive solvents evaporate into the vapor stream and so must be re-placed
'f; I
2.2.2
Post-combustion chilled ammonia
Chilled ammonia as a solvent is similar to an amines solvent, except with a slightly lower absorption rate. Used in CO2 absorbers, it contains a mixture of dissolved and
suspended ammonium carbonate that counter-currently contact the incoming flue gas (chilled to 1.6 C). The chilled ammonia solvent is expected to capture upwards of 90% of the CO2 present in the incoming flue gas. It can then be regenerated under a
high pressure to reduce the energy required for compression and liquefaction of the
CO2. On the other hand, the clean gas is emitted through the stack, containing only a
low amount of C02, some oxygen and some nitrogen.
This process remains experimental, as there have not been any commercial plants launched using this process (although Alstom is developing a pilot test). Hypothe-sized advantages of the process are a potentially lower energy requirement, lower ammonia emissions, high absorption efficiency of CO2, low degradation of the am-monia solvent, and a potential overall cost that is lower than half of the next-lowest
CO2 capture process currently being studied.
In contrast, there are thought to be several disadvantages as well. The concentra-tion of dissolved ammonia in the liquid CO2 stream may not allow for carbonate
for-mation. In addition, more packing and absorber vessels are needed to account for the slower absorption rate, which drives up the capital cost. Finally, the only advantage in this process is from the reduction of the CO2 compression energy requirements with the use of high-pressure solvent regeneration.
2.2.3 Pre-combustion
IGCC refers to an Integrated Gasification Combined Cycle process, where electric
power is made from syngas (a combination of hydrogen and carbon monoxide) which in turn is made from coal in a gasification unit. A materials flowsheet of a typical
IGCC process without carbon capture can be found in Figure 2-2. Electricity is
pro-duced from the combustion of the syngas, which provides exhaust heat to boil water and produce steam. This steam can be used to generate electricity in a steam turbine system.
w.
wro ON*
SO[*MW
W+ 424 l)"It W
:rkft5E
"kPMr
Figure 2-2 - A depiction of an IGCC process without carbon capture 9,11
In an IGCC process with carbon capture (Figure 2-3), a water-gas-shift reaction converts most of the water and carbon monoxide in the syngas produced by the gasi-fier into CO2 and H2 respectively. This syngas is treated in an Acid Gas Removal
process where a physical solvent like Selexol or Rectisol is used to capture the CO2 and H2S from the syngas. The Selexol is regenerated via a stripping process that
moves most of the H2S and sends it to a Claus unit for sulfur recovery (to be sold on
the market). The H2 is also removed in this process and sent to a gas turbine to be
burnt for electricity. The CO2 is flashed off at various pressures, compressed and sent
into a pipeline system. The number of shift steps in the process determines the maxi-mum amount of CO2 captured and H2 recovered.
Operating an IGCC plant with carbon capture adds 23% to the daily coal feed re-quirements, compared to 37% for a post-combustion plant. The overall generating ef-ficiency is higher, however, at 31.2% when compared to 25% for a post-combustion plant.
I9~V~t
r~~VMI3aa
2 Qitl~kt
Figure 2-3: IGCC process with Carbon Capture using a Selexol process 9
The major advantage of this IGCC pre-combustion process is the lower amount of fluid that needs to be treated (just the syngas versus the entire flue gas stream in a post-combustion unit). In addition, similar to post-combustion capture, the energy re-quired in the AGR unit consists mostly of the pump energy and the steam needed in the reboiler of the H2S stripper. As IGCC technology matures, many of the
disadvan-tages can be eradicated with careful engineering. For example, earlier in IGCC devel-opment plant availability was a significant issue due to design and materials
prob-lems. However these issues were taken care of and now it is thought that with
eco-nomics of scale the IGCC may prove to be economically feasible one day. 9
2.2.4 Oxy-Fuel Combustion
Instead of resorting to a water-gas shift reaction to produce C02, oxygen gas can be
used in place of air to combust the coal. This produces extremely pure streams of CO2 that is easier to capture at a low cost. There is far less volume of flue gas leaving the boiler than that of an air-fired process, simply because of the lower amount of inert N2 in the stream.
An air-separation unit (ASU) is required to separate the oxygen from the nitrogen in air. Novel membrane and ceramic technologies are helping to reduce the high
elec-tricity requirement imposed by oxygen recovery from air. Oxy-fuel is considered to have great potential, and many theoretical offshoots are being developed such as a Graz cycle where the fluid following the combustion is made up of three quarts steam and one quart oxygen.
The main benefit of oxy-fuel processes is that the high purity of CO2 in the flue
gas stream means that capture costs have been significantly reduced. The low vol-umes of gas needed also reduce the required boiler size; combustion is more efficient with such high purity oxygen. Finally NOx emissions are also reduced due to the in-significant presence of N2 in the gas stream.
On the downside, the ASU requires a high amount of energy (up to 20% of power output). Also infiltration of air into the process is a difficult problem to overcome since it reduces the efficacy of the process and may force further distillation to purify the CO2emerging from the combustion process.
A# .. .. 4r xu . . . . . Litfb
Figure 2-4: 500 MW Oxy-fuel generation plant 9
2.2.5 Chemical Looping Combustion
Chemical looping combustion, also known as CLC, uses an oxide solid to transport oxygen from the air used for combustion to a fuel such as syngas, natural gas or refin-ery gas. This prevents direct contact between the air and the fuel, and the flue gas will have a lower volume since the nitrogen is kept separate from air. The oxidation reac-tion in air is exothermic, and the oxide retains the heat for the endothermic reducreac-tion reaction with the fuel. The net heat produced is roughly the same as regular combus-tion with full direct contact. In a pulverized coal applicacombus-tion, the particulates in the flue gas are subsequently removed, yielding a high purity CO2
.
The benefits of such a process include the fact that no energy needs to be con-sumed to separate oxygen in an ASU unit, and a high purity CO2 is rendered in the
~~E~p~r ~1
flue gas. Carbon capture is tremendously efficient, and capture rates of up to 98% are
economically feasible. Also, retrofitting is relatively straightforward.
The drawbacks of this system include limited experience, especially with coal
processes, limited range of metal oxides that can be used and the possibility of solid
carbon deposition as well as the formation of carbon monoxide. 10
2.3
Thermophysical properties
In order to understand compression of carbon dioxide, it is imperative that good physical data of its thermodynamic properties be available. The following section pre-sents a brief overview of the salient physical properties of CO2.
Table 2-1: Carbon Dioxide Thermodynamic Data "
Molecular Weight 0.097 lb
Triple Point Temperature -70 F
Triple Point Pressure 75 psia
Normal Boiling Point Temp -109 F
Freezing Point Temp -70 F
Critical Pressure 155 psia
Critical Temperature 87.53 F
Critical Volume 0.094 m^3/mol Critical Compressibility 0.274
Accentric Factor 0.239
Enthalpy of Formation (25 C) -373 BTU/ mol
Gibbs Energy of Formation (25C) -374 BTU/mol
Heat of Vaporization 14.5 BTU/mol
Understanding the supercritical phase properties of carbon dioxide is vital to working with CO2 compression technology. The critical point of carbon dioxide was
men-tioned in Table 2-1 to be 87.53 F and 155 psia. Above this temperature and pressure, carbon dioxide enters a phase characterized by a high density gas, solubility attributes similar to that of a liquid and diffusivities similar to that of a gas 12. In addition, mass transfer properties and viscosities mimic that of a normal gas. is the phase diagram.
E (D
in
o. -140 -120 -100 -80 -60 -40 -20 0 20 40 60 80 100Temperature ("C
Chapter 3
Compression Technology
The purpose of this chapter is to understand the various challenges in continuously pressurizing large volumes of CO2 and present background information that will be
critical to the analysis of new types of compressors. First, an overview of compres-sion will be presented with some basic economic facts about the importance of com-pression in power systems. After that, a basic technical analysis of how compressors
work will be presented, including useful equations to determine heat evolved and power requirements. Next, the evolution of compression technologies from concep-tion to the state-of-the-art will be described in order to set the stage for a
comprehen-sive study of current widely-used compressor technologies. Also basic data concern-ing the specifications for the compression section will be listed.
3.1
Compression costs are high in capture-enabled
power systems
CO2 compression is a key step in any capture process as a conduit between capture
and transportation for geological injection or enhanced oil recovery. It is currently a major obstacle in addressing CO2 capture needs, simply because of the high energy
requirements needed for compression. The compression penalty is around 8-12% of
power for a coal fueled integrated gasification combined cycle (IGCC) plant [Rao]. Also in the case of 90% capture and compression up to 2200 psia, auxiliary power
load is increased by 40% relative to the case with no capture. Of this increase, ap-proximately half is due solely to the load of CO2 compression.
A more detailed cost breakdown for CO2 compression based on $/tonne CO2 is
10.48 for power, 0.88 for Operations & Maintenance and 3.30 for Capital Cost ( based on an electricity price of 10 cents per kilowatt-hr) 15
Given this significant energy penalty and thus high cost relative to other incre-mental capture technologies, it is necessary that we also have a detailed understanding
of how compression technology works.
3.2
Compressor Theory
A compressor is a machine that pressurizes a relatively large volume of gas.
Compres-sor technology relies on basic thermodynamic relationships that describe how gas temperature, pressure and compressor work are interconnected. This section will
dis-cuss some of the most important design equations in the compressor industry. The equations will help us understand how the basic properties of a gas - temperature, pressure, mass flow and volume are inter-related and how these are related to impor-tant process quantities like work required and heat evolved, which are significant in
deciding on the optimal compression technology for CO2.
The ideal gas law describes how pressure, temperature and volume are related for
a gas whose molecules have no attractive or resistive forces between each other. Its basic form is
Pv = RT (3.1)
where
P = absolute pressure v = specific volume
R = gas constant
T = absolute temperature
If a real gas is considered, a compressibility factor Z can be introduced, as in the
fol-lowing equation:
Pv = ZRT (3.2)
These compressibility factors are empirically determined under a wide range of condi-tions and can be found from compressibility charts.
Another important concept is that of critical temperature and pressure. The critical temperature of a gas is the temperature above which a gas cannot be liquefied regard-less of pressure. The critical pressure is the pressure at which the gas liquefies at the critical temperature.
Another basic concept (Dalton's Law) is that the total pressure of a mixture of a
gas is the sum of the pressure of each of the gases, or their individual 'partial pres-sure'. This is in turn equal to the mole fraction of each gas multiplied by the total
pressure.
The speed of sound in a specific gas is an important factor in designing a com-pressor to predict the presence of shock waves within the machinery. Acoustic veloc-ity can be found by
c= kRgT (3.3)
Where
c is the acoustic velocity k is the ratio of specific heats R is the gas constant
g is the gravitational constant T is absolute temperature
The Mach number is another standard metric used in the compressor design industry.
It is given by
M = U/c (3.4)
Where M is the Mach number and V is the uniform flow velocity.
The first law of thermodynamics hypothesizes that energy cannot be destroyed or created, but only transformed from one state to another. From this principle, the fol-lowing general equation can be derived that accounts for a steady flow process:
V2 V2
hA +- + z
+
Qh
= h2 2 +z W (3.5)2g 2g
where
W is shaft work into or out of the system h is enthalpy
z is height relative to a reference
Q is heat input to a system
In this equation, the velocity term can be incorporated into the enthalpy term to form a total enthalpy term. Thus the equation becomes
h2 -h , = -W + Qh (3.6)
The second law of thermodynamics postulates the existence of entropy by stating that heat cannot flow from cold to hot without work being done. The basic equation that is
useful for compressor technology is:
du = Tds-Pdv (3.7)
where
du is the differential of internal energy
ds is the differential of entropy dv is the differential of volume
From Maxwell's thermodynamic relations, it can be found that
For an isentropic process, dS =0. This means
dh = vdP (3.9)
For an isentropic process that is also adiabatic, the following is true:
Pvk = constant = C (3.10)
Thus the differential of Pressure, dP is given by
dP = C (-k) v-k-' dv (3.11)
Substituting equation (3.9) in equation (3.11), we get
dh = C(-k)v-kdv (3.12) This can be integrated from state 1 to state 2 with the assumption that k remains
con-stant to give
h2 - C21-k - Vll-k k (3.13)
k-i
Substituting equation (3.11) in (3.13), we get
h2 - = 2 - P k (3.14) k-I
We can then use the ideal gas law to get this expression in terms of temperature
h2 - h, T-) k (3.15)
k-1
This expression can be rearranged by factoring out T1 to provide this expression in
terms of temperature ratio:
h2-ha = ( T -1) (3.16)
We also know that enthalpy difference for an adiabatic process can be presented as
h2 =Cp(T2 -_ ) (3.17)
With the use of algebraic rearrangement as well as equations (3.10) and (3.1), we can find the temperature ratio in terms of pressure ratio
k-1
T 2 -P2 k (3.18)
Combining the above equations, an important equation for compressor adiabatic head can be derived. k-I k P, k H a = h h, = ZavgR ( )(-2 -1) (3.19) k-1 P where
Ha is the adiabatic head
Zavg is the average compressibility (Zi+Z2)/2
For a process that is real or polytropic, the following relation can be derived:
n-I n
P2
H = h2 -h = Zav,,gRT( )( -1) (3.20) n-1 J Where n is given by n-1 k-1 1 =( )- (3.21) n k 7pqp is the polytropic efficiency
The adiabatic power, which uses an adiabatic efficiency, can be found by
Wa = m Ha / 7a (3.22)
where m is the mass flow rate
The polytropic power uses a polytropic efficiency and can similarly be found by
WP = mH, / 77P (3.23)
In industrial applications, it is common to separate the compression process into stages, with intercoolers in between. The reason for this is that it reduces the dis-charge temperature after each stage as well as the volumetric flow of the gas stream; this limits the energy required by the process, decreasing overall operating costs.
Intercoolers also help to reduce the required pressure ratio per stage. Indeed, having multiple stages with low pressure ratio per stage may require less operating cost but higher capital cost than a compression train of few stages but high pressure ratio per
stage. In many industries, the pressure ratio is only around 1.5:1 or 2:1. In certain ap-plications, however, it might be useful to have a higher discharge temperature so that the heat can be used for any heat-intensive operations in the entire plant process. A careful evaluation must be performed to determine which option is most economically feasible.
Intercoolers can be water-cooled or air-cooled. Cooling water adds significant operating expense whereas air-cooling adds capital cost. Also air-cooling is subject to far more variability in the temperatures of the ambient air, which makes the process
difficult to predict and control. If condensation is expected, there must be a way to remove the liquid fraction of the fluid stream, since compressors are sensitive to liq-uid. The removal of the liquid fraction also changes the volumetric flow rate of the stream, which must be accounted for in the compressor design.
Isothermal compression is a different type of compression than adiabatic or poly-tropic, and represents the ideal form of compression where there are an infinite num-ber of intercoolers and stages. Understanding isothermal compression is useful as it helps quantify the upper limits of horsepower savings from cooling.
An isothermal process implies
Pv = C (3.24)
From this and integrating the differential work equation, we find that the theoretical power requirement for an isothermal compression is found by
W = wRT In (P2
/ P
3.2.1 Example calculation
To understand how these equations are used and the effect of intercooling and multi-ple stages, it will be helpful to trace through an exammulti-ple calculation comparing the effect of different numbers of intercoolers on discharge properties and power re-quirements.
Assumptions: 100% efficient compression, ideal gas and ideal cooling with no
pressure drop and the outlet temperature of the cooling process being the same as the inlet to the first stage. The situation is as follows:
Gas= Carbon Dioxide (Mol Wt = 44 g/mol) Specific heat capacity ratio, k = 1.4 Inlet pressure = 20 psia
Outlet Pressure = 180 psia Inlet Temperature = 80 F
Weight flow = 100 lb/min
R = 1545/44 = 35.1 ft-lb/lb oR
T, = 140 oR +460 OR = 600 OR
(k-l)/k = 0.286
Base Case- No intercooling
Final temperature as given by equation (3.18)
From equation (3.20)
Ha = 1 x 35.1 x 600 * (90.286 -1) / 0.286
= 64403.87 ft-lb /lb oR
From equation (3.23)
Wa = 100 * Ha /33000 = 195.16 hp
Case (1) - One intercooler
Final temperature as given by equation (3.18)
Tf= 600 (30.286) -460 = 361.50 OF
The compression ratio per stage is calculated as (Pfinal/Pinlet)"n where n is the number of stages.
One intercooler implies two stages, so the compression ratio per stage is given by
rp = 91/2 =3 From equation (3.20) Ha = 1 x 35.1 x 600 * (30.286 -1) / 0.286 = 27184.17 ft-lb /lb oR From equation (3.23) Wa = 100 * Ha /33000 *2 = 164.76 hp
This amounts to 84% of the base case power requirement
Case (2) - Two intercoolers
Final temperature as given by equation (3.18)
Tf= 600 (2.080.286) -460 = 279.81 OF
rp = 91/3 =2.08 From equation (3.20)
Ha = 1 x 35.1 x 600 * (2.080.286 -1) / 0.286
From equation (3.23)
Wa = 100 * Ha /33000 *3 = 155.97 hp
This amounts to 80% of the base case power requirement
Case (3) - Infinite intercoolers (isothermal compression)
From equation (3.23)
Wa = 100 * 35.1 * 600 * In (9) /33000 = 140.22 hp
This amounts to 71% of the base case power requirement
There are several conclusions we can draw from this exercise. First, it's clear that intercoolers reduce the total amount of horsepower required to drive the compressors. However, it's also evident that each additional intercooler has a reduced impact on horsepower savings. The first intercooler saves 16% of the energy, whereas the sec-ond only saves 4% extra. After that, an infinite number of coolers only saves an addi-tional 9%. This manifests the decreasing returns of adding extra coolers in a
multi-stage compression train.
The effect on the temperature rise is also apparent. The highest temperature differ-ence from the base case is about 300 F in the one intercooler case, whereas adding an additional intercooler only reduces temperature by another 80 F. This is another ex-ample of how the additional first intercooler has the bigger overall impact on gas properties.
As mentioned in chapter 2, the critical temperature of CO2 is around 88 F whereas
the critical pressure is 155 psia. This means that the compressed stream of C02 will at some point become supercritical in phase. This point obviously varies depending on how many stages are present, but care must be taken so that liquid is not formed since many compressors cannot handle liquid. Instead, the discharge stream can easily be cooled into liquid phase and then pumped for sequestration or enhanced oil recovery.
It is also useful to understand how an ideal vapor-compression cycle works, since
it bears at least some similarity to compression in industrial applications. Saturated vapor is fed into a compressor, which pressurizes it. The subsequent temperature rise makes the vapor superheated. This vapor is then cooled in a condenser to become a
saturated liquid, releasing heat. The liquid is expanded across a valve to produce a mixture of liquid and vapor. This mixture is then heated to reproduce the saturated liquid.
Figure 3-1 depicts the process on a temperature-entropy diagram. Heat is ab-sorbed from step 5 to 1, and heat is rejected from step 2 to 4. The amount of heat can be determined from area under the curve.
6.1 a. a:'
Entropy
Figure 3-1- Temperature-entropy diagram of an ideal vapor-compression cycle
In a real compression train, the only important steps are 1 to 3, since there is no creation of saturated liquid in a real compressor. 1 to 2 represents one stage of a com-pressor, and 2 to 3 represents intercooling. Instead, in a normal comcom-pressor, the cycle
starts again at point 3 as the saturated vapor is pressurized in the next stage.
Figure 3-2 depicts two-stage compression. Saturated vapor is sent to the first compressor stage at point 1, and then compressed to point 2. The gas is then cooled to
1 to 2 = Compression of vapor
2 to 3 = Vapor superheat removed in condenser 3 to 4 = Vapor converted to liquid in condenser
4 to 5 = Liquid flashes into liquid + vapor across expansion valve 5 to 1 = Liquid + vapor converted to all vapor in evaporator
point 3 after which it is sent to another compressor stage and pressurized to point 4.
The heat rejected in this process is the area under the 2-3 curve.
CarbonioxiO 50 70 o60 50 40 20 10 -2.00 -1.75 -.50 -1 25 -100 -0.75
Figure 3-2- Temperature-entropy diagram involving two stage compression 16
3.3
Turbomachinery Technology Evolution
The history of compressor technology is mostly intertwined with the long process of developing a suitable gas turbine 1 '8. The main challenge remains attaining a level
of compressor efficiency.
The first known fluid-based machinery was a paddle water wheel developed by
the Romans over two thousands years ago. The function of these 'impulse' wheels was to grind grain. At around the same time, a Greek inventor named Hero developed
the first steam-powered engine. The design consisted steam jets connected tangen-tially to a small spherical closed vessel, so that the vessel would rotate upon the reac-tion of the steam jets.
The next major development was much later, in 1551, when an Islamic engineer developed an impulse steam engine that turned a spit. The eighteenth century brought a revolution in turbine technology. In 1705, descriptions of centrifugal pumps and blowers were published. Leonhard Euler investigated Hero's turbine and derived a


![Figure 3-3: The various types of compression technologies [Wikipedia]](https://thumb-eu.123doks.com/thumbv2/123doknet/14510709.529638/64.918.119.629.98.359/figure-various-types-compression-technologies-wikipedia.webp)